Near-infrared spectroscopy of EX Lupi in outburst
Abstract
EX Lup is the prototype of the EXor class of young eruptive stars: objects showing repetitive brightenings due to increased accretion from the circumstellar disk to the star. In this paper, we report on medium-resolution near-infrared spectroscopy of EX Lup taken during its extreme outburst in 2008, as well as numerical modeling with the aim of determining the physical conditions around the star. We detect emission lines from atomic hydrogen, helium, and metals, as well as first overtone bandhead emission from carbon monoxide. Our results indicate that the emission lines are originating from gas located in a dust-free region within 0.2 AU of the star. The profile of the CO bandhead indicates that the CO gas has a temperature of 2500 K, and is located in the inner edge of the disk or in the outer parts of funnel flows. The atomic metals are probably co-located with the CO. Some metallic lines are fluorescently excited, suggesting direct exposure to ultraviolet photons. The Brackett series indicates emission from hot (10 000 K) and optically thin gas. The hydrogen lines display a strong spectro-astrometric signal, suggesting that the hydrogen emission is probably not coming from an equatorial boundary layer; a funnel flow or disk wind origin is more likely. This picture is broadly consistent with the standard magnetospheric accretion model usually assumed for normally accreting T Tauri stars. Our results also set constraints on the eruption mechanism, supporting a model where material piles up around the corotation radius and episodically falls onto the star.
Subject headings:
stars: pre-main sequence — infrared: stars — stars: activity — techniques: spectroscopic — stars: individual(EX Lup)1. Introduction
Young eruptive stars form a special class of pre-main sequence objects. The class is defined by unpredictable brightenings of up to 5 mag at optical wavelengths, and it is believed that temporarily increased mass accretion from the circumstellar disk onto the star is responsible for the flare-ups (Hartmann & Kenyon, 1996). In spite of their relatively small number (around two dozen stars), young eruptive stars are key objects in understanding early stellar evolution. On the one hand, the mass inflow during outbursts contributes to the build-up of the final stellar mass, which would otherwise be difficult to explain considering the observed typical rates of mass accretion (less than 10-6 M, Kenyon et al., 1994; Evans et al., 2009). On the other hand, the eruptions affect the density, temperature, and chemical structure of the disk, possibly also influencing the conditions of planetesimal and planet formation in the terrestrial zone (Ábrahám et al., 2009).
One of the two main groups of young eruptive stars is called EXors, named after the prototype EX Lup. These objects produce smaller, 1-3 mag flare-ups every few years for a period of a few weeks as well as rare 5 mag extreme outbursts lasting several months (see e.g. the light curve of VY Tau in Herbig 1977 or that of EX Lup in Herbig 2007). Although accretion is the likely source of power for the outbursts, fundamental aspects of the mass inflow process in EXors require significant clarification.
For a normally accreting T Tauri star, the stellar magnetic field truncates the accretion disk at a distance of a few stellar radii above the stellar surface. From that point, the material is magnetically channeled onto the stellar surface along funnel flows (Bouvier et al., 2007). During outburst, the accretion rate is enhanced by a few orders of magnitude, and it may be the case that the magnetic field can no longer truncate the inner regions of the accretion disk and hence disk material is dumped onto the star along the equatorial plane in a boundary layer (Popham et al., 1996). It remains an open question as to what path the accreting material follows in young eruptive stars like EXors.
EX Lup (d=155 pc, Lombardi et al., 2008) produced its most extreme eruption in 2008 (Jones, 2008; Kóspál et al., 2008a). This made it the center of attention and the subject of many different kinds of observations. Our group conducted a coordinated multi-wavelength observing campaign at a single epoch, as well as monitoring studies during the outburst.
The optical spectroscopic data of this campaign, which will provide insight into the accretion and wind processes, will be presented in Sicilia-Aguilar et al. (in prep.). In Goto et al. (2011) we analyzed the CO fundamental emission lines using high resolution spectra in the thermal near-infrared and found that the emission comes from two separate physical components: a narrow line component which is constant in time, and a broad line component which is closely related to the outburst and is decaying with time. In Ábrahám et al. (2009) we reported on on-going crystallization of silicate grains during the outburst, and our monitoring of the crystalline silicate features showed evidence for a fast radial transport of silicate crystals (Juhász et al., submitted). In Juhász et al. we also modeled the whole optical-to-mm spectral energy distribution of EX Lup in outburst and found that most of the accretion luminosity is emitted as a single temperature blackbody of 6500 K.
In this paper we present the medium resolution near-infrared spectra of our campaign, and use the observed emission lines to analyze the location, kinematics, and energetics of warm atomic and molecular gas present in the inner few tenths of AUs in the EX Lup system.
2. Observations and data reduction
2.1. Near-infrared spectroscopy
We observed EX Lup with SINFONI, an adaptive optics (AO) assisted integral field spectrograph installed on the UT4 telescope of the VLT (Eisenhauer et al., 2003; Bonnet et al., 2004). Measurements were taken in service mode at three different epochs, on the nights 24/25, 28/29, and 30/31 July 2008, as part of the project 281.C-5031 (PI: M. Goto). Three dimensional spectra were taken with the J, H and K gratings using a Hawaii 2RG detector. The dispersion of the selected mode was 0.145 nm/pixel in the J band (1.10–1.45m), 0.195 nm/pixel in the H band (1.45–1.85m), and 0.245 nm/pixel in the K band (1.93–2.45m). The spectral resolution was 2400, 4100, and 4400 in the J, H, and K band, respectively. Spectra were obtained by rotating the instrument by 0∘, 180∘, 90∘, and 270∘, in order to be able to better remove instrumental effects. Exposure time was 1 min for each rotator angle, giving a total exposure time of 4 min per band per epoch. Beside EX Lup, calibration sources of spectral type G2V were also observed in order to enable proper telluric correction: HIP 93685 and HIP 79464 were observed in the J band on 25 July, HIP 80982 was observed in all three bands on Jul 29, and HIP 78652 was observed also in all three bands on Jul 31.
We started the data reduction with product files provided by the SINFONI pipeline as part of the service mode data delivery: product code SCDJ (full, coadded science product cubes) for the science target, and PCST (full, coadded standard star cube) for the telluric standard. These files contain dark current-subtracted, flatfield-corrected, sky-subtracted, wavelength-calibrated, co-added data products in the form of 64 pixel64 pixel images for each wavelength, with a spatial scale of 12.5 mas/pixel and a field of view of 0808. Further data reduction was done using custom-written IDL scripts. For both the science target and the telluric calibration stars, we first calculated the centroid for each image in the data cubes. Then we extracted spectra by using an aperture with a radius of 10 pixel and a sky annulus between 20 and 25 pixel to calculate the flux of the star at each wavelength. The spectrum of the telluric standard star contained not only the telluric absorption lines, but intrinsic stellar photospheric lines. To correct for the latter, we used the normalized solar spectrum available at the SINFONI webpage111These spectra were created from data made available by the NSO/Kitt Peak Observatory, produced by NSF/NOAO.. We multiplied it by a blackbody, convolved it to the spectral resolution of SINFONI and scaled it. By changing the temperature of the blackbody, the width of the Gaussian convolution kernel, and the scaling factor, it was possible to remove any intrinsic stellar features from the telluric correction spectra. The obtained correction curves characterize the transmission of the atmosphere as a function of wavelength (Fig. 1). Since for the first night no H and K calibration observations were available, we used the average of the curves obtained on the two other nights. Finally, the spectra of EX Lup were divided by these correction curves, and the results were normalized by fitting a third degree polynomial to the continuum.
Comparison of the spectra taken on the three different nights revealed insignificant differences, thus we averaged them to increase the signal-to-noise ratio (S:N). For most of the following analysis, we used these averaged spectra, which are plotted in Figs. 2, 3, and 4. S:N is 80–160 in the middle of the atmospheric windows and far from strong telluric bands (e.g. at 1.23–1.27m, or at 2.21–2.28m), 40–80 where there are strong telluric absorption (e.g. around 2.01m), and 20–40 at the edges of the atmospheric windows (e.g. above 1.34m in the J band or above 2.40m in the K band).

2.2. Near-infrared polarimetry
We have acquired AO-assisted near-infrared polarimetric observations of EX Lup in visitor mode using the NACO instrument mounted on the UT4 telescope of the VLT on 10/11 April 2008, as part of the project 381.C-0241 (PI: Á. Kóspál). NACO consists of the Nasmyth Adaptive Optics System and the CONICA near-infrared camera (Lenzen et al., 1998; Rousset et al., 2003). The observations were made using the differential polarimetric imaging technique (DPI; see e.g. Kuhn et al., 2001). The basic idea of the DPI is to take the difference of two orthogonally polarized, simultaneously acquired images of the same object in order to remove all non-polarized light. As the non-polarized light mainly comes from the central star, after subtraction only the polarized light, such as the scattered light from the circumstellar material, remains. We obtained polarimetric images with NACO through the H filter, using a Wollaston prism with a 2′′ Wollaston mask to exclude overlapping beams of orthogonal polarization, using the 27 mas pixel-1 scale camera. EX Lup was observed at four different rotator angles of 0∘, 45∘, 90∘ and 135∘. At each angle, a three-point dithering was applied. The polarimetric calibrators were HD 94851 and HD 64299. The data reduction was done in IDL using previously developed software tools presented in details in Apai et al. (2004) and in Kóspál et al. (2008b). Calibration measurements of the unpolarized standards HD 94851 and HD 64299 indicate that the instrumental polarization is less than 3%.
3. Results and analyses


Line inventory.
The near-infrared spectrum of EX Lup displays many emission lines. No obvious absorption features are visible. We identified the emission features using wavelengths from the NIST Atomic Spectra Database222http://physics.nist.gov/PhysRefData/ASD/lines_form.html and from the Infrared Spectral Atlases of the Sun from NOAO (Wallace et al., 1996). There is no systematic difference between the observed and tabulated wavelengths; the difference for the individual lines being in average less than 2 pixels or 70 km s-1.
The most conspicuous features in the spectrum are the lines of atomic hydrogen: the Pa line in the J band (the strongest feature in the whole spectrum), the Br 10 to 20 lines in the H band, and the Br and lines in the K band. We could identify two He I lines: the well-known 2.0587m feature, and possibly also another line at 1.2849m (close to the Pa line). Several metallic lines are present: lines of neutral Na, Mg, Fe, Si, Ca, Al, C, and O are well visible. We could also identify two lines of singly ionized Ca, and possibly also the 1.6440m forbidden line of singly ionized Fe. Besides the atomic lines, molecular bands are also visible: the K band spectrum displays pronounced CO ro-vibrational overtone bandhead emission between 2.29 and 2.40m. The species of the identified lines are overplotted in Figs. 2, 3, and 4.
We analyzed the atomic lines in IRAF333IRAF is distributed by the National Optical Astronomy Observatories, which are operated by the Association of Universities for Research in Astronomy, Inc., under cooperative agreement with the National Science Foundation. by fitting Gaussian profiles. We found that the full widths at half maximum (FWHM) of the lines are consistently larger than the instrumental FWHM, the latter being 6 Å in the middle of the J and H bands, and 5 Å in the middle of the K band, as determined by measuring spectrally unresolved OH sky emission lines. Thus, we conclude that the lines are spectrally resolved, their measured FWHM are between 8 and 12 pixel, and their deconvolved FWHM are between 110 and 190 km s-1. Table 1 shows the tabulated and observed wavelengths, as well as the equivalent widths (EWs), of the lines identified in our EX Lup spectrum.
Spatial extent.
Since the SINFONI data cubes provide spatially resolved information, we checked whether any line emission originates from an extended area. We first averaged images corresponding to wavelengths in a wavelength window of 25 Å centered on a certain emission line (“line image”). Then we averaged images in a 50 Å wide window on both sides of the line, at a distance of 87.5 Å (“continuum image”). We created a continuum-subtracted line image by simply subtracting the continuum image from the line image. In order to do PSF-subtraction, we supposed that the continuum emission is a point source and considered the continuum image as a PSF template. Then, we subtracted the PSF template from the continuum-subtracted line image. The peak of the PSF template was scaled to the peak of the line image. If the line emission is more extended than the continuum, the residuals should show this extended emission. With this method, we analysed several hydrogen and metallic lines, as well as the CO bandhead, but found no extended emission. Thus, we can conclude that with our sensitivity, the line emission is not more extended than the continuum emission, and that there is no extra diffuse line emission apart from the central star. The FWHM of the stellar PSF should give a reasonable upper limit for the size of the emitting region. The FWHM was between 4.1 and 6.4 pixels, depending on the band and on the efficiency of the AO correction for a particular frame. 4 pixels correspond to 50 mas (or approximately 8 AU at the distance of 155 pc). Thus, the frames with the best AO correction give an upper limit of 8 AU for the diameter of the near-infrared emitting region, both for the continuum and for the H, CO, and metallic line emission. A somewhat less stringent upper limit can be derived from the FWHM of the broad-band H images obtained with NACO (92 mas or 14 AU).
Aspin et al. (2010) observed P Cygni profile for the H and the Na D lines in the optical spectrum of EX Lup obtained in January 2008. The blue-shifted absorption in these lines appear around 120 km s-1. Goto et al. (2011) detected similar blue-shifted absorption at 80 km s-1 in the profiles of the fundamental CO lines in August 2008. Outflowing material traveling at a velocity of 80-120 km s-1 would have reached an area of 16-24 AU in diameter during the 5 months that elapsed between the peak of the outburst and our SINFONI observations. The fact that we do not see emission beyond 8 AU can probably be explained by the faint surface brightness of the outflow. This also implies that the lines are dominated by emission from infalling or rotating material closer to the star than 8 AU.
Hydrogen lines.
Strengths and profiles of the hydrogen lines give information about the physical conditions in the emitting medium. In Fig. 5 we plotted the intensities of lines in the Brackett series relative to that of the Br line. Here we assumed that Amag (see e.g. Sipos et al., 2009; Aspin et al., 2010), and that the shape of the SED is flat, thus the absolute line intensities are proportional to the line EWs. Then we compared the observed intensity ratios to theoretical predictions corresponding to Case B recombination (Baker & Menzel, 1938; Hummer & Storey, 1987). Case B theory is valid if the emitting plasma is opaque to Ly photons but optically thin for higher transition lines. We found that our line fluxes are essentially consistent with the Case B theory. A model with temperature of 10 000 K and electron density of Ne=107 cm-3 best fitted the data points (Fig. 5), however, higher electron densities with higher temperatures (Ne=108 cm-3, T=12 500 K) or lower electron densities with lower temperatures (Ne=106 cm-3, T=5000 K) also fit within the measurement uncertainties. The observed Pa / Br ratio of 2.54, however, is far from the theoretical Case B value of 6.08. Actually, in Case B theory, any combination of temperature between 1000 and 12 500 K and electron density between 102 and 1010 cm-3 would give ratios between 4 and 9. This indicates that the Pa line is probably not optically thin.

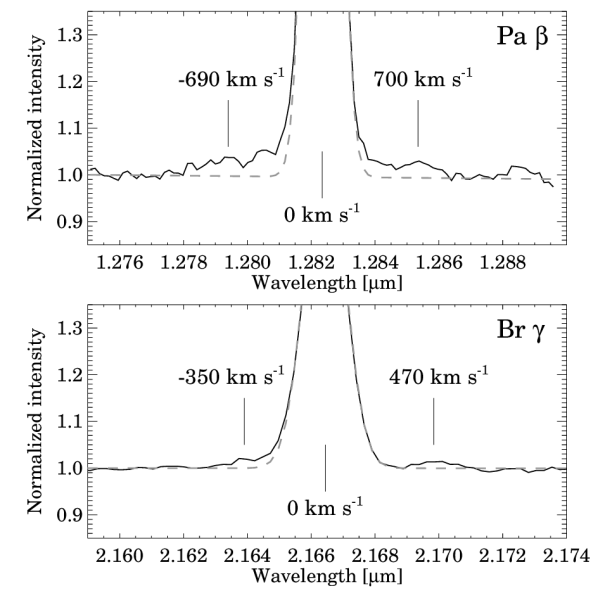
As we mentioned earlier, the hydrogen lines are spectrally resolved. Specifically, the deconvolved FWHM of the Pa line is 17020 km s-1, and of the Br line is 18620 km s-1. Apart from a nearly symmetric broadened Gaussian peak, high-velocity line wings, extending to several hundred km s-1, can also be seen (Fig. 6). Particularly interesting is the shape of the Br line wings, which is not symmetric: on the blue side, the profile agrees with a Gaussian, and starts showing excess from 230 km s-1; on the red side, the profile agrees with a Gaussian up to 340 km s-1, and shows a pronounced bump between 340 and 630 km s-1. This absence of excess emission in the red side may be due to a weak inverse P Cygni profile, the signature of mass infall.
Before the outburst, in 2001, EX Lup displayed no discernible Br emission (Sipos et al., 2009). The spectra obtained during outburst in April 2008 (Juhász et al., submitted) and in July 2008 (this work) both have similar EW (13 Å) and deconvolved FWHM (200 km s-1). Observations by Aspin et al. (2010) show that in February and in May 2008, the EW of the Br line was slightly larger, 17 Å.
CO bandhead.
In order to model the CO bandhead profiles, we used a simple slab model in which we assume that the CO emission comes from a slab of gas in local thermodynamical equilibrium (LTE) with vibrational temperature TCO and CO column density NCO. The vibrational and the rotational temperature were set to be equal. We used the equations of Kraus et al. (2000). We took the Einstein A coefficients from Chandra et al. (1996), who calculated coefficients up to J=140, and we took the total partition function from Goorvitch (1994). We first calculated the absorption coefficient per CO molecule, as given by Eqn. 10 in Kraus et al. (2000), using a Gaussian CO line profile with a width of 2 km s-1, as suggested for the turbulent broadening by Najita et al. (1996a). We only considered temperatures between 2000 K and 5000 K. For LTE, we need sufficiently high temperature and sufficiently high density so that the vibrational levels can be collisionally excited. This requires temperatures T2000 K and densities greater than n cm-3; but temperatures should also be less than 5000 K, otherwise CO molecules would dissociate (Scoville et al., 1980). Then, we convolved the absorption coefficient as a function of wavelength with the velocity profile of a disk in Keplerian rotation (see below). We then multiplied the absorption coefficient by the column density of CO in order to obtain the optical depth. From the optical depth, we calculated line intensities using the transfer equation (Eqn. 9 in Kraus et al. 2000).
Aspin et al. (2010) needed to introduce a velocity profile of a disk in Keplerian rotation in order to fit their observations of the CO bandhead emission. They found that the best fit could be obtained using a stellar mass of M∗=0.6 M⊙, inner disk radius of rin=0.08 AU, outer disk radius of rout=0.13 AU, temperature of TCO=2500 K and optical depth . We calculated the line profile emerging from such a disk, assuming a disk inclination of i=45∘ and a disk radial brightness profile proportional to r-2.5 (same as in Goto et al. 2011). The resulting line profile is plotted in the small inset in Fig. 7. We used this profile when calculating the optical depth (see above). Finally, we smoothed our model spectrum to the instrumental resolution of SINFONI. The result, plotted with a gray line in Fig. 7, fits our observations of the v=20, v=31, and v=42 transitions very well. We note that a model with an outer radius of rout=0.4 AU, as derived by Goto et al. (2011) from the profiles of the CO fundamental emission lines of EX Lup, would fit our observations equally well.

Metallic lines.
M-type stars display numerous Na, Ca, K, Fe, Ti, and Si absorption lines in their near-infrared spectra, which are often used for spectral type classification (Cushing et al., 2005). In quiescence, EX Lup also displayed atomic absorption lines (S I at 1.199m, Mg I at 1.577m, and Al I at 1.673m, see Sipos et al. 2009). These lines are most probably photospheric in origin (see also Herbig et al., 2001). During outburst, no absorption lines are visible any more, despite the fact that, at the time of our SINFONI observation, 77% of the J and H-band flux, and 60% of the K-band flux was photospheric. These values were obtained by supposing that the quiescent JHK photometry represent the stellar photosphere, and that during our observations, the VJ, VH, and VK colors were the same during our observations as in April 2008 (Juhász et al., submitted). In outburst, the above mentioned Mg I line is in emission, the lines that were in emission already in quiescence (the Pa line and an O I line at 1.129m) became much stronger, and many more atomic emission lines appeared.
Most of the metallic lines visible in the SINFONI spectrum originate from neutral atoms whose ionization potential is low (in the range of 5.18.2 eV, cf. 13.6 eV for hydrogen), the only exception is oxygen (with an ionization potential of 13.6 eV). This means that these atoms are located in an area where hydrogen is mostly neutral, probably shielded from most of high energy radiation from the accretion shock region by the circumstellar disk itself. However, the atoms cannot be located too deep in the disk, since many lines and line ratios indicate fluorescent emission pumped by UV photons. The Na I doublet at 2.206 and 2.209m may be pumped by 3303 Å continuum photons. If this is the case, then the Na I line at 1.141m should also be present with a strength roughly twice of those of the lines at 2.206 and 2.209m, while collisional excitation would cause a line ratio above 10 (McGregor et al., 1988). For EX Lup this ratio is 1.3, supporting the fluorescent origin. Another fluorescent line is that of O I at 1.129m, which may be pumped by Ly or continuum photons (McGregor et al., 1984, and references therein). Continuum fluorescence predicts an O I 1.316m / 1.129m line ratio above unity. The 1.316m line is practically invisible in our SINFONI spectrum, which favors the Ly fluorescence. If this is true, another O I line at 8446 Å should also be present. Indeed, this line is well visible in our FEROS spectra of EX Lup obtained between April and June 2008 (Sicilia-Aguilar et al., in prep.). Interestingly, both the 8446 Å and the 1.129 m lines are visible even in quiescence, although they are much weaker than in outburst, indicating that a sufficient amount of Ly radiation was present even in quiescence. The presence of Ly -pumped lines of neutral oxygen indicates the presence of dense warm regions embedded in hot ionized plasma. The Mg I 1.503m line may also be formed by UV fluorescence. This requires that the Mg I 1.574/1.575/1.577m transitions are also present. This is true for EX Lup. However, collisional excitation may also play a role here, since the Mg I 1.183m line is also visible.
Shock signatures.
We searched the spectrum of EX Lup for shock-excited lines. We found that the H2 line at 2.1218m is not visible. The [FeII] line at 1.6440m may be present, but its unambiguous identification is difficult due to its closeness to the strong Br 12 line. We checked the position-velocity diagram and the spectro-astrometric signal (see below) in order to identify the location of the 1.6440m emission. We found neither extended emission nor positional offset compared to the continuum position. Thus, supposing that the [FeII] line is indeed present, at the time of our observations the shock was still very close to the central source. This apparent lack of strong forbidden lines may be an indication that the emission line region has a high density where forbidden lines are quenched (Nisini et al., 2005). Further monitoring of EX Lup may reveal shocks as they reach less dense regions farther from the central star, expanding into the medium around the disk.
Spectro-astrometry.
The SINFONI data cubes can be used for spectro-astrometry, i.e. measuring the position of the source as a function of wavelength. If there is extended emitting material moving at different velocities, the source position measured at these velocities will deviate from the position measured at continuum wavelengths. In case the emission comes from a rotating disk, at certain wavelengths, there will be a positive offset in the centroid, while at other wavelengths, there will be a negative offset. Thus, depending on whether we see the approaching or the receding part of the disk, the measured spectro-astrometric signal as a function of velocity will follow a typical sinusoidal pattern (see e.g. Fig. 2 in Pontoppidan et al., 2008). Infall or outflow would, in most cases, cause a positive only or negative only signal (see the modeling by Eisner et al., 2010). For certain geometries, a bipolar outflow could cause both positive and negative offsets for different velocities, but the centroid displacement would be more linear (see e.g. the example of V536 Aql in Whelan et al., 2004). Binaries may also cause a non-zero spectro-astrometric signal, but again, a positive only or negative only signal (Takami et al., 2003; Brannigan et al., 2006).
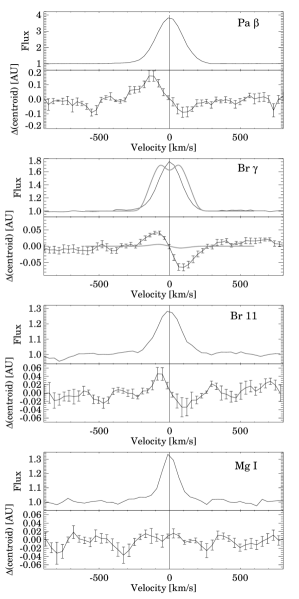
We analyzed several emission lines in the spectrum of EX Lup with spectro-astrometric technique. Fig. 8 shows some examples. We found that only the hydrogen lines indicate any spectro-astrometric signal. Metallic lines show a flat signal, which can be either due to gas close to the star, or slow-moving gas at larger distances. The fact that most of the metallic atoms are neutral supports the second possibility. The spectro-astrometric signals plotted in Fig. 8 for the Pa, Br, and Br 11 lines are all indicating rotating material. Since SINFONI contains no slit, our measurements do not suffer from the artifacts usual for slit spectra, and the spectro-astrometric signal can be calculated for any angle across the source. The results can be then used to calculate the position angle of the rotation axis, i.e. the angle where the spectro-astrometric signal is constant 0. In our case, this yields P.A. = 8010∘, thus, the rotation axis is almost exactly east-west oriented. Remarkably, the spectro-astrometric signals for the hydrogen lines are all symmetric within the measurement uncertainties, indicating that the brightness and velocity distribution of hydrogen gas around the central star is azimuthally symmetric.
Polarimetry.
Broad-band polarimetric images through the H filter were obtained for EX Lup using a shorter (0.35 s) and a longer (2 s) exposure time. The short exposure images show that the distribution of the total intensity follows a Gaussian profile. The profile of the long exposure images indicates that the inner region (within a radius of 3 pixels) of the source is saturated, but the rest of the profile is the same as for the short exposure images, suggesting no extended emission. The Stokes Q and U images, as well as the polarized intensity images show no polarized light whatsoever. This limits the H-band degree of polarization for EX Lup below the instrumental polarization (not more than 1-2%). This result is not surprising if we consider that only a small fraction of the observed H-band flux is expected to be scattered light (thus polarized); most of it is photospheric emission from the central star, or thermal emission from the disk.
4. Discussion
4.1. The origin of the CO emission
Our model indicates that the CO bandhead emission is consistent with emission from CO gas which has a temperature of 2500 K and which is located in the disk between 0.08 and 0.13 AU from the central star. Juhász et al. (submitted) found that in outburst there is a dust-free inner hole in the system within 0.3 AU. Thus, the CO gas we observe here should mostly be located in this dust-free region.
Goto et al. (2011) also derived the properties and distribution of the CO gas using the fundamental vibrational lines in the 4.6–5 m wavelength range. They found that the fundamental lines are the superposition of a narrow (FWHM=50 km s-1) and a broad (FWZI=150 km s-1) component. The broad component comes from gas orbiting the central star at 0.04–0.4 AU, and has a vibrational temperature between 1800 and 3000 K. These parameters are very similar to those we obtained from the overtone bandhead features. Thus the gas emitting the overtone and the fundamental lines are co-located and are very likely physically the same material.
The CO bandhead feature in EX Lup displays significant temporal variability: it was in absorption in quiescence (Sipos et al., 2009; Herbig et al., 2001), very strong emission in February 2008, weak emission in May 2008 (Aspin et al., 2010), and also weak emission in July 2008 (this work). Lorenzetti et al. (2009) observed the variability of the CO bandhead feature in several other EXors. They claim that CO absorption is associated with quiescent periods, when the accretion rate is low and the stellar photosphere (of an M-type dwarf) is visible. According to them, CO emission is associated with more active periods, when the accretion rate is higher, UV radiation is higher as well, thus the CO gas in the inner disk is heated and is producing CO bandhead emission. The general behavior of the CO bandhead feature in EX Lup is consistent with this picture.
There are several scenarios described in the literature to explain the origin of CO bandhead emission in YSOs. Based on observations of low-mass YSOs indicating significant CO bandhead emission variability on timescales as short as a few days, Biscaya et al. (1997) considered the disk, stellar/disk wind, and funnel flows as the origin of CO emission. Although our observations are consistent with the inner disk origin (Fig. 7), we cannot exclude the funnel flow origin either: the figure in Martin (1997) suggests that funnel flows can produce CO bandhead profiles very similar to those we observed. Goto et al. (2011) argued against the funnel flow origin based on the lack of systematic redward absorption in the fundamental CO lines. However, one can imagine a situation when – due to the inclination of the system – the funnel flows do not cross the line-of-sight toward the hot spot on the stellar surface, thus, absorption is not expected to be seen. We note that CO can survive without dissociation only in the outer parts of the funnel flows, close to the inner edge of the disk, thus, there is no essential physical difference between a funnel flow and an inner disk origin.
In order to test whether the heating of the CO gas is related to accretion, at different epochs we correlated the strength of the CO bandhead feature with the visual brightness of the star (which is supposed to be accretion luminosity) and with the Br line flux (another usual accretion rate tracer). Using the spline-smoothed version of the light curve presented in Juhász et al. (submitted), we estimated a visual brightness of 9.5 mag in February, 10.2 mag in May, and 10.2 mag in July 2008. Assuming that the VK color of the source was similar at these epochs to the value measured in April 2008 (2.05 mag, Juhász et al. submitted), the Br line fluxes decreased by a factor of 1.9 between February and May, and a factor of 2.3 between February and July. We calculated the EWs of the CO bandhead by integrating the spectra between 2.2925 and 2.2975m, and obtained 21 Å for February, 4 Å for May, and 3.3 Å for July 2008. Assuming again a constant VK color, the flux of the CO bandhead decreased by a factor of 10 between February and May, and a factor of 12 between February and July. Thus, the strength of the CO bandhead feature, the optical brightness of the star, and the strength of the Br feature seems to be changing in the same direction, although not exactly with the same rate. Consequently, our results indicate that both heating by irradiation and heating by accretion may have a role in the excitation of the CO bandhead. We note that the broad component observed by Goto et al. (2011) in the fundamental emission lines was also fading with time, but due to different observing epochs, we cannot directly compare the results for time evolution of the fundamental and the overtone lines.
4.2. The origin of metallic lines
The lack of spectro-astrometric signal for the metallic lines and the fact that most of the metallic lines are from neutral atoms indicate that these lines are originating from regions farther from the central star than the hydrogen lines. Some of the lines are fluorescently excited by UV photons, indicating that at least part of the atoms are subject to direct stellar radiation, which condition is probably fulfilled at least on the surface of the inner gas disk. Thus, the metallic atoms may be partially co-located with the CO gas. Interestingly, the 2.206 and 2.209m Na doublet shows a similar time evolution to that of the CO bandhead. Lorenzetti et al. (2009) noticed that it follows the same behavior as the CO bandhead in several other EXors: either both are in emission or both are in absorption. They interpreted this result as a common origin: both the Na and the CO feature is originated in the stellar photosphere when in absorption, an in the inner disk when in emission. Our results for EX Lup is consistent with this scenario: both features were in absorption in quiescence (Sipos et al., 2009), and were in emission in outburst (Aspin et al., 2010, and this work).
4.3. The origin of the hydrogen emission
Hydrogen emission in YSOs is generally believed to be originating in disks, funnel flows or stellar/disk winds (e.g. Najita et al., 1996b; Kraus et al., 2010). In the following, we check whether any of these scenarios are consistent with our results on EX Lup. The excitation diagram in Fig. 5 indicates that the hydrogen is hotter than the CO gas, suggesting the hydrogen gas is closer to the star than 0.04-0.08 AU. Following Pontoppidan et al. (2008) and Eisner et al. (2010), we modeled the Br line using this scenario and adopting a simple disk model. We supposed that all continuum arises from (and only from) the central star, and all the Br emission originates from (and only from) the disk. We assumed that the velocity field in the disk is Keplerian around a 0.6 M⊙-mass central star, while the brightness profile is a power law. With these assumptions, we calculated the line-of-sight component of the velocity, and made images corresponding to each SINFONI velocity channel. We added a central point source with a wavelength-independent brightness, and blurred the image by convolving it with a Gaussian PSF. We measured the spectro-astrometric signal on these synthetic images the same way as we did for the real observations. We used a disk extending from the stellar surface (0.007 AU) to 0.04 AU, inclination of 45∘, and a radial brightness profile proportional to r-2.5. The resulting line profile and spectro-astrometric signal are overplotted with gray lines in Fig. 8. The results indicate that emission from such a Keplerian disk cannot significantly contribute to the observed Br line, because the emerging line profile would be double-peaked and the model spectro-astrometric signal indicates that high-velocity gas is closer to the star than observed.
We calculated different disk models by changing the disk inclination, disk inner and outer radii, and power law exponent of the disk brightness profile. We could not find a model that fits the observed spectro-astrometric signal. This analysis seems to exclude the equatorial boundary layer as the main path of accretion onto the star, a model often invoked for FU Orionis-type outbursts (Hartmann & Kenyon, 1996), especially since the innermost parts of a boundary layer is sub-Keplerian. Although the boundary layer, or strong turbulence could explain the single-peaked line profile, they cannot reproduce the high-velocity high-amplitude spectro-astrometric signal.
Our results suggest that hydrogen gas is orbiting the central star but its velocity profile is not Keplerian, in a sense that there is high-velocity gas farther from the star. This points to a funnel flow or disk wind origin, where the material is launched from the inner disk along the magnetic field lines with high velocities. This may also help to explain why the hydrogen gas is hotter than the CO. The wind scenario is supported by the P Cygni profiles observed in several optical lines by Aspin et al. (2010). Supposing that the disk wind scenario is true for EX Lup, it should be optically thin, otherwise the excitation diagram in Fig. 5 would show flatter line ratios (Lorenzetti et al., 2009).
5. Conclusions
In this paper we performed a near-infrared spectroscopic and spectro-astrometric study of EX Lup during its most extreme outburst in 2008. Our main conclusions are the following:
-
•
The CO bandhead emission comes from an inner, dust-free region. This area is identical with the broad component area identified by Goto et al. (2011), from where the CO fundamental emission comes from. The CO gas is rotating around the central star, either at the inner edge of the disk or in the outer parts of funnel flows.
-
•
EX Lup also displays numerous neutral atomic lines, which probably come from an area similar to that of the CO gas. At least part of this area is subject to direct UV photons, as evidenced by the presence of fluorescent emission lines.
-
•
A very conspicuous feature in the spectrum of EX Lup is the Brackett series, whose excitation diagram indicates that the hydrogen emission is optically thin. Spectro-astrometric analysis of these lines suggests that the hydrogen emission is probably not coming from an equatorial boundary layer; a funnel flow or disk wind origin is more likely.
Based on our findings, we can attempt to reconstruct the geometrical and kinematic structure of the circumstellar material within the inner few tenths of AU in the EX Lup system during the outburst. The dust disk has an inner radius of 0.2-0.3 AU (Sipos et al., 2009; Juhász et al., submitted). Within this area, there is an optically thin gas disk, whose temperature is a few thousand K, as indicated by the CO and neutral metal emission lines. This area certainly also contains hydrogen gas, but this component is not visible in the spectro-astrometric signal due to its low velocity. We see evidence for high temperature (10 000 K), high velocity (100 km s-1) hydrogen gas in the system, which is not located in the equatorial plane. Part of this hydrogen probably falls onto the stellar surface along magnetic funnel flows. Indeed, based on X-ray and UV data, Grosso et al. (2010) reported on the presence of accretion shocks and accretion hot spots on the stellar surface of EX Lup. Some of the UV photons thus generated must reach the disk surface and produce the fluorescent emission we observe in certain sodium, magnesium and oxygen lines. The UV radiation may also trigger chemical changes in the disk. Part of the hydrogen gas does not fall onto the stellar surface but leaves the system in the form of a hot wind, as evidenced by the P Cygni profile of the optical hydrogen lines. Considering all these arguments, the emerging picture is broadly consistent with that of the standard magnetospheric accretion model usually assumed for normally accreting T Tauri stars (e.g. Bouvier et al. 2007).
Several models are described in the literature to explain the increased accretion in young eruptive stars. Our results may place constraints on the applicability of these models for the case of EX Lup. Our results do not indicate the presence of a fully ionized ring of material during the eruption of EX Lup, which seems to contradict the thermal instability model of Hartmann & Kenyon (1996) and Bell & Lin (1994). No stellar or planetary companions to EX Lup have been found so far (Sipos et al., 2009, and references therein), neither do our spectro-astrometric analysis suggests the presence of one. This makes outburst models involving perturbation by a close companion unlikely (Bonnell & Bastien, 1992). The model of Vorobyov & Basu (2010) involves gravitational instability and fragmentation in the outer disk, and the infall of these fragments onto the star. The modest disk mass, and the fact that our spectro-astrometric observations indicate an azimuthally symmetric mass distribution in the inner disk reasons against this model.
Recently, D’Angelo & Spruit (2010) proposed that accretion onto a strongly magnetic protostar is inherently episodic if the disk is truncated close to the corotation radius. In their model, the magnetic field initially truncates the disk outside the corotation radius, thus accretion onto the star is inhibited. As gas in the inner regions of the disk piles up, material is pushed inside the corotation radius, and the accumulated material is accreted onto the star until the reservoir is depleted, and the inner radius of the disk is again outside the corotation radius. Sipos et al. (2009) reported a of 4.42 km s-1 for EX Lup, which translates into a rotation period of about 13 days (using an inclination of 45∘ and stellar radius of 1.6 R⊙), and a corotation radius of about 0.3 AU (using a stellar mass of 0.6 M⊙). This value is close to the radius of the dust-free zone. Our results show that during outburst, gas is present in this area, potentially channeled along magnetic funnel flows. Thus, the model of D’Angelo & Spruit (2010) may be applicable for EX Lup.
References
- Ábrahám et al. (2009) Ábrahám, P., et al. 2009, Nature, 459, 224
- Apai et al. (2004) Apai, D., Pascucci, I., Brandner, W., Henning, T., Lenzen, R., Potter, D. E., Lagrange, A., & Rousset, G. 2004, A&A, 415, 671
- Aspin et al. (2010) Aspin, C., Reipurth, B., Herczeg, G. J., & Capak, P. 2010, ApJ, 719, L50
- Baker & Menzel (1938) Baker, J. G., & Menzel, D. H. 1938, ApJ, 88, 52
- Bell & Lin (1994) Bell, K. R., & Lin, D. N. C. 1994, ApJ, 427, 987
- Biscaya et al. (1997) Biscaya, A. M., Rieke, G. H., Narayanan, G., Luhman, K. L., & Young, E. T. 1997, ApJ, 491, 359
- Bonnell & Bastien (1992) Bonnell, I., & Bastien, P. 1992, ApJ, 401, L31
- Bonnet et al. (2004) Bonnet, H., et al. 2004, The Messenger, 117, 17
- Bouvier et al. (2007) Bouvier, J., Alencar, S. H. P., Harries, T. J., Johns-Krull, C. M., & Romanova, M. M. 2007, Protostars and Planets V, 479
- Brannigan et al. (2006) Brannigan, E., Takami, M., Chrysostomou, A., & Bailey, J. 2006, MNRAS, 367, 315
- Chandra et al. (1996) Chandra, S., Maheshwari, V. U., & Sharma, A. K. 1996, A&AS, 117, 557
- Cushing et al. (2005) Cushing, M. C., Rayner, J. T., & Vacca, W. D. 2005, ApJ, 623, 1115
- D’Angelo & Spruit (2010) D’Angelo, C. R., & Spruit, H. C. 2010, MNRAS, 406, 1208
- Eisenhauer et al. (2003) Eisenhauer, F., et al. 2003, in Society of Photo-Optical Instrumentation Engineers (SPIE) Conference Series, Vol. 4841, Society of Photo-Optical Instrumentation Engineers (SPIE) Conference Series, ed. M. Iye & A. F. M. Moorwood, 1548–1561
- Eisner et al. (2010) Eisner, J. A., et al. 2010, ApJ, 718, 774
- Evans et al. (2009) Evans, N. J., et al. 2009, ApJS, 181, 321
- Goorvitch (1994) Goorvitch, D. 1994, ApJS, 95, 535
- Goto et al. (2011) Goto, M., et al. 2011, ApJ, 728, 5
- Grosso et al. (2010) Grosso, N., Hamaguchi, K., Kastner, J. H., Richmond, M. W., & Weintraub, D. A. 2010, A&A, 522, A56+
- Hartmann & Kenyon (1996) Hartmann, L., & Kenyon, S. J. 1996, ARA&A, 34, 207
- Herbig (1977) Herbig, G. H. 1977, ApJ, 217, 693
- Herbig (2007) —. 2007, AJ, 133, 2679
- Herbig et al. (2001) Herbig, G. H., Aspin, C., Gilmore, A. C., Imhoff, C. L., & Jones, A. F. 2001, PASP, 113, 1547
- Hummer & Storey (1987) Hummer, D. G., & Storey, P. J. 1987, MNRAS, 224, 801
- Jones (2008) Jones, A. F. A. L. 2008, Central Bureau Electronic Telegrams, 1217, 1
- Juhász et al. (submitted) Juhász, A., et al. submitted, ApJ
- Kenyon et al. (1994) Kenyon, S. J., Gomez, M., Marzke, R. O., & Hartmann, L. 1994, AJ, 108, 251
- Kóspál et al. (2008a) Kóspál, Á., Németh, P., Ábrahám, P., Kun, M., Henden, A., & Jones, A. F. 2008a, Information Bulletin on Variable Stars, 5819, 1
- Kóspál et al. (2008b) Kóspál, Á., et al. 2008b, MNRAS, 383, 1015
- Kraus et al. (2000) Kraus, M., Krügel, E., Thum, C., & Geballe, T. R. 2000, A&A, 362, 158
- Kraus et al. (2010) Kraus, S., Hofmann, K., Preibisch, T., & Weigelt, G. 2010, in Revista Mexicana de Astronomia y Astrofisica Conference Series, Vol. 38, Revista Mexicana de Astronomia y Astrofisica Conference Series, 63–66
- Kuhn et al. (2001) Kuhn, J. R., Potter, D., & Parise, B. 2001, ApJ, 553, L189
- Lenzen et al. (1998) Lenzen, R., Hofmann, R., Bizenberger, P., & Tusche, A. 1998, in Society of Photo-Optical Instrumentation Engineers (SPIE) Conference Series, Vol. 3354, Society of Photo-Optical Instrumentation Engineers (SPIE) Conference Series, ed. A. M. Fowler, 606–614
- Lombardi et al. (2008) Lombardi, M., Lada, C. J., & Alves, J. 2008, A&A, 480, 785
- Lorenzetti et al. (2009) Lorenzetti, D., Larionov, V. M., Giannini, T., Arkharov, A. A., Antoniucci, S., Nisini, B., & Di Paola, A. 2009, ApJ, 693, 1056
- Martin (1997) Martin, S. C. 1997, ApJ, 478, L33
- McGregor et al. (1988) McGregor, P. J., Hyland, A. R., & Hillier, D. J. 1988, ApJ, 324, 1071
- McGregor et al. (1984) McGregor, P. J., Persson, S. E., & Cohen, J. G. 1984, ApJ, 286, 609
- Najita et al. (1996a) Najita, J., Carr, J. S., Glassgold, A. E., Shu, F. H., & Tokunaga, A. T. 1996a, ApJ, 462, 919
- Najita et al. (1996b) Najita, J., Carr, J. S., & Tokunaga, A. T. 1996b, ApJ, 456, 292
- Nisini et al. (2005) Nisini, B., Antoniucci, S., Giannini, T., & Lorenzetti, D. 2005, A&A, 429, 543
- Pontoppidan et al. (2008) Pontoppidan, K. M., Blake, G. A., van Dishoeck, E. F., Smette, A., Ireland, M. J., & Brown, J. 2008, ApJ, 684, 1323
- Popham et al. (1996) Popham, R., Kenyon, S., Hartmann, L., & Narayan, R. 1996, ApJ, 473, 422
- Rousset et al. (2003) Rousset, G., et al. 2003, in Society of Photo-Optical Instrumentation Engineers (SPIE) Conference Series, Vol. 4839, Society of Photo-Optical Instrumentation Engineers (SPIE) Conference Series, ed. P. L. Wizinowich & D. Bonaccini, 140–149
- Scoville et al. (1980) Scoville, N. Z., Krotkov, R., & Wang, D. 1980, ApJ, 240, 929
- Sicilia-Aguilar et al. (in prep.) Sicilia-Aguilar, A., et al. in prep., ApJ
- Sipos et al. (2009) Sipos, N., Ábrahám, P., Acosta-Pulido, J., Juhász, A., Kóspál, Á., Kun, M., Moór, A., & Setiawan, J. 2009, A&A, 507, 881
- Takami et al. (2003) Takami, M., Bailey, J., & Chrysostomou, A. 2003, A&A, 397, 675
- Vorobyov & Basu (2010) Vorobyov, E. I., & Basu, S. 2010, ApJ, 719, 1896
- Wallace et al. (1996) Wallace, L., Livingston, W., Hinkle, K., & Bernath, P. 1996, ApJS, 106, 165
- Whelan et al. (2004) Whelan, E. T., Ray, T. P., & Davis, C. J. 2004, A&A, 417, 247
| Species | [m] | [m] | EW [Å] | Comment |
|---|---|---|---|---|
| Fe I | 1.1123 | 1.1131 | 0.73 | |
| Na I | 1.1200 | 1.1200 | 0.44 | |
| Al I | 1.1258 | 1.1261 | 0.52 | |
| O I | 1.1290 | 1.1293 | 7.97 | |
| Na I | 1.1385 | 1.1386 | 1.19 | |
| Na I | 1.1407 | 1.1409 | 1.60 | |
| Fe I | 1.1425 | 1.1428 | 0.45 | |
| Fe I | 1.1442 | 1.1445 | 0.61 | |
| Fe I | 1.1597 | 1.1599 | 0.93 | |
| Fe I | 1.1610 | 1.1613 | 1.69 | |
| Fe I | 1.1641 | 1.1644 | 1.23 | |
| C I | 1.1662 | 1.1665 | 0.38 | |
| Fe I | 1.1693 | 1.1696 | 1.30 | |
| C I | 1.1757 | 1.1758 | 1.57 | |
| Fe I | 1.1786 | 1.1789 | 1.16 | |
| Mg I | 1.1831 | 1.1834 | 2.02 | |
| Ca II | 1.1842 | 1.1845 | 2.17 | |
| Fe I | 1.1886 | 1.1889 | 3.30 | |
| C I | 1.1899 | 1.1901 | 0.30 | |
| Ca II | 1.1953 | 1.1955 | 1.58 | |
| Fe I | 1.1976 | 1.1979 | 2.65 | |
| Si I | 1.1987 | 1.1990 | 1.43 | |
| Si I | 1.1995 | 1.1997 | 1.11 | |
| Si I | 1.2035 | 1.2037 | 2.12 | |
| Mg I | 1.2087 | 1.2089 | 0.71 | |
| Si I | 1.2107 | 1.2109 | 0.94 | |
| Si I | 1.2274 | 1.2276 | 0.82 | |
| H I | 1.2821 | 1.2824 | 29.34 | Pa |
| He I | 1.2849 | 1.2854 | 0.20 | |
| Al I | 1.3127 | 1.3129 | 0.51 | |
| Al I | 1.3154 | 1.3157 | 0.35 | |
| Fe I | 1.3292 | 1.3293 | 0.41 | |
| Fe I | 1.4547 | 1.4550 | 1.82 | |
| Mg I | 1.4882 | 1.4884 | 2.75 | |
| Mg I | 1.5029 | 1.5032 | 4.49 | |
| Mg I | 1.5044 | 1.5047 | 3.39 | |
| Mg I | 1.5052 | 1.5055 | 1.76 | |
| H I | 1.5195 | 1.5200 | 0.35 | Br 20 |
| H I | 1.5265 | 1.5267 | 0.36 | Br 19 |
| Fe I | 1.5299 | 1.5300 | 0.24 | |
| H I | 1.5346 | 1.5347 | 0.82 | Br 18 |
| H I | 1.5443 | 1.5447 | 0.63 | Br 17 |
| H I | 1.5561 | 1.5562 | 1.11 | Br 16 |
| Fe I, H I | 1.5697,1.5705 | 1.5708 | 1.47 | Fe I + Br 15 blend |
| Mg I | 1.5745 | 1.5747 | 0.38 | |
| Mg I | 1.5753 | 1.5757 | 0.99 | |
| Mg I | 1.5770 | 1.5774 | 1.51 | |
| H I, Mg I, Si I | 1.5885, 1.5891, 1.5893 | 1.5892 | 3.24 | Br 14 + Mg I + Si I blend |
| Si I | 1.5964 | 1.5967 | 0.47 | |
| Si I | 1.6099 | 1.6102 | 0.53 | |
| H I | 1.6114 | 1.6117 | 2.17 | Br 13 |
| Si I, Fe I | 1.6386, 1.6387 | 1.6390 | 0.78 | blend |
| H I | 1.6412 | 1.6415 | 2.72 | |
| Fe II | 1.6440 | 1.6436 | 0.74 | |
| H I | 1.6811 | 1.6815 | 3.56 | Br 11 |
| C I | 1.6895 | 1.6900 | 0.39 | |
| Mg I | 1.7113 | 1.7117 | 0.72 | |
| H I | 1.7367 | 1.7369 | 4.36 | Br 10 |
| H I | 1.9451 | 1.9455 | 8.87 | Br |
| Ca I | 1.9511 | 1.9515 | 1.20 | |
| Ca I | 1.9782 | 1.9786 | 2.43 | |
| Ca I | 1.9868 | 1.9871 | 0.98 | |
| He I | 2.0587 | 2.0589 | 0.90 | |
| H I | 2.1661 | 2.1665 | 11.54 | Br |
| Na I | 2.2062 | 2.2066 | 1.13 | |
| Na I | 2.2090 | 2.2093 | 1.32 |