Evolution of Primordial Stars Powered by Dark Matter
Annihilation up to the Main-Sequence Stage
Abstract
Primordial stars formed in the early universe are thought to be hosted by compact dark matter (DM) halos. If DM consists of Weakly Interacting Massive Particles (WIMPs), such stars may be powered by DM annihilation during the early phases of their evolutions. We study the pre-main sequence evolutions of the primordial star using a detailed stellar evolution code under the assumption that the annihilation of adiabatically contracted WIMPs DM within the star provides a sufficient energy to sustain the stellar equilibrium. We follow the evolution of accreting stars using several gas mass accretion rates derived from cosmological simulations. We show that the stellar mass becomes very large, up to when the star reaches the main-sequence phase for a reasonable set of model parameters such as DM particle mass and the annihilation cross section. During the dark star phase, the star expands over a thousand solar-radii, while the surface temperature remains below . The energy generated by nuclear reactions is not dominant during this phase. We also study models with different gas mass accretion rates and the DM particle masses. All our models for different DM particle masses pass the dark star phase. The final mass of the dark stars is essentially unchanged for DM mass of . Gravitational collapse of the massive dark stars will leave massive black holes with mass as large as in the early universe.
1 Introduction
The first stars in the universe may have contributed early cosmic reionization and may have also enriched the inter-galactic medium with heavy elements such as carbon, oxygen and iron (see, e.g. Bromm et al. (2009) for a review). Future observations of the distant universe will exploit large ground-based and space-borne telescopes such as James Webb Space Telescope and Thirty Meter Telescope to answer the important questions of how and when the first stars were formed and how they affected the subsequent evolution of the universe.
Recent theoretical studies based on cosmological simulations suggest that the first stars are formed in dark matter (DM) halos with mass at (Tegmark et al., 1997; Yoshida et al., 2003). In such a cosmological “minihalo”, the gas cools and condenses by molecular hydrogen cooling to form a star-forming gas cloud. The gravitationally unstable cloud further contracts, and finally a proto-star is born inside it (Omukai & Nishi, 1998; Yoshida et al., 2008). A unique characteristic of primordial star formation in the standard cold dark matter model is that the star and its parent gas cloud are embedded at the center of the host dark halo. Thus the formation and evolution of primordial stars may be much affected by DM dynamically.
The nature of DM remains still unknown, but the best candidates are thought to be Weakly Interacting Massive Particles, WIMPs. WIMP DM such as neutralinos must have a large self-annihilation cross-section in order to be a dominant component of DM in the present-day universe. DM annihilation produces an enormous amount of energy, essentially equal to the rest mass energy of the annihilated DM particles. If DM density can be very large in a primordial gas cloud and in a primordial star, the annihilation energy would act as an efficient heat input. DM annihilation could even supply sufficient energy to support self-gravitation of a star. This is indeed a recently proposed new stellar phase, in which stars are powered by DM annihilation energy instead of that of the nuclear fusion (Spolyar et al., 2008). Hereafter we call such a star “dark star”.
Spolyar et al. (2008) suggest that, in a collapsing primordial gas cloud, DM annihilation heating can win over the radiative cooling, effectively halts further collapse of the cloud. Natarajan et al. (2009) study the evolution of the DM density profile during the first star formation using cosmological simulations. They show that the DM density profile indeed becomes very steep, as much as expected by adiabatic contraction models.
There have been many previous studies on dark stars. While most of them assume constant stellar mass models (Iocco et al., 2008; Taoso et al., 2008; Yoon et al., 2008). Spolyar et al. (2009) and Umeda et al. (2009) study dark star evolution with gas mass accretion. By using an approximated stellar structure model, Spolyar et al. (2009) follow dark star evolutions with adiabatically contracted DM (ACDM). They show that the final stellar mass becomes as large as . Umeda et al. (2009) perform detailed, dynamically self-consistent stellar evolution calculations up to gravitational core-collapse. They show that the final mass can be as large as or more, if the star captures DM efficiently. However, the DM capture rate itself is uncertain because it depends on the unknown DM-baryon scattering cross section and also on the ambient DM density during the dark star evolution. Thus the proposed formation of inter-mediate massive black holes appears to occur only in very particular cases.
An attractive feature of the dark star models is that the possibility for the birth of massive stars, and black holes (BHs) as the end of such stars, in the early universe. Super-massive BHs (SMBHs) existed already at , when the age of the universe is less than one billion years old, but the formation mechanism of such early SMBHs remains unknown. Gravitational collapse of a very massive dark star might provide a solution to this problem. We explore a possibility that the first stars formed in DM halos can become very massive by being powered by DM annihilation. To this end, it is important to determine the final state of the dark star phase exactly, and to determine the final stellar mass.
In this paper, we study the evolution of an accreting dark star using a detailed stellar evolution code as in Umeda et al. (2009) but with the ACDM annihilation. We calculate the density profile of ACDM using an analytical method and determine the DM annihilation rate. We then follow the evolution of the dark star which grows in mass by gas accretion. The dark star model has two parameters effectively; the gas mass accretion rate and DM particle mass. We calculate several models with different set of parameters and investigate the effects on the final stellar mass. Especially, we clarify the effect of the different mass accretion rates, which were not explicitly shown in a similar work by Spolyar et al. (2009).
The rest of the paper is organized as follows. In section 2, we introduce our numerical calculation and explain how we implement DM annihilation in the stellar evolution. Sec. 3 shows the results of our dark star models and we discuss the implications in Sec. 4. We give our concluding remarks in Sec. 5.
2 Method
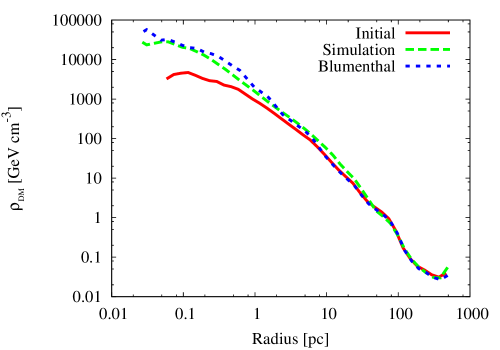
We use a stellar evolution code with gas mass accretion developed by Ohkubo et al. (2006, 2009); Umeda et al. (2009). We implement energy generation by DM annihilation rate in the code in the following manner. We consider a primordial (proto-)star embedded at the center of a small mass DM halos. The DM density profile, , is calculated using the analytical method of Blumenthal et al. (1986); when the primordial gas cools and collapses, DM particles are also “dragged” into the gravitational potential well. The adiabatic contraction model uses an adiabatic invariant. For spherically distributed DM and baryons with a total mass of , an adiabatic invariant is
| (1) |
Freese et al. (2009) compared the difference of DM density profile calculated using this method and a more accurate method developed by Young (1980). They conclude that the difference is not more than a factor of two.
We have performed direct numerical simulations of early structure formation to check the accuracy of this analytical method. To this end we have used the parallel -body/Smoothed Particle Hydrodynamics (SPH) solver GADGET-2 (Springel, 2005) in its version suitably adopted to follow radiative cooling processes at very high densities (Yoshida et al., 2006). We have found that the DM density calculated by Blumenthal’s method is indeed in good agreement with the result of our direct numerical simulations. Figure 1 compares the results from the analytic model and the simulations. Details will be presented elsewhere (Hirano et al., in preparation). We note that, although these two results agree very well, confirming the validity of the analytic model, the simulations do not resolve the DM density down to length scales of astronomical units. Because the gas density profile itself evolves in a self-similar manner (Omukai & Nishi, 1998), we assume that the DM continue to contract adiabatically and the evolution of DM density can be calculated by Blumenthal’s method.
In this work, we only consider the DM density evolution based on adiabatic contraction. In principle, DM annihilation can occur even more efficiently in the star by capture. If the density of the stellar core increases enough to scatter and trap DM particles, the DM particles can rapidly sink toward the center, to self-annihilate efficiently. During the dark star phase, however, the effect of DM capture is unimportant because the star has expanded extremely and the gas density is low.
Suppose a “cloud” of DM particles contract from a radial position to , and the total mass distribution changes from to . Then the following relation holds during adiabatic contraction:
| (2) |
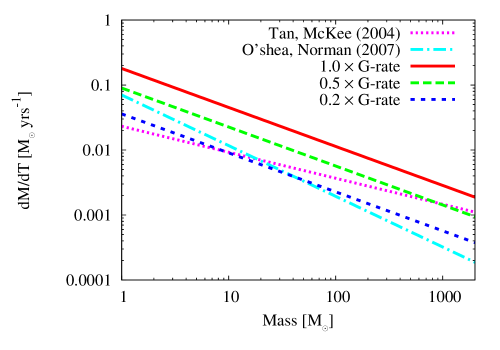
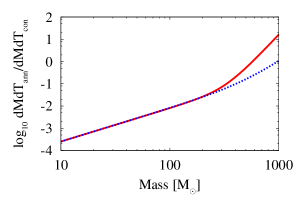
The “new” DM density profile can be simply calculated from the above equation. Note that, in our case, the gas distribution also changes because of the gas accretion onto the central primordial protostar. We model the gas mass accretion rate in a simple parameterized form as a function of the stellar mass. We use the accretion rate calculated by cosmological simulations of Gao et al. (2007). They found a large variation of accretion rates. In particular, the accretion rates for rotationally supported disks are typically smaller than for the other cases. As our fiducial model, we choose the accretion rate of their R5 run, which is well described as a power-law
| (3) |
Hereafter we call this rate “G-rate” (see Figure 2). The rate is for a cosmological halo forming from a very high- peak, and is slightly larger than that adopted in a previous work (Spolyar et al., 2009). We also run models with three different accretion rates G-rate. The intermediate value, G-rate, is close to that used in Spolyar et al. (2009). We use this model to compare with their result.
The energy generation rate of DM annihilation is given by
| (4) |
where is the DM self-annihilation rate in units of , and is the DM particle mass in units of GeV = electron volt (e.g. Bertone et al. (2005)). Notice that effectively only the ratio, , determines the net energy generation rate. We vary the DM particle mass as a model parameter as and , while fixing constant. Spolyar et al. (2008) calculate the critical transition gas density above which most of the DM annihilation energy is absorbed inside the core. The critical density is smaller than the stellar density with the WIMP mass 1 GeV to 10 TeV, and thus we assume that the released energy from DM annihilation quickly thermalize the star. Through the self-annihilation process, DM changes into multiple species including neutrinos, which escape away from the star and the cloud. We assume that about one third of DM annihilation energy is carried away from the star, and thus the effective energy generation rate is (see, e.g. Spolyar et al. (2008)).
All our calculations start from a protostar with . As the initial condition, we calculate an equilibrium stellar structure for this mass, including DM annihilation energy. In order to apply the Blumenthal’s method for the adiabatic contraction calculation, we need the gas density profile outside the star. We use the result in the cosmological simulation of Gao et al. (2007) which shows the gas density scales with distance as . Within an integration time step, the accreted gas is added to the stellar mass and DM annihilation energy is re-calculated. Because the DM density increases extremely within the central star due to adiabatic contraction, the DM annihilation rate at the outside of the star is relatively small than inside. Thus we consider the effect of DM annihilation inside the star only. We stop the calculation when the star contracts to be sufficiently compact and the stellar surface temperature reaches . The dark star phase ends well before entering this regime. Afterwards the star is expected to settle quickly on the main-sequence phase, mainly powered by nuclear reactions. In this study, we do not include nuclear reactions for our dark star models, because the nuclear reactions are ineffective owing to the low temperature inside the star during the dark star phase.
In the next section, we first show the results from the run with a fiducial set of parameter values. We call this model “base model”. The parameters of our base model are a power-law gas mass accretion rate G-rate, and . We will also show the results of models which adopt different values for these two parameters.
3 Results
3.1 Base model
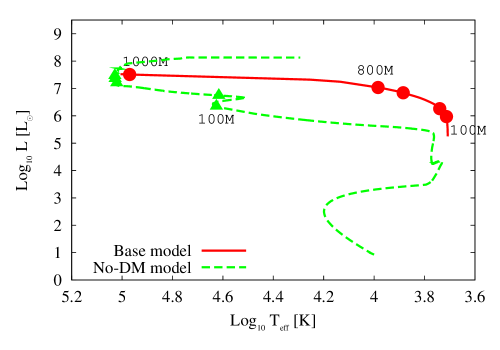
Figure 3 shows the evolution of the dark star in the Hertzsprung-Russell (HR) diagram. The accreting star grows constantly in mass. In the HR diagram, the star moves upward and then turns to the left (higher temperature). The solid line is for our dark star model, whereas the dashed line is for a standard Population III model (without DM annihilation energy; no-DM model, Umeda et al. (2009)). Symbols indicate the times when the stellar mass is and . Clearly the dark star model moves on a very different path from that of the no-DM model, showing a significant effect of the DM annihilation energy. In the no-DM model, the star contracts gravitationally and becomes hot quickly until the first symbol (). The dark star, on the other hand, has essentially the same effective temperature because DM annihilation energy prevents the star from gravitational contraction. When the no-DM star reaches , it expands, and turns to the lower temperature side in the HR diagram. There, the hydrogen burning becomes effective to supply energy to stop the contraction and the star expands slightly. Subsequently the star lands on the main-sequence phase.
Contrastingly, the dark star remains “cool” while it is powered by DM annihilation. This is because the DM annihilation energy (Eq. 4) is independent of the stellar temperature. Even if the stellar interior remains at low temperatures, DM annihilation can produce enough energy to sustain the stellar structure. As long as this condition is met, the star cannot contract while still grows in mass by accretion. Interestingly, by the time when the dark star reaches main-sequence, the stellar mass is already , which is much larger than the no-DM case ().
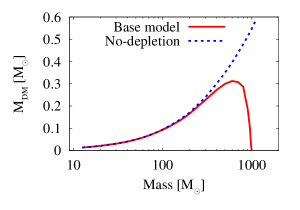
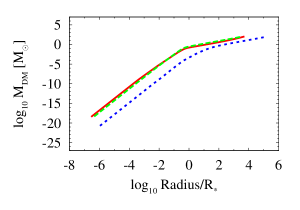
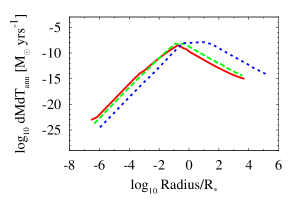
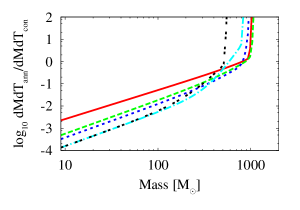
Figure 4 shows the evolution of the DM mass inside the star and its time derivative. The left panel shows the total DM mass inside the star, whereas the right panel shows the ratio of the rate of DM annihilation in mass to the rate of DM mass increase (within the star) owing to adiabatic contraction:
| (5) |
In Figure 4, we show the results for an additional model in which the depletion of DM in the star is not taken into account. Although this case might appear unrealistic, it is useful to see when DM depletion becomes substantial. The solid line represents our “base model” while the dashed line shows the result of the no-depletion case. Up to , there is almost no difference between the two cases. At , however, DM depletion becomes significant and then the total DM mass actually starts decreasing. The evolution thereafter is interesting. The DM “fuel” inside the star runs short to sustain the star. The star stops expanding, the gas density increases more efficiently, and then DM density also increases again. Then DM annihilation consumes rapidly the DM fuel inside the star. Finally, the DM annihilation energy cannot sustain the star, marking the end of the dark star phase. The star collapses and will eventually reach the main-sequence phase.
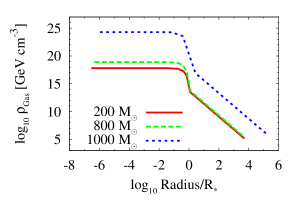
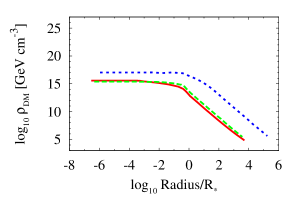
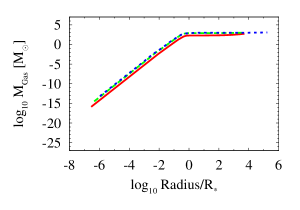
Figure 5 shows the radial profiles for various quantities of gas (left) and DM (right) when the stellar mass is (solid lines), 800 (dashed lines) and (dotted lines) respectively. The horizontal axis is the radial distance from the stellar center divided by the stellar radius.
The top panels show the evolution of gas density and DM density. Between to , the star has an extended structure and the central density does not increase much. The DM density increases by adiabatic contraction but actually decreases slightly at the inner most part owing to annihilation. At the final contraction phase ( to ), both the gas density and the DM density increase substantially.
The middle panels show the evolution of enclosed mass of gas and DM. Although the gas mass profile stays roughly unchanged, the DM mass decreases dramatically during the final phase from to . Note that the horizontal axis in the plots shows a normalized radius . The stellar radius itself changes significantly over the plotted range of evolutionary stages. Because the dark star phase ends with the runaway burning of DM inside of the star, the total amount of DM when is already very small.
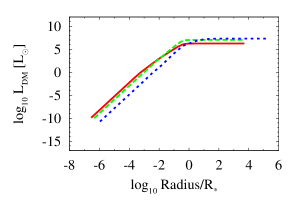
The bottom-left panel shows the DM annihilation rate and the bottom-right panel shows the total luminosity generated by the DM annihilation within the radius. These panels show the energy generating efficiency from the DM annihilation. Again, we see that the annihilation rate is low inside the star at the final stage and the enclosed DM luminosity at the stellar surface (at ) is smaller than in the earlier phases. The stellar mass increases by gas accretion but the DM energy supply decreases; this causes the star to contract.
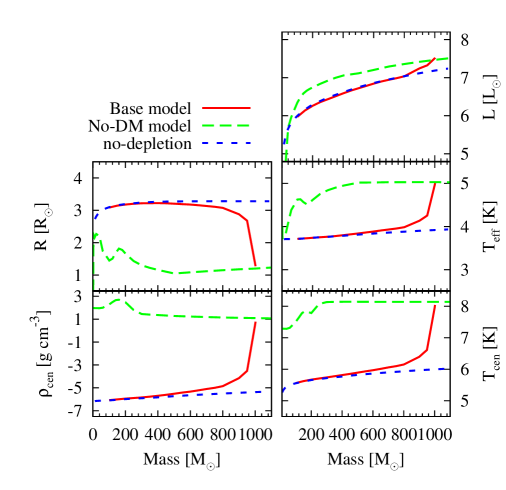
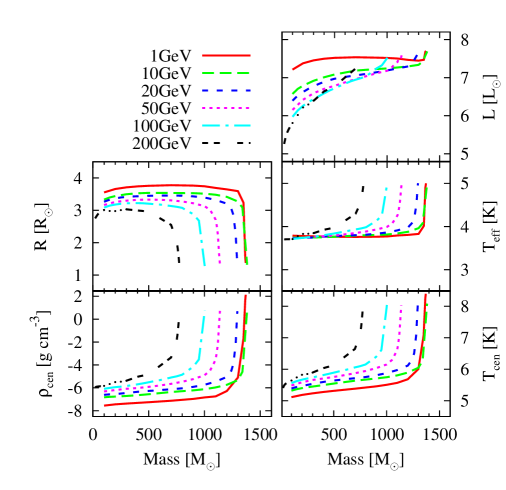
Figure 6 shows the evolution of some basic stellar quantities which characterize the dark star. We compare the results of our base model (solid lines) with those of no-DM model (dashed lines) and of no-depletion model (dotted lines). Until the star grows to , the base model and the no-depletion model appear very similar, showing again that DM depletion is negligible in early phases. After the star grows to , we see small but appreciable differences between the base model and the no-depletion model. As has been shown in Figure 4, DM is consumed by annihilation inside the star whereas the supply by adiabatic contraction is slow owing to the small gas mass accretion rate. As the star becomes more massive, it needs more DM to produce necessary energy to sustain gravitational equilibrium. When the DM supply becomes insufficient, this quasi-stable dark star phase cannot be sustained. It occurs at for the base model. The stellar properties, however, do not change immediately until up to . At around , the DM inside the star burns out rapidly, the star begins to collapse, and the central temperature increases rapidly. Finally the central temperature reaches , the nuclear burning will soon start, and the star will eventually land on the main-sequence.
Table 1 summarizes the basic stellar properties at several characteristic phases. Note that the elapsed time difference (the right column) is large between and . The dark star phase continues for about . Throughout the run, the DM mass is very small compared with the stellar gas mass. Dark stars can be sustained by the DM of only of their total mass .
3.2 The effect of gas mass accretion rate
We now explore a few parameter spaces. Our dark star model has essentially two parameters, the gas mass accretion rate and the DM particle mass. First, we examine the effect of the gas mass accretion rate. We adopt three accretion rates, and G-rate (Figure 2). “G-rate” is the gas accretion rate in our base model (Eq. 3). In general, less DM is attracted toward the star for smaller gas accretion rates. We consider only smaller accretion rates than G-rate because it seems reasonable to assume that various proto-stellar feedback effects, such as ionizing radiation from the star, can only reduce the gas mass accretion rate.
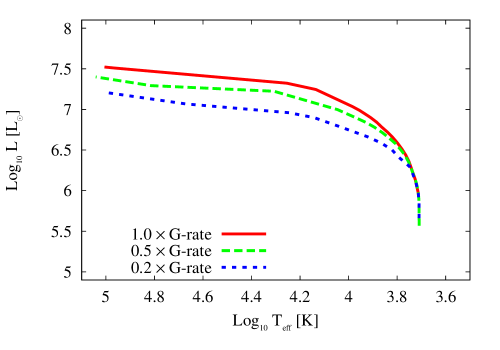
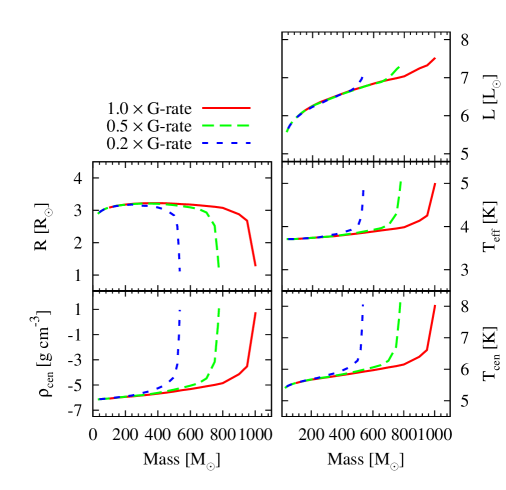
Figure 7 shows the stellar evolution for the three models with different accretion rates in the HR diagram. Initially, the stars are puffy, cool and evolve along virtually the same path. Tables 2 and 3 show the basic stellar properties when the models with the reduced accretion rates reach the end of the stable phase where , and where , respectively. The latter phase is the end of our calculations. As is expected naively, the final stellar mass is smaller for lower gas accretion rates, but the period of the dark star phase is actually longer. In the reduced accretion models, the star needs a longer time to reach the same stellar mass. Then the DM density inside the star is smaller because the gas contraction is slow. Consequently, the star with a smaller gas accretion rate ends the dark star phase and begins to contract when its mass is smaller than in the base model.
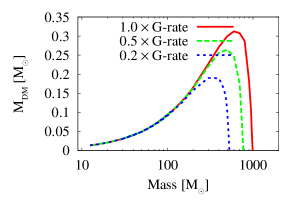
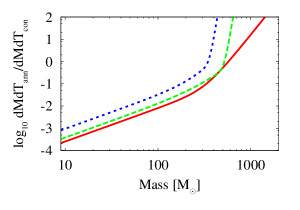
Figures 8 and 9 show clearly the effect of reducing the accretion rate. There are essentially no differences among the three models when the stellar mass is small. The DM fuel inside the star increases very similarly (Fig. 8a) because the rate of DM decrease to DM increase is very small (Fig. 8b). For the smallest accretion rate, the dark star ends when the stellar mass reaches . Overall, the lower the accretion rate is, the smaller the DM mass is inside the star. The dark star phase lasts longer but ends at lower masses.
3.3 The effect of DM particle mass
Finally, we study models with different DM particle masses. We adopt the base accretion rate of G-rate which is larger than those adopted in Spolyar et al. (2009) (see Figure 2). so our results are slightly different from theirs, especially for a small DM particle mass case. We discuss this issue later in this section.
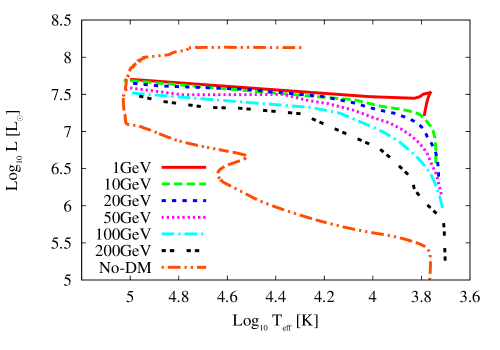
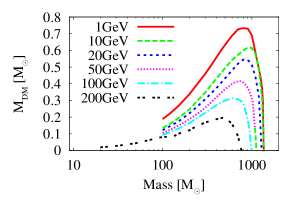
We run six models with and . Note that, from Eq. 4, the DM annihilation energy is inversely proportional to . Thus the characteristic features of dark stars appear strongly in runs with small DM masses. Figures 10, 11 and 12 show the results for the five models. For smaller DM particle masses, the DM annihilation rate is large, and thus the star expands more and the temperature and density in the star are lower. The period of the dark star phase is also prolonged for smaller , and the final stellar mass gets larger than our base model.
Tables 4 and 5 list the basic properties of the stars when the surface temperature reaches and , respectively. The final stellar mass differs by about a factor of two among the five models; to in Table 5. The overall trend is as describe above, but the lightest particle model is worth describing more in detail. When the star enters main-sequence, the stellar mass in model is similar to that of model, although it has 10 times larger DM energy generation rate. The reason is that the DM burning rate is too large in model. When the DM consumption rate exceeds the DM supply by adiabatic contraction (see discussion in Sec. 3.1), the star runs out of the DM fuel and begins to contract. The DM consumption becomes even more efficient then. This final “runaway” phase takes place faster in model than in model. Consequently, the star lands on the main-sequence early in model (see the last column of Table 5 which gives the elapsed time).
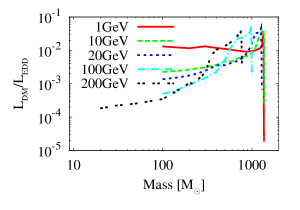
Interestingly, the model predicts the most luminous star, reaching some at the peak (Fig. 12). The extremely high luminosity is, however, still smaller than the upper-limit given by the Eddington Luminosity :
| (6) |
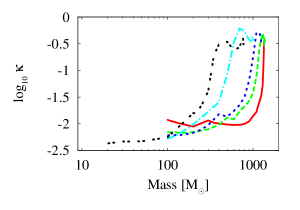
where the opacity determines essentially the critical luminosity. Figure 13 shows the ratio of the energy generation rate of DM annihilation (“luminosity”) to the Eddington luminosity for our five models with different DM particle masses. The ratio stays always less than unity, even for model. During the dark star phase (), the opacity at lower temperatures is mainly contributed by ion which has a small value.
4 Discussion
4.1 Dark Star Models
We compare our results with those of previous works. Unlike previous studies (e.g., Spolyar et al. (2009)), we solve full radiative transfer and follow self-consistently the stellar structure and its evolution. A direct comparison can be made with the results of Table 2 in Spolyar et al. (2009) (hereafter “SP09”), by using the result of our G-rate model (see Sec. 3.2; hereafter “05G”). The other model parameters are set to be the same, and , except for the gas mass accretion rate. The gas mass accretion rates in these two models (Figure 2) are almost the same at , which is the main period of the dark star phase. The results of 05G and SP09 are roughly similar; in stellar radius, luminosity and other quantities, the differences are less than at (the first line in SP09), and remain within a factor of two at later stages. During calculation, 05G model has a slightly expanded structure and is somewhat cooler than SP09 model. On the other hand, the difference of the central temperature is relatively large between the two models. The value in 05G becomes lower than in SP09 especially at the final stages; at , in 05G whereas in SP09. Because of the lower central temperature, nuclear burning is unimportant in our calculations.
4.2 Possible Range of WIMP DM mass
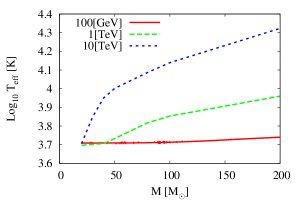
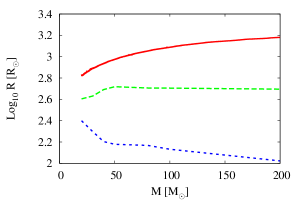
The WIMP mass significantly affect the duration of the dark star phase because the DM annihilation energy is inversely proportional to the WIMP mass , as can be seen in Eq. 4. We have already shown the effect in Section 3.3 for a typical DM mass range, from 1 to 200 GeV. However, in supersymmetric particle physics models, the WIMP DM mass may be 10 TeV or even greater. To estimate the evolutionary path of dark star models with heavier WIMPs, we have run our no-depletion model for two larger WIMP masses, and . Figure 14a and 14b show the result. At the beginning of the calculation with , all the models are in the dark star phase and on the Hayashi-line in the H-R diagram. The left panel of Fig. 14 shows that, at this phase, all models have . For = 10 TeV, the Pop.III star leaves the dark star phase early. Because annihilation rate is small for a large WIMP mass, the stellar mass at the end of the dark star phase remains small.
All the dark star models are on line at first (see also Fig. 10) and leave the line gradually as mass-accretion continues. To quantify the evolution, we define two characteristic stellar masses, and , the stellar masses at which the surface temperature reaches and . The former indicate the phase where the star deviates from the Hayashi-line. The later indicates when a star ends the stable dark star phase. The result is, and for , respectively. We conclude that Pop.III stars with a large WIMP mass up to 10 TeV can path through the dark star phase, although the duration of this phase are very short. The final stellar masses are small for the dark stars with most massive WIMPs.
Note that we have used no-depletion models here for simplicity, because dark matter depletion effect is small for the early stages of the dark star evolution. If we take the DM depletion into account, a dark star ends the stable phase earlier and above two quantities and become smaller.
5 Conclusion
We have studied the pre-main-sequence evolution of dark stars by following the self-consistent stellar evolution. We have suitably modified the code to incorporate the energy generation from spherically distributed DM.
Our base model with and G-rate shows the characteristic features of the dark star phase; the large DM annihilation energy expands the star, making the star to be in gravitational equilibrium. The lower temperature is one of the peculiar properties of the dark star. This stable phase continues until the energy supply from DM annihilation becomes insufficient to maintain the stable structure. Finally, the star collapses rapidly and reaches the main-sequence phase. At this point, the stellar mass has grown up to . Such features in dark star phase are all consistent with the findings of previous works of Iocco et al. (2008); Spolyar et al. (2009) who employed much simpler stellar models.
The dark star model has effectively two parameters. One of them is the gas mass accretion rate which determines the evolution of the gas and DM distribution. Cosmological simulations predict a variety of gas accretion rates. For a small accretion rate, the period of the dark star phase increases whereas the final stellar mass decreases . Note however that the mass is still larger than the standard Pop III (no-DM) case (. Another parameter is the DM particle mass which determines the energy generation rate. For a small DM particle mass, the period of dark star phase becomes longer and the final stellar mass becomes larger (see Table 5).
All models pass through the dark star phase and this phase is maintained by a little DM fuel which is less than of the stellar mass. If the first stars in the universe have undergone such phase, there are exotic stars which are cool and massive in the early universe.
Formation of very massive dark stars has an important implication. Such stars eventually collapse gravitationally, to form massive black holes with masses as large as . The remnant black holes can also grow by accretion or by mergers to seed super-massive black holes. The exotic feature of dark star’s appearance, luminous and cool, may be able to use as the powerful clue to search such stars. Our calculations show that first stars can grow to be dark stars with luminosity at most and they will not be detectable by JWST. However, Freese et al. (2010) estimate for super-massive dark stars (SMDSs) and such very massive and bright stars (about ) can be detected by JWST. Sandick et al. (2010) argue that dark star remnants might survive to the present day in the Milky Way, leaving -ray signatures from DM annihilation.
In future work, we will include the nuclear reaction to calculate the first star evolution from the dark star phase to the main-sequence phase completely. It would be also interesting to include capture of DM particles. Once the stars have contracted and stop growing in mass, there will be no more DM supplied by adiabatic contraction. However, DM particle may still be captured by the star. Previous studies showed that this process can make the star back in the dark star phase again. We will explore the effect of DM capture and make a complete evolutionary model of the first stars with DM annihilation.
References
- Bertone et al. (2005) Bertone, G., Hooper, D. & Silk, J. 2005, Phys. Rep., 405, 279
- Blumenthal et al. (1986) Blumenthal, G. R., Faber, S. M., Flores, R. & Primack, J. R. 1986, ApJ, 301, 27
- Bromm et al. (2009) Bromm, V., Yoshida, N., Hernquist, L. & McKee, C. F. 2009, Nature, 459, 49
- Freese et al. (2009) Freese, K., Gondolo, P., Sellwood, J. A. & Spolyar, D. 2009, ApJ, 693, 1563
- Freese et al. (2010) Freese, K., Ilie, C., Spolyar, D., Valluri, M. & Bodenheimer, P. 2010, ApJ, 716, 1397
- Gao et al. (2007) Gao, L., Yoshida, N., Abel, T., Frenk, C. S., Jenkins, A. & Springel, V. 2007, MNRAS, 378, 449
- Iocco et al. (2008) Iocco, F., Bressan, A., Ripamonti, E., Schneider, R., Ferrara, A., & Marigo, P. 2008, MNRAS, 390, 1655
- Natarajan et al. (2009) Natarajan, A., Tan, J. C. & O’Shea, B. W. 2009, ApJ, 692, 574
- Ohkubo et al. (2006) Ohkubo, T., Umeda, H., Maeda, K., Nomoto, K., Suzuki, T., Tsuruta, S. & Rees, M. J. 2006, ApJ, 645, 1352
- Ohkubo et al. (2009) Ohkubo, T., Nomoto, K., Umeda, H., Yoshida, N. & Tsuruta, S. 2009, ApJ, 706, 1184
- Omukai & Nishi (1998) Omukai, K. & Nishi, R. 1998, ApJ, 508, 1410
- Sandick et al. (2010) Sandick, P., Diemand, J., Freese, K. & Spolyar, D. arXiv:1012, 0068 [astro-ph.CO]
- Springel (2005) Springel, V. 2005, MNRAS, 364, 1105
- Spolyar et al. (2008) Spolyar, D., Freese, K., & Gondolo, P. 2008, Phys. Rev. Lett., 100, 1101
- Spolyar et al. (2009) Spolyar, D., Bodenheimer, P., Freese, K. & Gondolo P. 2009, ApJ, 705, 1031
- Taoso et al. (2008) Taoso, M., Bertone, G., Meynet, G. & Ekstrom, S. 2008, Phys. Rev. D, 78, 123510
- Tegmark et al. (1997) Tegmark, M., Silk, J., Rees, M. J., Blanchard, A., Abel, T. & Palla, F. 1997, ApJ, 474, 1
- Umeda et al. (2009) Umeda, H., Yoshida, N., Nomoto, K., Tsuruta, S., Sasaki, M. & Ohkubo, T. 2009, J. Cosmology Astropart. Phys, 08, 024
- Yoon et al. (2008) Yoon, S.-C., Iocco, F. & Akiyama, S. 2008, ApJ, 688, 1
- Yoshida et al. (2003) Yoshida, N., Sokasian, A., Hernquist, L. & Springel, V. 2003, ApJ, 598, 73
- Yoshida et al. (2006) Yoshida, N., Omukai, K., Hernquist, L. & Abel, T. 2006, ApJ, 652, 6
- Yoshida et al. (2008) Yoshida, N., Omukai, K. & Hernquist, L. 2008, Sci, 321, 669
- Young (1980) Young, P. 1980, ApJ, 242, 1232
 |
 |
 |
 |
 |
 |
 |
 |
 |
 |
 |
 |
 |
 |
 |
 |
| 200 | 1.51E3 | 1.83E6 | 5.49E3 | 4.69E5 | 0.166 | 0.017 |
| 600 | 1.51E3 | 6.98E6 | 7.67E3 | 9.33E5 | 0.313 | 0.097 |
| 800 | 1.19E3 | 1.08E7 | 9.65E3 | 1.42E6 | 0.287 | 0.153 |
| 1000 | 21.98 | 3.24E7 | 9.33E4 | 9.25E7 | 3.75E-4 | 0.218 |
Note. — We tabulate the main results for the base dark star model at stellar masses, . The columns show, from left to right, the stellar radius, luminosity, surface temperature, central temperature, DM mass inside the star, and the time elapsed from the beginning of the calculation.
| Accretion Rate | |||||||
|---|---|---|---|---|---|---|---|
| 1.0 G-rate | 821 | 1.14E3 | 1.15E7 | 1.00E4 | 1.51E6 | 0.277 | 0.160 |
| 0.5 G-rate | 682 | 9.87E2 | 8.67E6 | 1.00E4 | 1.56E6 | 0.205 | 0.237 |
| 0.2 G-rate | 492 | 7.87E2 | 5.55E6 | 1.00E4 | 1.63E6 | 0.125 | 0.351 |
Note. — Stellar properties for three accretion models when the stellar surface temperature reaches . After this phase, the star begins to run out the DM fuel and begins to gravitationally contract.
| Accretion Rate | |||||||
|---|---|---|---|---|---|---|---|
| 1.0 G-rate | 1002 | 19.27 | 3.32E7 | 1.00E5 | 1.07E8 | 2.43E-4 | 0.220 |
| 0.5 G-rate | 775 | 16.55 | 2.43E7 | 1.00E5 | 1.08E8 | 1.46E-4 | 0.291 |
| 0.2 G-rate | 534 | 13.44 | 1.62E7 | 1.00E5 | 1.09E8 | 7.65E-5 | 0.401 |
Note. — Stellar properties for three accretion models when the stellar surface temperature reaches . By this phase, the star has contracted sufficiently and the density and temperature has risen up enough to start the hydrogen burning. In this point, the star is not supported by DM annihilation energy, so we stop the calculation.
| 1 | 1349 | 1.82E3 | 2.92E7 | 1.00E4 | 1.11E7 | 0.096 | 0.354 |
| 10 | 1325 | 1.59E3 | 2.23E7 | 1.00E4 | 1.33E6 | 0.254 | 0.344 |
| 20 | 1214 | 1.51E3 | 2.02E7 | 1.00E4 | 1.42E6 | 0.297 | 0.298 |
| 50 | 1009 | 1.32E3 | 1.55E7 | 1.00E4 | 1.46E6 | 0.307 | 0.222 |
| 100 | 821 | 1.14E3 | 1.15E7 | 1.00E4 | 1.51E6 | 0.277 | 0.160 |
| 200 | 536 | 8.76E2 | 6.81E6 | 1.00E4 | 1.47E6 | 0.198 | 0.081 |
Note. — Stellar properties for DM mass variation models when stellar surface temperature reaches ; the end of the stable dark star phase and the start of transformation into main-sequence star.
| 1 | 1370 | 23.86 | 5.03E7 | 1.00E5 | 2.49E8 | 3.47E-6 | 0.362 |
| 10 | 1381 | 23.32 | 4.83E7 | 1.00E5 | 1.07E8 | 4.96E-5 | 0.367 |
| 20 | 1295 | 22.45 | 4.48E7 | 1.00E5 | 1.07E8 | 8.92E-5 | 0.333 |
| 50 | 1138 | 20.85 | 3.86E7 | 1.00E5 | 1.07E8 | 1.59E-4 | 0.269 |
| 100 | 1002 | 19.27 | 3.32E7 | 1.00E5 | 1.07E8 | 2.43E-4 | 0.220 |
| 200 | 776 | 18.91 | 3.16E7 | 1.00E5 | 9.95E7 | 3.88E-4 | 0.146 |
Note. — Stellar properties for DM mass variation models when stellar surface temperature reaches ; the end of calculation.