Depth Dependence of the Structural Phase Transition of SrTiO3 Studied with -NMR and Grazing Incidence X-ray Diffraction
Abstract
We present an investigation of the near-surface tetragonal phase transition in SrTiO3, using the complementary techniques of beta-detected nuclear magnetic resonance and grazing-incidence X-ray diffraction. The results show a clear depth dependence of the phase transition on scales of a few microns. The measurements support a model in which there are tetragonal domains forming in the sample at temperatures much higher than the bulk phase transition temperature. Moreover, we find that these domains tend to form at higher temperatures preferentially near the free surface of the crystal. The details of the tetragonal domain formation and their depth/lateral dependencies are discussed.
I Introduction
All phase transitions in condensed matter, other than Bose-Einstein condensation, arise because of interactions between the basic constituents, e.g. spins, ions, electrons etc. Near a surface or interface, the symmetry of these interactions is broken and thus, in general, the phases and phase transition properties (order parameter, transition temperature etc.) will be altered Binder74PRB ; Mills71PRB ; Pleimling04JPA . In this paper, we present an investigation of the effect of a free surface on the well-known structural phase transition in SrTiO3 (STO). STO has a number of interesting and useful properties. It is perhaps best known for its use as a substrate for growing oxide thin films. More recently, it was found that the interface between STO and other insulating perovskites, such as LaAlO3, may exhibit a variety of unexpected properties, including 2-dimensional electric conductivity Ohtomo04N ; Thiel06S ; Huijben06NM , magnetism Brinkman07NM ; BenShalom09PRB and even superconductivity at very low temperatures Reyren07S . Moreover, it was found that superconductivity can be induced even at the free surface of STO Ueno08NM . All these unexpected properties make the surface and near-surface region of STO of great fundamental interest as well as a candidate for potential future applications.
Bulk STO undergoes a second-order structural phase transition at K. The high-temperature phase is cubic, whereas the low-temperature phase is characterized by a small tetragonal distortion. The phase transition has been the subject of intense experimental investigations Cowley96PTSL ; Ruett97EPL ; Huennefeld02PRB ; Osterman88JPC ; Holt07PRL , and its bulk properties are well understood. However, much less is known about the behaviour close to a free surface or interface, in particular its depth dependence Ruett97EPL ; Wang98PRL ; Doi00PM ; Mishina00PRL ; Salman06PRL . Here, we report the use of two complementary techniques to better understand the nature of the phase transition near the surface. As a reciprocal space probe, grazing incidence X-ray diffraction (GIXRD) around the critical angle is well suited to resolving changes in the average periodic structure in the near-surface region of the crystalDosch92 . In addition, we probe the local structure in a depth-resolved manner using low energy beta-detected nuclear magnetic resonance (-NMR).
These two techniques provide a unique picture of the structural phase transition near the free surface. -NMR measurements exhibit no depth dependence up to nm from the surface. These results are consistent with the X-ray measurements. However, the latter extend deeper into the sample, and we find that the phase transition varies at depths of the order of a few m. From the results of both local probe and scattering measurements, we conclude that static domains of tetragonally distorted STO appear near the surface at temperatures much higher than (K higher). The temperature at which these domains appear depends on depth and varies on a scale of a few m.
II Experimental
The -NMR experiments were performed at the ISAC facility at TRIUMF. In this part of the experiment, a beam of highly polarized 8Li+ is implanted into the STO sample. Each implanted 8Li decays (lifetime s) emitting a -electron preferentially opposite to the direction of its polarization at the time of decay. Using appropriately positioned detectors, one measures the asymmetry, , of the decay along the initial polarization direction () as a function of time, which is proportional to the time evolution of the nuclear spin polarization, . The 8Li implantation energy can be varied between keV, corresponding to an average implantation depth of nm, allowing depth-resolved -NMR measurements. The GIXRD measurements were performed at the surface diffraction station of the Materials Science beamline X04SA at the SLS at the Paul Scherrer Institute. Here a beam of X-rays is scattered from the STO single crystal, with different grazing incident angles. By varying the incident angle, the mean scattering depth was varied, allowing diffraction measurements at depths from a few nm up to a few tens of m.
The samples studied here are STO (100) single crystals supplied by Crystal GmbH. Two crystals were used, in which the surface preparation was slightly different. Sample 1 was studied as received, with a polished surface, while sample 2 was etched using a HF buffered solution and annealed at 950oC in O2 flux for 20 hours, to ensure a flat, TiO2 terminated surface Koster98APL .
III Results
Recently, we have demonstrated that zero-field spin relaxation and beta-detected nuclear quadrupole resonance (-NQR) of 8Li can be used as a probe of the near-surface transition behaviour in STO Salman06PRL . The quadrupole moment of the 8Li nucleus couples to the electric field gradients (EFG) of the crystal lattice. Since the EFG is sensitive to the local lattice geometry, the implanted 8Li acts as an extremely sensitive probe of structural changes in the lattice (e.g., due to a phase transition). The implanted 8Li occupies three equivalent sites in the STO lattice; the face-centered sites in the Sr2+-centered unit cell.MacFarlane03PB3
In the cubic phase (high temperatures), the EFG is axially symmetric, with the main axis along Sr-8Li-Sr. At low temperatures, in the tetragonal phase, the EFG in two of the three sites lose their axial symmetry, depending on the direction of the tetragonal axis. In these sites, the 8Li spin polarization precesses rapidly, leading to an immediate loss of the measured initial polarization. This loss is a direct indication of the onset of the tetragonal phase transition (at least in a fraction of the sample volume). As expected, we observe a loss of polarization below the phase transition. However, upon cooling, this loss begins at temperatures as high as K, indicating that the transition, at least in part of the probed volume of the sample, occurs at a much higher temperature than . These results were attributed to an enhancement of the phase transition temperature near the surface of STO, and are in agreement with optical measurements Mishina00PRL .
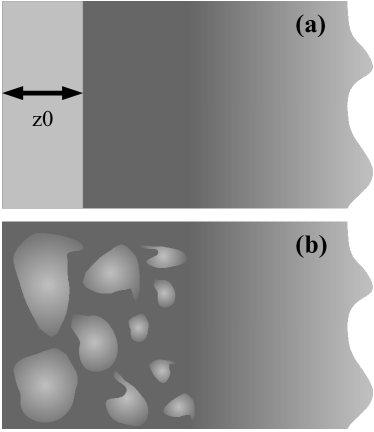
The observed enhancement of the transition temperature near the surface could be explained using one of two more general scenarios. In scenario I the order parameter has a depth () dependence but no lateral () dependence. This results in an apparent transition temperature that depends on , changing gradually from a surface value to .Pleimling04JPA In this scenario we expect that the transition starts at the surface and propagates continuously into the bulk as is decreased. This is illustrated in Fig. 1(a), where at any given temperature a layer of thickness is in the tetragonal phase with increasing as the temperature is decreased and diverges at . Alternatively, in scenario II the order parameter depends on the depth, , as well as the lateral dimensions, and . In this scenario tetragonal order above forms inhomogeneously in domains (possibly nucleating at crystal defects Wang98PRL ; Holt07PRL ), such that the average volume fraction of these domains at any given temperature depends on depth, as illustrated in Fig.1(b). As we show below, a measurement of the depth and temperature dependencies of the tetragonal volume fraction supports the second scenario.
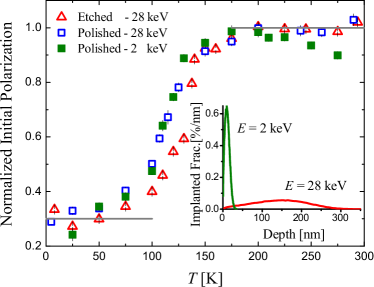
A local probe such as -NMR does not provide information on long range order but is very sensitive to changes in the local point symmetry. Also due to the size of the beam, -NMR cannot provide information regarding the lateral dimensions. However, it does enable a depth-resolved measurement, which could, in principle, provide the depth dependence of the order parameter averaged over lateral directions . In order to try and identify which of the above scenarios provides the best description, we performed a measurement of the 8Li polarization as a function of temperature at different implantation depths. In scenario I, we expect the onset of polarization loss to depend on depth. Figure 2 shows the initial 8Li polarization as a function of temperature at two implantation energies in both samples. We note first that the surface preparation does not affect the onset of polarization loss substantially. In both etched and polished samples, and at an implantation energy of 28 keV, the onset occurs at K. Nevertheless, it is much sharper in the etched sample, possibly due to the smoother surface and/or reduced defect concentration due to the etching/annealing treatment. Additionally, we do not observe any significant dependence on the 8Li implantation depth in the range 10-200 nm. Although these results do not rule out either of the scenarios, they allow us to put a lower limit on the scale of the depth dependence of this effect, i.e., it must be larger than nm. Unfortunately, the limited energy of the implanted 8Li does not allow one to probe deeper into STO Smadella09PB .
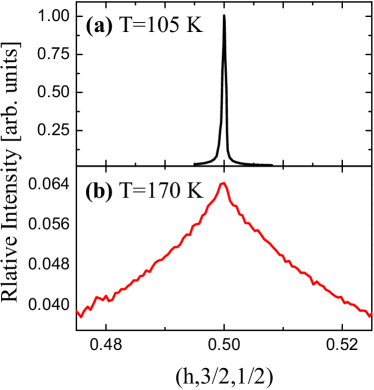
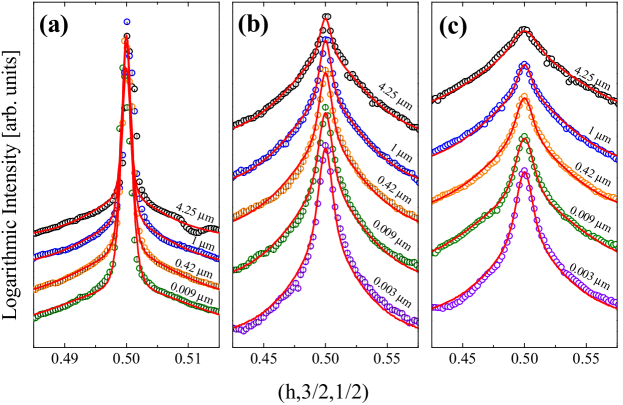
Information regarding the lateral, as well as the depth, dependence of the phase transition on scales larger than that of -NMR can be obtained using GIXRD. In these experiments, we measure the intensity of the superlattice reflections around ( ). This reflection is absent in the cubic phase and therefore can be used to monitor the development of the tetragonal phase. The GIXRD measurements were performed using 16 keV X-rays at different temperatures, and at each temperature with various incident angles relative to the crystal surface (accurate to ) Willmott05ASS . For STO, the critical grazing incident angle for total external reflection at 16 keV is . At low temperatures ( K) we observed a very sharp diffraction peak [Fig. 3(a)], which we attribute to Bragg diffraction from the tetragonal phase. In contrast, at high temperatures ( K), only a broad component is observed, since the ( ) Bragg scattering is forbidden in the cubic phase. This component is attributed to lattice dynamics, i.e. scattering by thermally populated phonons or thermal diffuse scattering (TDS) from the full volume of the sampleHolt99PRL ; Wang00PRB ; Holt07PRL ; NielsenXRay . The diffraction peaks at intermediate temperatures are shown in Fig. 4; they consists of two components in this temperature range: a narrow and a broad component. As the temperature is decreased, the narrow component grows and eventually dominates the low-temperature diffraction. All these peaks could be fit satisfactorily with a broad Lorentzian plus a narrow squared Lorentzian function Yoshizawa82PRL ; Ruett97EPL ; Papoular97PRB ; Holt07PRL ,
| (1) |
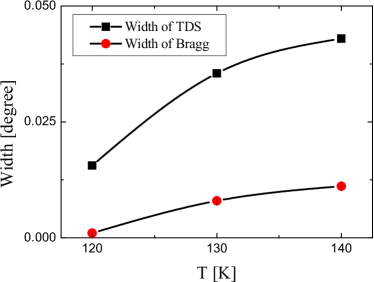
where and are the width/areas of the corresponding component. represents a Lorentzian function of with a width . In these fits we assume that, for a fixed temperature, the width of the TDS and Bragg contributions are depth independent. Note that this assumption may be a simplification, however, it give a good fit to the experimental data and minimizes the number of free parameters. The extracted values of the width as a function of temperature are shown in Fig. 5.
Below we discuss the relation between and as a function of temperature and depth.
IV Discussion
We start by looking at the area of the two components shown in Fig. 4 as a function of temperature. In Fig. 6(a), we plot the ratio of the areas of the narrow to broad component () as a function of the incidence angle at different temperatures. It clearly shows that the contribution of the narrow component is larger at lower temperatures and extends deeper into the sample. Note the narrow component is present even at temperatures much higher than the bulk transition (see Fig. 4). This confirms that at least part of the sample is non-cubic even above , in agreement with the -NMR measurements.
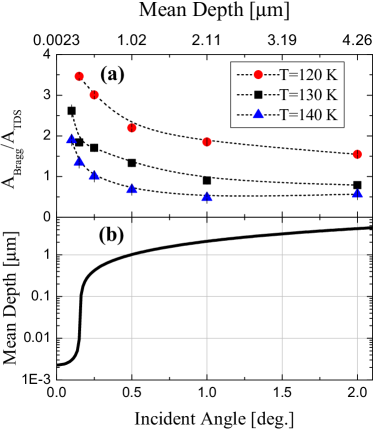
Next we discuss the dependence of the Bragg peaks on incidence angle. As shown in Fig. 4, at all temperatures we find that the relative intensity of the narrow component grows gradually as the incident angle decreases, indicating that the contribution from the non-cubic phase is enhanced in the near-surface region [Fig. 6(a)]. The observed depth dependence of clearly exhibits that there is a “crossover” in the properties of the phase transition from the bulk to the surface, which propagates smoothly and gradually on a depth scale of a few microns, much longer than can be detected with -NMR. Moreover, we observe contributions from both the tetragonal, as well as the cubic, phase at all measured depths and intermediate temperatures.
Assume first a near-surface transition is described according to scenario I [Fig. 1(a)]. Then the contribution of the narrow component is proportional to the tetragonal volume seen by the X-ray beam,
| (2) |
where is the thickness of the tetragonal layer at a given temperature, is the mean penetration depth of the X-rays, is the cross section area of the beam, and we assume, for simplicity, a sharp cutoff on the tetragonal surface phase at , i.e., is the step function,
| (3) |
Since the full volume of the sample contributes to the TDS at a given temperature, we can write
| (4) |
Therefore the ratio of both contributions at a fixed temperature is
| (5) |
Note, this depth dependence causes this ratio to saturate when . Nevertheless, while m, there is no evidence of such behaviour for small mean depths. Here, we assumed an extreme case with a step function, i.e. a certain depth value () separating the tetragonal and cubic domains. A more gradual function with a smoother separation could potentially show no leveling off for . However, given the scale of from the scattering results, we expect according to scenario I a very sharp loss of asymmetry as a function of temperature in the -NMR measurements, which is in contrast with the results shown in Fig. 2. Therefore, we conclude the results from both -NMR and GIXRD techniques together rule out scenario I and support scenario II instead. Unfortunately, neither -NMR nor GIXRD measurements provide clear information on the lateral size/distribution of the tetragonal domains. It should be pointed out here that the difference between tetragonal domains in bulk and near the surface has been studied experimentallyBuckley99JAP ; Chrosch98JPCM and theoreticallyNovak98JPCM . These studies show a clear difference between the two regions, in agreement with our results.
V Summary and Conclusions
In conclusion, by combining the results of the -NMR and GIXRD measurements we have established a surprisingly long length scale ( m) for the depth dependence of the order parameter of the phase transition in the near-surface region of STO. These results confirm the findings of previous studies Osterman88JPC ; Doi00PM ; Mishina00PRL ; Salman06PRL , which point to variations in the nature of the structural phase transition in this region. The results indicate that the phase transition in STO is initiated locally within domains scattered through the volume of the sample. The appearance of these domains depends on both temperature and surface proximity. There is a strong tendency for these domains to appear in near-surface regions even at temperatures much higher than the bulk transition temperature (as high as K). The surface alone cannot explain these observations, since it is not expected that such effect will propagate more than a few monolayers into the sample Binder74PRB ; Mills71PRB ; Pleimling04JPA . This suggests defects and strain near the surface region play an important role in the nucleation of tetragonal domains Wang98PRL ; Huennefeld02PRB . Finally, we note that the observed surface proximity effects reported here may not be limited to the structural phase transition; it is likely they may also contribute to the other intriguing phenomena observed recently near the free surface of STO Ueno08NM and its interface with other insulating oxides Ohtomo04N ; Thiel06S ; Huijben06NM ; Brinkman07NM ; BenShalom09PRB .
Acknowledgements.
This research was supported by the Center for Materials and Molecular Research at TRIUMF, NSERC of Canada and the CIAR. Part of this work was performed at the Swiss Light Source, Paul Scherrer Institut, Villigen, Switzerland. We would like to acknowledge Michael Lange, Rahim Abasalti, Bassam Hitti, Donald Arseneau, Suzannah Daviel, Phil Levy and Matthew Pearson for expert technical support.References
- (1) K. Binder, P. C. Hohenberg, Phys. Rev. B 9, 2194 (1974).
- (2) D. L. Mills, Phys. Rev. B 3, 3887 (1971).
- (3) M. Pleimling, J. Phys. A: Math. Gen. 37, R79 (2004).
- (4) A. Ohtomo, H. Y. Hwang, Nature 427, 423 (2004).
- (5) S. Thiel, G. Hammerl, A. Schmehl, C. W. Schneider, J. Mannhart, Science 313, 1942 (2006).
- (6) M. Huijben, et al., Nat. Mater. 5, 556 (2006).
- (7) A. Brinkman, et al., Nat. Mater. 6, 493 (2007).
- (8) M. Ben Shalom, et al., Phys. Rev. B 80, 140403(R) (2009).
- (9) N. Reyren, et al., Science 317, 1196 (2007).
- (10) K. Ueno, et al., Nat Mater 7, 855 (2008).
- (11) D. P. Osterman, K. Mohanty, J. Axe, J. Phys. C 21, 2635 (1988).
- (12) R. Cowley, Phil. Trans. R. Soc. London A 354, 2799 (1996).
- (13) U. Rütt, A. Diederichs, J. R. Schneider, G. Shirane, Europhys. Lett. 39, 395 (1997).
- (14) M. Holt, M. Sutton, P. Zschack, H. Hong, T. Chiang, Phys. Rev. Lett. 98, 065501 (2007).
- (15) H. Hünnefeld, et al., Phys. Rev. B 66, 014113 (2002).
- (16) S. Doi, I. Takahashi, Philos. Mag. A 80, 1889 (2000).
- (17) R. Wang, Y. Zhu, S. M. Shapiro, Phys. Rev. Lett. 80, 2370 (1998).
- (18) Z. Salman, et al., Phys. Rev. Lett. 96, 147601 (2006).
- (19) E. D. Mishina, et al., Phys. Rev. Lett. 85, 3664 (2000).
- (20) H. Dosch, Critical Phenomena at Surfaces and Interfaces: Evanescent X-Ray and Neutron Scattering (Springer, 1992).
- (21) G. Koster, B. L. Kropman, G. J. H. M. Rijnders, D. H. A. Blank, H. Rogalla, Appl. Phys. Lett. 73, 2920 (1998).
- (22) W. A. MacFarlane, et al., Physica B 326, 209 (2003).
- (23) M. Smadella, et al., Physica B 404, 924 (2009).
- (24) P. Willmott, et al., Applied Surface Science 247, 188 (2005).
- (25) J. Als-Nielsen, D. M. Morrow, Elements of Modern X-Ray Physics (Wiley, 2001).
- (26) M. Holt, et al., Phys. Rev. Lett. 83, 3317 (1999).
- (27) R. Wang, Y. Zhu, S. M. Shapiro, Phys. Rev. B 61, 8814 (2000).
- (28) M. Papoular, M. D. Núñez-Regueiro, M. Altarelli, Phys. Rev. B 56, 166 (1997).
- (29) H. Yoshizawa, et al., Phys. Rev. Lett. 48, 438 (1982).
- (30) B. L. Henke, E. M. Gullikson, J. C. Davis, Atomic Data and Nuclear Data Tables 54, 181 (1993).
- (31) X-Ray attenuation length, http://henke.lbl.gov/optical_constants/atten2.html.
- (32) A. Buckley, J. Rivera, E. Salje, J. Appl. Phys. 86, 1653 (1999).
- (33) J. Chrosch, E. K. Salje, J. Phys.: Condens. Matter 10, 2817 (1998).
- (34) J. Novak, E. K. Salje, J. Phys.: Condens. Matter 10, L359 (1998).