Magnetoresistance and Magnetic Ordering Fingerprints in Hydrogenated Graphene
Abstract
Spin-dependent features in the conductivity of graphene, chemically modified by a random distribution of hydrogen adatoms, are explored theoretically. The spin effects are taken into account using a mean-field self-consistent Hubbard model derived from first-principles calculations. A Kubo-Greenwood transport methodology is used to compute the spin-dependent transport fingerprints of weakly hydrogenated graphene-based systems with realistic sizes. Conductivity responses are obtained for paramagnetic, antiferromagnetic, or ferromagnetic macroscopic states, constructed from the mean-field solutions obtained for small graphene supercells. Magnetoresistance signals up to are calculated for hydrogen densities around . These theoretical results could serve as guidance for experimental observation of induced magnetism in graphene.
pacs:
72.80.Vp,73.20.Hb,85.75.-dIntroduction.- Close to the charge neutrality point, two-dimensional graphene exhibits fascinating transport properties deriving from the massless Dirac fermions physics Geim ; Castro . These electronic properties can be further tuned and diversified through chemical functionalization LKP or irradiation (defects formation) Krasheninnikov . Indeed, strong modifications of -bonded carbon network by grafting -type defects is, for instance, an interesting strategy to induce an insulating behavior in graphene. Following this idea, recent attempts based on hydrogenation and fluorination were able to turn graphene into a wide band-gap insulator Elias ; JZhu2010 .
While ideal bidimensional graphene is nonmagnetic, its unidimensional derivatives (graphene nanoribbons) could exhibit magnetic ordered states due to the presence of edges Rossier07 . Additionally, monovacancies or -type defects (such as those created by adsorbed atomic H) can introduce local sublattice imbalances in graphene, thus inducing magnetic moments Yazyev ; Palacios2008 according to Lieb’s theorem Lieb1989 . Experimentally, the existence of intrinsic magnetism in graphene and graphite-based materials is strongly debated Ugeda ; Kats . Some experimental works assume that the observed magnetic ordering is coming from graphene edges or grain boundaries Kats , a scenario that has been recently questioned by Sepioni and coworkers who found no magnetism even for high concentration of edge defects Sepioni . Differently, in a recent experiment RTH , signatures of room temperature ferromagnetism in metal free untreated graphite were tentatively related to the presence of hydrogen impurities. We note that in all those experiments, the nature and quantity of defects remain poorly characterized and mostly uncontrolled. It would be consequently highly desirable to clarify the conditions for observing spin-dependent transport fingerprints in hydrogenated graphene.
In this Letter, spin-dependent transport properties of hydrogenated graphene-based systems with realistic sizes are explored theoretically. Firstly, a spin-dependent one-orbital Hubbard Hamiltonian, describing adsorbed hydrogen impurities on a graphene sheet, is derived using first-principles calculations and solved at a mean-field level. The local spin texture around hydrogen adatoms is found to be strongly dependent on both the concentration and the specific adsorption sublattice of neighboring adatoms as previously reported Palacios2008 ; Soriano2010 . The self-consistent Hubbard Hamiltonian is then implemented into a real space (Kubo)-transport method. Our theoretical results reveal the suitable hydrogenation coverage of graphene to maximize spin-dependent conductivities, which translate into measurable magnetoresistance signals in the diffusive regime.
One-orbital mean-field Hubbard approximation.- The one-orbital tight-binding description of graphene restricts to orbitals centered on each carbon atom. The spin-related physics induced by Coulomb interaction is introduced in the calculation by means of the Hubbard model in its mean-field approximation
| (1) |
where is the first-neighbors hopping term, () is the creation (annihilation) operator in the lattice site () with spin , is the on-site Coulomb repulsion, and , are the self-consistent occupation numbers for spin-down and spin-up electrons, respectively. The ratio has been chosen to accurately reproduce various physical magnitudes extracted from first-principles calculations (as explained below).
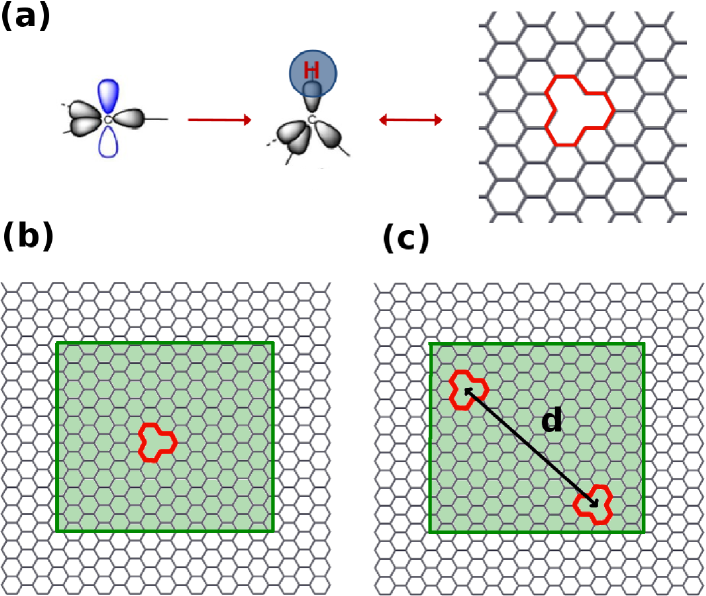
When a hydrogen (H) atom is adsorbed on top of a carbon (C) atom, the -symmetry is locally broken, and the electron from the C orbital is removed from the bands to form a bond with the H atom. Consequently, within the
tight-binding approximation, such an adsorption is modeled by removing the
corresponding electron and lattice site [as illustrated in Fig.1 (a)]. Figure 1(b) presents one of the supercells
( atomic sites) used in periodic boundary conditions calculations. This hydrogen defect induces zero-energy
electronic states which are mainly localized around the impurity Ugeda ; CastroNeto . When the Coulomb repulsion is switched on
in the calculation, these zero-energy states spin-polarize, leading to
semi-local magnetic moments with a staggered spin density mostly located on one
sublattice Yazyev ; Palacios2008 ; Soriano2010 [see Fig.2 (a,d)].
When a finite concentration of defects is present, the magnetic ordering
between these magnetic moments is dictated by the
sublattices where they are located, being co-polarized or ferromagnetic (FM) for the same sublattice
and counter-polarized or antiferromagnetic (AF) otherwise [Fig.2(b,e)].
Magnetic states.-
The total spin of the macroscopic ground state is given by
the excess of magnetic moments on one specific sublattice,
although is the most likely value on simple statistical grounds
(equal H occupation of both sublattices).
In the following, two assumptions related to the macroscopic magnetic
states are considered. The first one is the simplest: a paramagnetic (PM) state, which is a good approximation for sufficiently low H concentrations, or at sufficiently high temperatures, in which there is
no correlation between the semi-local moments.
This state is thus constructed from independent large supercells containing a
single vacancy as shown in Fig.1 (b). The corresponding spin densities
on each cell site is represented in Fig.2(a,d) as a function of the distance to the center of the supercell
for two different concentrations of defects. The result favorably compare with first principles calculations when
is chosen appropriately ABINITIO .
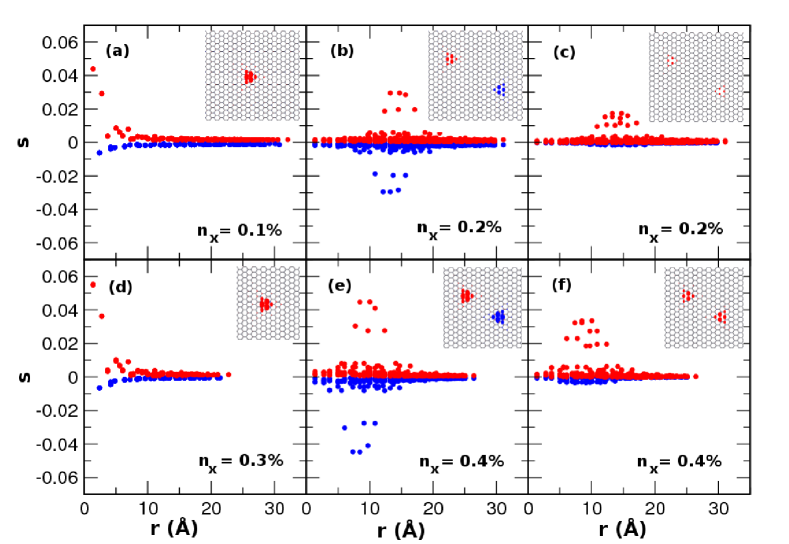
The second assumption is more complex since pairwise magnetic ordered states are investigated. The latter are constructed using supercells containing two vacancies on different sublattices [see Fig.1 (c)] far from the edges. When selecting one site on each sub-lattice [see Fig.1(b,e)], the magnetic moments couple antiferromagnetically and the macroscopic state generated by merging several supercells is an antiferromagnet (AF) with zero total spin (). We explore the effect of the distance () between vacancies while varying accordingly the supercell size. By changing simultaneously the distance and size, we always allow for a meaningful definition for the concentration based on only two vacancies per cell. One notes that for () the vacancies become very close to each other, thus allowing overlapping between magnetic moments and suppression of the local antiferromagnetic state Palacios2008 . We note that, when the vacancies are in the same sublattice, the ground state is ferromagnetic (FM), but we will not consider this case in this work.
The AF ordering can be further tuned by applying a sufficiently large external magnetic field. This has been estimated to lie in the range T for hydrogenated graphene nanoribbonsSoriano2010 and similar distances between H adatoms. Since the magnitude of the local magnetic moments is lower in the case of graphene due to the absence of confinement, we expect the number to be smaller in the present case. On application of the field, the local magnetic moments become co-polarized giving rise to a FM state. The difference in the magnetic ordering can affect the conductivity and induce a magnetoresistive (MR) response as discussed for graphene nanoribbons in Ref. Soriano2010, . To study the possible magnetoresistance signals in hydrogenated graphene samples, the spin density and related spin-dependent on-site energies have been computed for this specific case [Fig.2(c,f)].
Kubo conductivity methodology.- Using the self-consistent Hubbard Hamiltonian calculations, spin-dependent
on-site energies are estimated for each supercell. These tight-binding parameters are then used
for computing the conductivity in realistic-sized samples applying the Kubo formalism. These graphene samples are constructed
by attaching a large number of these supercells following different random arrangements. An efficient
real space order N method is then used to simultaneously follow the wavepackets dynamics and to
compute the Kubo conductivity (see Refs. Kubo1, for details). The analysis of the wavepacket dynamics
allows to extract the conduction mechanisms and transport length scales (mean free path). As long as the diffusion coefficients are found to reach a saturation regime after a few thousands of femtoseconds, and then remain
roughly constant up to very long times, indicating a diffusive regime and a negligible contribution of
quantum interferences within the computational reach. The maximum value allows the evaluation of , with
. Note that the transport properties are calculated in the zero temperature limit, which
should however be robust to higher temperatures given the weak electron-phonon coupling in graphene.
Spin-dependent transport features.- The scaling analysis of the conductivity is carried out using the Kubo
formula where are the
spin-dependent DoS per unit of surface at the energy E. At a fixed energy,
reach their maximal values at the same time as () which gives the
spin-dependent Drude conductivities ), that accounts for
the disorder effects on the density of states.
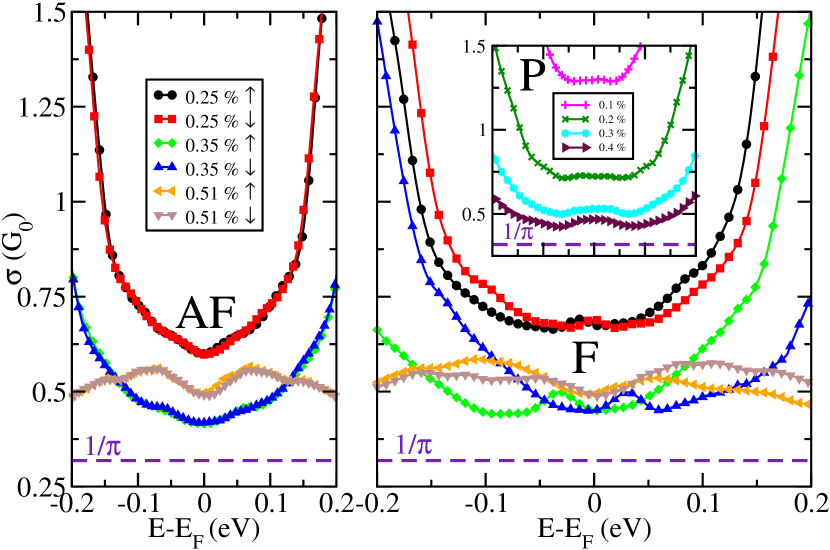
Fig. 3 presents the Drude conductivities for the AF (left panel),
FM cases (right panel) and the approximated PM case (inset in right panel) for H concentrations varying from up to .
As expected, both in the AF and the PM case, no spin-dependent transport features
are observed in the results, with the conductivities for up and down spins being
equal within the statistical error. We note, however, some differences in the shape of
the conductivity curves versus energy close to the Dirac point between the PM and AF cases.
In sharp contrast, in the FM case, the spin-dependent conductivities significantly differ away from the charge neutrality point, with typically increasing with energy. decays roughly linearly with for the lowest H density (which is a trend general for resonant scattering Wehling ), but one clearly observes a tendency towards saturation at higher concentration.
It is worth mentioning that, in all cases, the total Drude conductivities ()
remain larger than , which is the theoretical minimum value estimated within the self-consistent Born
approximation Ando .
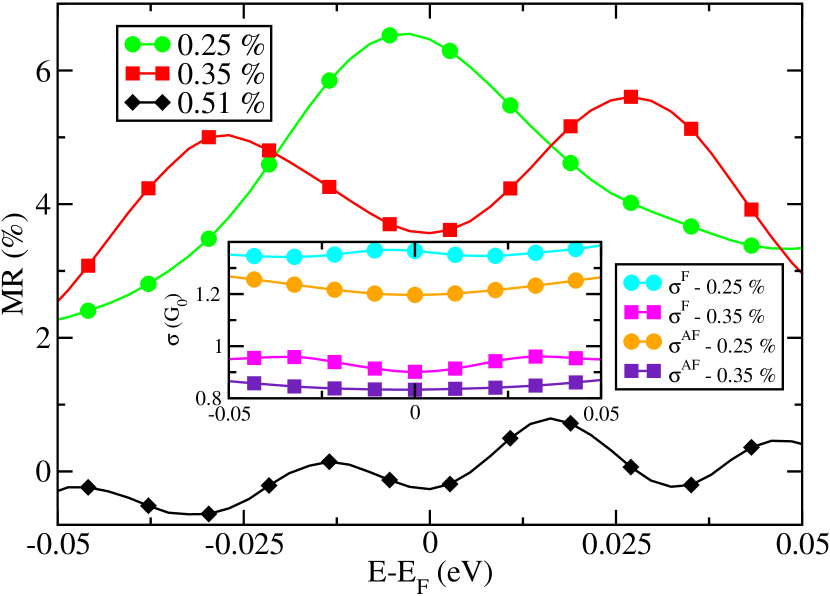
¿From the computed conductivities in the AF and FM cases, one extracts (for AB-sublattice
preserved symmetry), the magnetoresistance ,
with and
. Fig. 4 shows MR for three different H concentrations. The maximum signal is observed for the lowest density and reaches about for a switch from the antiferromagnetic to the excited ferromagnetic case. The signal is reduced with increasing and tends to disappear at higher concentrations, along with the spin density. One also notes that, since the macroscopic states are built out of supercells carrying only two vacancies, the number of magnetic correlations is likely underestimated. Hence, experimental observations of larger MR values would not be a surprise. We observe some asymmetry in the MR profiles (Fig.4) which roots in small numerical inaccuracies stemming from both, the approximated Hubbard Hamiltonian and the use of a random phase approximation for the Kubo methodology. Fig.4 (inset) also emphasizes the energy-dependence conductivities for and close to Fermi level, which result in the qualitatively different profiles observed in the energy-dependent MR signals.
Conclusion.-Spin-dependent conductivities in disordered, hydrogenated graphene have been computed and related to the underlying magnetic ordering taking place at a large scale. Magnetoresistance signals of up to have been found in the low density limit, suggesting that the existence of local magnetic states in graphene, induced by hydrogenation, could be observed experimentally. The high concentration limit () in which stronger quantum interferences and localization effects should take place deserves a further consideration.
Acknowledgements.-Funding by Spanish MICINN is acknowledged by D.S. and J.J.P. (Grants FIS2010-21883-C02-02 and CSD2007-00010) and P.O. (Grants FIS2009-12721-C04-01 and CSD2007-00050). D.S. was supported by the PhD Grant Program from CSIC and the Unidad Asociada of the Universidad de Alicante and acknowledges Joaquín Fernández-Rossier for discussions. This work is connected to the Belgian Program on Interuniversity Attraction Poles (PAI6), to the NanoHymo ARC sponsored by the Communauté Française de Belgique, to the ETSF e-I3 project (Grant 211956), and to the NANOSIM-GRAPHENE Project
ANR-09-NANO-016-01. J.-C.C. acknowledges funding from the FNRS of Belgium. Computational resources were provided by the CISM of the Université Catholique de Louvain.
References
- (1) A.K. Geim and K.S. Novoselov, Nature Materials 6, 183 (2007).
- (2) A.H. Castro Neto et al., Rev. Mod. Phys. 81, 109 (2009); D.S.L. Abergel et al., Adv. Phys. 59, 261 (2010).
- (3) K.P. Loh et al., J. Mat. Chem. 20, 2277-2289 (2010).
- (4) A.V. Krasheninnikov and F. Banhart, Nat. Mat. 6, 723 (2007).
- (5) D.C. Elias et al., Science 323, 610-613 (2009); A. Bostwick et al., Phys. Rev. Lett. 103, 056404 (2009); J. Katoch et al., Phys. Rev. B 82, 081417(R) (2010).
- (6) S.H. Cheng et al., Phys. Rev. B 81, 205435 (2010); F. Withers, M. Dubois, A.K. Savchenko, Phys. Rev. B 82, 073403 (2010).
- (7) Y.-W. Son, M. L. Cohen, and S. G. Louie, Phys. Rev. Lett. 97, 216803 (2006); J. Fernández-Rossier and J. J. Palacios, Phys. Rev. Lett. 99, 177204 (2007).
- (8) O.V. Yazyev and L. Helm, Phys. Rev. B 75, 125408 (2007); O.V. Yazyev, Phys. Rev. Lett. 101, 037203 (2008); ibidem, Rep. Prog. Phys. 73, 056501 (2010).
- (9) Y.-W. Son, M.L. Cohen, S.G. Louie, Nature 444, 347, (2006); J.J. Palacios, J. Fernández-Rossier, L. Brey, Phys. Rev. B 77, 195428 (2008).
- (10) E.H. Lieb, Phys. Rev. Lett. 62, 1201 (1989).
- (11) M. M. Ugeda et al., Phys. Rev. Lett. 104, 096804 (2010).
- (12) P. Esquinazi et al., Phys. Rev. Lett. 91, 227201 (2003); J. Cervenka, M. I. Katsnelson, C.F.J. Flipse, Nat. Phys. 5, 840 (2009); D. Martinez-Martin, et al., Phys. Rev. Lett. 105, 257203 (2010).
- (13) M. Sepioni et al., Phys. Rev. Lett. 105, 207205 (2010).
- (14) H. Ohldag et al., New J. Phys. 12, 123012 (2010); A. Candini et al., Phys. Rev. B 83, 121401(R) (2011).
- (15) D. Soriano et al., Phys. Rev. B 81, 165409 (2010).
- (16) N.M.R. Peres, F. Guinea, A.H. Castro Neto, Phys. Rev. B 73, 125411 (2006); V.M. Pereira, J.M.B. Lopes dos Santos, A.H. Castro Neto, Phys. Rev. B 77, 115109 (2008).
- (17) Due to the zero-energy wave-function decay close to a hydrogen adatom in graphene, , the supercell size must be chosen large enough to avoid interaction between magnetic moment localized around the defect and its periodic images in the neighboring cells. This convergence study is performed by checking that on-site energies tend to and that the spin density approaches zero near the border of the supercells. Although the spin density never truly vanishes near the border, its value can be neglected for the considered vacancy concentrations.
- (18) The CRYSTAL ab initio package has been employed using the Perdew-Burke-Ernzerhof (PBE) exchange-correlation functional. The adsorption geometry of a single H atom adsorbed on the supercell has been relaxed locally to obtain the typical configuration. For the C atoms, a valence basis set (,) has been used with the core electrons replaced by a pseudopotential. The STO-3G basis set was chosen to describe the orbital of the H atoms. The standard deviation of the total magnetic moment inside each supercell give similar results with both methods: , taking (see L. Pisani et al., Phys. Rev. B 75, 064418 (2007)), and .
- (19) F. Muñoz-Rojas, J. Fernàndez-Rossier, J.J. Palacios, Phys. Rev. Lett. 102, 136810 (2009).
- (20) S. Roche, Phys. Rev. B 59, 2284 (1999); H. Ishii et al., C. R. Physique 10, 283 (2009); N. Leconte et al., ACS Nano 4 (7), 4033 (2010).
- (21) T.O. Wehling et al., Phys. Rev. Lett. 105, 056802 (2010); M. Titov, P.M. Ostrovskyet al., Phys. Rev. Lett. 104, 076802 (2010); P.M. Ostrovsky, et al., Phys. Rev. Lett. 105, 266803 (2010).
- (22) P.M. Ostrovsky, I.V. Gornyi, A.D. Mirlin, Phys. Rev. B 74, 235443 (2006); K. Nomura and A.H. MacDonald, Phys. Rev. Lett. 98, 076602 (2007).