Deep Spitzer observations of infrared-faint radio sources: high-redshift radio-loud AGN?
Abstract
Infrared-faint radio sources (IFRSs) are a rare class of object which are relatively bright at radio wavelengths but very faint at infrared and optical wavelengths. Here we present sensitive near-infrared observations of a sample of these sources taken as part of the Spitzer Extragalactic Representative Volume Survey (SERVS). Nearly all the IFRSs are undetected at a level of Jy in these new deep observations, and even the detections are consistent with confusion with unrelated galaxies. A stacked image implies that the median flux density is Jy or less, giving extreme values of the radio-infrared flux density ratio. Comparison of these objects with known classes of object suggests that the majority are probably high-redshift radio-loud galaxies, possibly suffering from significant dust extinction.
1 Introduction
Infrared-faint radio sources (IFRSs) are a rare class of object which are relatively strong at radio wavelengths but very faint at infrared (IR) and optical wavelengths. They were first categorised in the Australia Telescope Large Area Survey (ATLAS: Norris et al., 2006) as radio sources with no observable IR counterpart in the co-spatial Spitzer Wide-area IR Extragalactic Survey (Lonsdale et al., 2004). Most have flux densities of a few hundred Jy at 20 cm, but some are as bright as 20 mJy. They may be related to the optically invisible radio sources found by Higdon et al. (2005, 2008), which are compact radio sources with no optical counterpart to , although the IFRSs seem even more extreme than the Higdon objects. Norris et al. (2006) and Middelberg et al. (2008a) have identified 51 such sources out of 2002 radio sources in the ATLAS survey.
So far, four samples of IFRS have been identified: (a) the original ATLAS/SWIRE samples identified by Norris et al. (2006) and Middelberg et al. (2008a), from which the sources in this paper are drawn, (b) the sample in the Spitzer First-Look Survey, identified by Garn & Alexander (2008), (c) the sample in ELAIS-N1 identified by Grant et al. (2011), (d) a sample in the COSMOS field (Scoville et al., 2007) identified by Zinn et al. (2011). These samples imply a sky density of of 7 per deg2 for mJy.
At the time of their discovery, the IFRS sources were unexpected, as SWIRE was thought to be deep enough to detect all extragalactic radio sources at z2, regardless of whether star formation or active galactic nuclei (AGN) powered the radio emission. Possible explanations were that these sources are i) high-redshift radio-loud AGN, ii) very obscured radio galaxies at more moderate redshifts (), iii) lobes of nearby but unidentified radio galaxies, iv) very obscured, luminous starburst galaxies, such as high-redshift submillimetre-selected galaxies (SMGs – Smail et al., 1997), v) high-latitude pulsars, or vi) an unknown type of object. Of course it is also possible that they do not constitute a homogeneous class and harbour examples of some or all of the above.
The nature of IFRSs has been hard to determine because nearly all the information on them has been obtained at radio wavelengths. Spectroscopy is difficult because the hosts are optically faint and the radio positions can also have uncertainties of the order of a few arcsec. Norris et al. (2006) stacked the positions of 22 IFRSs in the Spitzer 3.6 m IRAC images and found no detection in the averaged image, showing that they are well below the SWIRE detection threshold. This was a surprising result at the time, as it was expected that the IFRSs represented the tail of a distribution reaching just below the SWIRE detection threshold, but it was confirmed by Garn & Alexander (2008) and by the new data presented here.
Middelberg et al. (2008b) and Norris et al. (2007) targeted six IFRSs with the Australian Long Baseline Array (LBA) and detected two of the sources. The Norris et al. (2007) LBA detection constrained the source size to less than 0.03 arcsec, suggesting a compact radio core, powered by an AGN. Middelberg et al. (2008b) found the size and radio luminosity of their LBA-detected source to be consistent with a high-redshift () compact, steep-spectrum (CSS) source. The VLBI detections rule out the possibility that these particular IFRSs are simply the radio lobes of unidentified radio galaxies, or star-forming galaxies, though the initial VLBI targets were inevitably amongst the most radio-bright examples in the sample.
Garn & Alexander (2008) stacked IFRS sources in the Spitzer First Look Survey at infrared wavelengths, as well as at 610 MHz. The sources they find in the FLS are very similar to the sources described here. They find that the IFRS sources can be modelled as compact Fanaroff Riley type ii (FR ii) radio galaxies at high redshift (), and argue that IFRSs are predominately high-redshift radio-loud AGN.
Huynh et al. (2010) used deep data from the Spitzer IRAC MUSYC Public Legacy in E-CDFS (SIMPLE) project and the Far-Infrared Deep Extragalactic Legacy (FIDEL) Spitzer survey to probe more deeply in the E-CDFS region, and detected two of the four IFRSs in that region. However, the two non-detections, and the faintness of the two detected sources, enabled Huynh et al. to place constraints on the sources. Their detailed modelling of their spectral energy distributions shows that they are consistent with high-redshift () AGN. They also noted that the ratio of 20 cm flux density, , to 3.6 m flux density, , is higher than that of the general radio source population, and has significant overlap with the population of high-redshift radio galaxies (HzRG) investigated previously with Spitzer observations (Seymour et al. 2007) and is also consistent with the radio galaxy relation extended to high redshifts (Jarvis et al., 2001; De Breuck et al., 2002; Willott et al., 2003).
Middelberg et al. (2011) have measured the spectral indices of the radio emission at several wavelengths of a sample of 17 strong IFRSs and find that they are significantly different from the general radio source population, and also different from the general AGN population. The spectra are steep, typically with , and there is a particularly prominent lack of sources with (where ). Grant et al. (2011) also reported steep spectral indices, and both Middelberg et al. (2011) and Grant et al. (2011) found that several of the IFRSs were significantly polarised, suggesting an AGN rather than a star-forming galaxy.
Each of these papers adds to a consensus view that the IFRSs represent a class of high-redshift radio-loud galaxies. However, there is not yet unequivocal evidence for this, and it is possible that the IFRS class constitutes several different types of objects.
Here we present near-IR data taken as part of the Spitzer Extragalactic Representative Volume Survey (SERVS) project (Mauduit et al., 2011), which uses the data taken during the Spitzer warm mission to probe extended regions of the sky to a sensitivity some five times deeper than SWIRE. The SERVS project includes several square degrees around the ELAIS-S1 and CDFS extended fields in which IFRSs were detected as part of the ATLAS radio survey. These deeper data provide much tighter constraints on the nature of IFRSs.
Throughout this paper we assume a Hubble constant of , and matter and cosmological constant density parameters of and .
2 Observations and Analysis
The Australia Telescope Large Area Survey (ATLAS) radio survey is still in progress, covering 7 deg2 at 20 cm in two regions, surrounding the CDF-S and ELAIS-S1 fields to an r.m.s. depth of typically 10 Jy/beam. However, all the radio data used in this paper are taken from the preliminary ATLAS catalogues (Norris et al., 2006; Middelberg et al., 2008a) which surveyed the entire region to an r.m.s. depth of typically 20–30 Jy/beam.
SERVS (Mauduit et al., 2011) is a medium-deep survey at 3.6 m and 4.5 m which exploits the warm phase mission of Spitzer, to cover an 18 deg2 field, which includes most of the ATLAS fields.
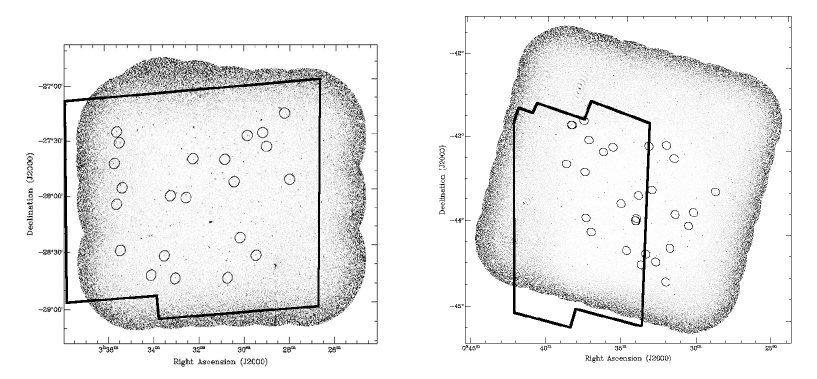
For the work described in this paper, we used SERVS data in the CDFS and ELAIS-S1 fields. Only band 1 (at 3.6 m) of the SERVS data was used because it is intrinsically more sensitive for most galaxy spectral energy distributions than the band 2 (4.5 m) data. Fig. 1 shows the IR and radio coverage of these fields. The SERVS data on the CDFS area covers nearly all of the area observed by SWIRE and ATLAS, but the ELAIS-S1 coverage is offset from the centre of the SWIRE/ATLAS field by about a degree. Nevertheless, a total of 39 IFRSs are common to both datasets, and are listed in Table 1.
For each IFRS source detected at radio wavelengths, we took the initial positional uncertainty (, in R.A. and Dec.) from the values listed by Norris et al. (2006) and Middelberg et al. (2008a), which were calculated from the quadrature sum of the formal fitting uncertainty and a 0.1 arcsec potential uncertainty in the position of the calibration source. We also consider the formal positional uncertainty due to noise , where is the synthesised full-width-half-maximum beamwidth, is the local r.m.s. flux density, and is the peak flux density of the source, as discussed by Ivison et al. (2007). We further considered any positional accuracy of less than 1 arcsec to be unrealistic because of systematic offsets and intrinsic source sizes. We derive a final 3 positional uncertainty in R.A. and Dec. as being the maximum of , , and 1 arcsec. These positional uncertainties are listed in Table 1.
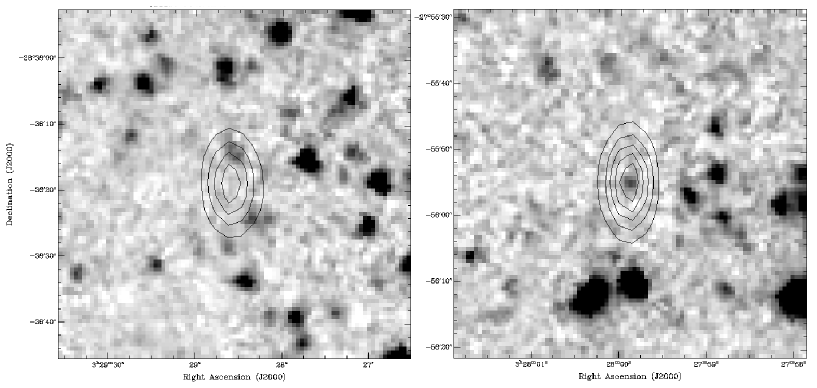
For each IFRS source, we examined the SERVS 3.6 m data for sources visible by eye as a distinct peak above the noise which fell within the error ellipse. Using this technique, we found that 3 of the 39 IFRS sources contained a 3.6 m candidate source within the 3 radio position error ellipse. Images of two representative IFRSs are shown in Fig. 2, with their associated error ellipse.
We then performed aperture photometry on each of these candidates. The flux density was measured using an aperture radius of 1.9 arcsec, which was found to be optimal in SWIRE. An aperture correction of 1.4 was applied for this radius (Surace et al., 2005). The uncertainty in the aperture flux density was estimated by measuring the r.m.s. of 100 randomly placed apertures placed near the source. The resulting flux densities are listed in Table 1.
The r.m.s. noise of the SERVS data, measured in a region of sky free from visible sources, can approach 0.2 Jy. However, since SERVS data are typically confusion limited, such an r.m.s. can be misleading if used to calculate uncertainties. Instead, we placed 1000 random apertures across the image, and followed an iterative approach, rejecting apertures with a flux density 2.5 and recalculating the r.m.s. until the process converged. The r.m.s. thus obtained was 0.51 Jy in the ELAIS-S1 field and 0.64 Jy in the CDF-S field.
As the SERVS data approach the confusion limit of Spitzer, it is necessary to estimate how many of the candidate cross-identifications are due to confusion. We estimated this in two independent ways.
Our most reliable estimate was obtained by shifting the IFRS radio positions by an arbitrary amount (typically 20 arcsec) which is much greater than the beamsize of either the radio or IR data, but much smaller than the scale size of variations in the image sampling. We then examined the image to estimate how many IR sources fall by chance within the error ellipse. This is a very robust way of estimating the confusion, as it builds in the varying error ellipse size, and the non-uniform sensitivity, using the real data rather than a parameterised representation. Because it uses real data, with exactly the same process in both cases, it is immune to calibration or other systematic errors.
We then repeated this process ten times, shifting the positions by a different amount (1 arcmin in all cases). A mean of 2.1 1.2 of the shifted error ellipses contained a peak in the Spitzer data. Thus, of our 3 candidate identifications with unshifted data, we expect that 2.1 of these are due to confusion, leaving only zero or one genuine detections.
As a check on this result, we use the source counts calculated by Barmby et al. (2008). Our radio position error ellipses have a total area of 266 arcsec2, and we have found three candidate identifications within this area, all of which are brighter than a flux density limit of Jy. . Barmby et al. (2008) calculate the density of sources with SJy as 205,000 deg-2, from which we estimate that we should detect 4 sources by chance. This is greater than the number detected in the shifted data, but the difference is clearly dominated by small number statistics. Nevertheless, the Barmby result does provide a useful rough cross-check on our shifting technique.
In summary, of our 39 IFRSs which lie within the SERVS fields, we find that only 3 of these have a source within the radio position error ellipse, none has a measured flux density greater than five times the formal fitting uncertainty, and our basic Monte Carlo simulations suggest that most or all of these detections are due to chance. We conclude that few or none of our sources have reliable detections and the vast majority of IFRSs are undetected at this level. Such faint emission from a source which is relatively strong at radio wavelengths represents an extreme condition which is not common in the local Universe.
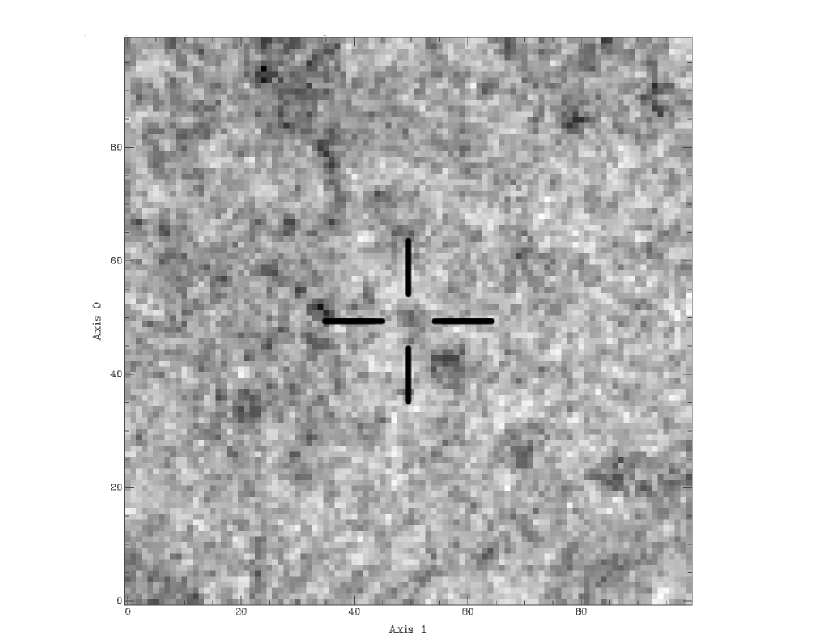
The distribution of IFRS can be explored to even deeper levels by stacking 3.6 m images at the IFRS positions. In Fig. 3, we show a median stacked image obtained by summing 39 3.6 m images extracted from the SERVS data, centered on the IFRS radio position. Because the stacking has reached the confusion limit for these data, the r.m.s. noise no longer scales as the square root of integration time, and so the r.m.s. of this stacked image is higher than would be obtained in an unconfused field, although it still offers a significant improvement over the individual images. We note that Garn & Alexander (2008) faced a similar challenge in stacking 3.6 m data from 8 IFRS in the First Look Survey, reaching a noise of approximately 1 Jy in the image stack.
The measured r.m.s. of the median stacked image is 0.14 Jy, and there is marginal evidence for a source at the field centre whose flux density was measured to be 0.21 0.14 Jy. Using a 3 upper limit, we conclude that the IFRSs have a median flux density of 0.63 Jy at 3.6 m.
3 Radio/IR properties of IFRSs
Since we have no redshift information for any of the IFRSs, we focus here on two derived quantities: the ratio of and , or its lower limit, and the flux density, or its upper limit.
Of the 39 IFRS which lie within the SERVS fields, we find that, after allowing for confusion, only 1 or 2 are detected and none has a measured flux density greater than five times the formal fitting uncertainty. The remaining sources are undetected at this level. From this we deduce that the vast majority of IFRSs have a ratio of to in the range 200–2,000.
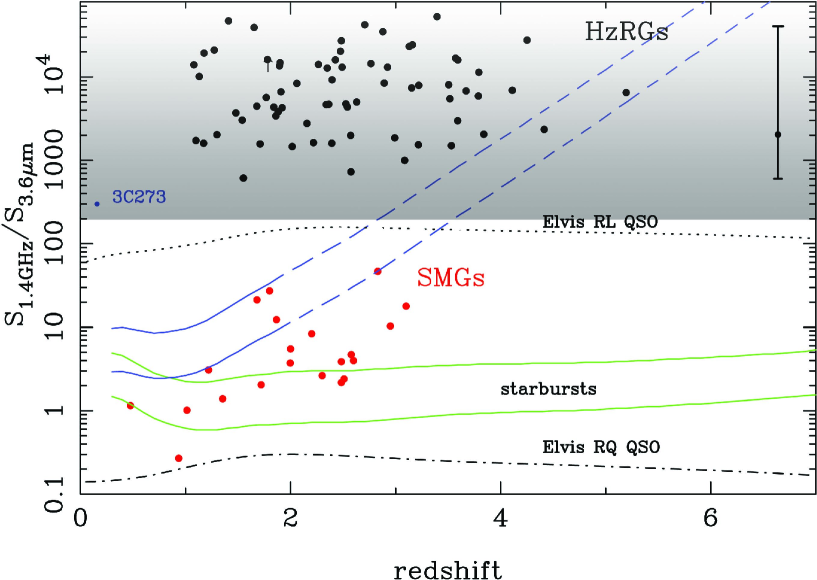
In Fig. 4 we show the ratios of to as a function of redshift for a representative selection of models, and mark the limits obtained in this paper. It is clear from this figure that the only objects known to have such a high ratio are radio-loud AGN, such as the high-redshift radio galaxies (HzRGs). In particular, we can rule out any known type of galaxy powered predominantly by star formation, such as ULIRGs, SMGs, etc., all of which fall well below the region occupied by IFRSs.
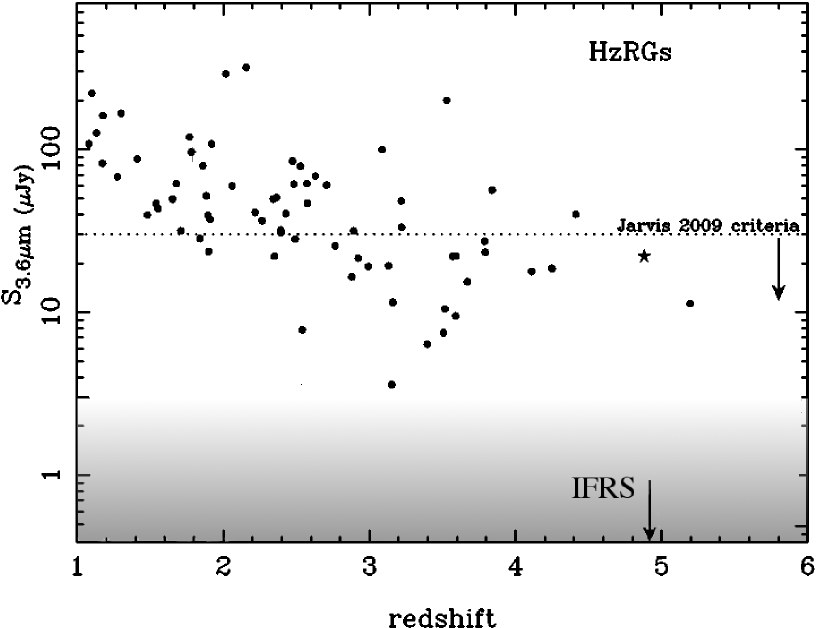
If they are radio galaxies similar to those in the low-redshift Universe, then we can use their brightness to obtain constraints on redshift. In Fig. 5. we show the of HzRGs as a function of redshift, together with the limits obtained from our SERVS observations. The HzRGs follow a relation between redshift and similar to the well-known - relation for other radio galaxies (Willott et al., 2003). Although we caution that both these relationships are unreliable above z3, they imply that if the IFRSs are radio galaxies, then their low 3.6 m flux densities constrain them to lie at high redshift.
4 What are IFRSs?
Whatever the nature of IFRSs, their properties are extreme, and not consistent with any of the well-recognised classes of object. Here we review the options for what this class of object is likely to be.
-
•
Star-forming galaxies. Fig. 4 shows that no known class of galaxy powered predominantly by star formation, such as ULIRGs, SMGs, etc., have ratios of 20 cm to 3.6 m flux densities comparable with those of IFRS. A star-forming galaxy might appear in the region if it suffered from an unusually high extinction, but no star-forming galaxy is known with such high extinction. Even Arp 220 has a / ratio a factor of 20 below the most moderate IFRS, and a factor of 4000 below the most extreme IFRS.
Such high extinction could in principle be found in a star-forming galaxy if it were at high redshift (), where the observed 3.6 m emission is generated in visible wavelengths in the galaxy rest-frame. However, no known star-forming galaxy generates sufficient radio power to reproduce the observed IFRS flux density. For example, Arp220 at z = 3 would have an observed flux of 5 Jy.
The observed 20 cm radio luminosities of the IFRSs range from (for the weakest IFRS at ) to at z=1 to (for the strongest IFRS at ). The most luminous star-forming galaxies, typified by SMGs at , can have luminosities (e.g. Ivison et al., 1998; Seymour et al., 2009), so that while the faintest of our galaxies could be caused by star-forming galaxies, most are too radio-luminous.
In addition, two of the six IFRSs observed with VLBI were detected by Norris et al. (2007) and Middelberg et al. (2008b). The VLBI detections rule out star formation in these particular galaxies as the radio emission mechanism, since the synchrotron emission from star-forming galaxies rarely has sufficient brightness temperature to be detectable with VLBI (e.g. Kewley et al., 2000; Biggs et al., 2010).
Furthermore, Middelberg et al. (2011) and Grant et al. (2011) show that the radio emission from several of the IFRSs studied by them is significantly polarised. This also argues against star formation, in which polarisation is generally much lower than in AGN.
We conclude that the majority of IFRSs are unlikely to represent star-forming galaxies.
-
•
Radio lobes An early hypothesis was that IFRSs might be the extended radio lobes of an AGN whose host may be located some distance away. The VLBI detections by Norris et al. (2007) and Middelberg et al. (2008b) imply that at least about a third of IFRSs have high brightness temperature cores, which rules out the possibility that they are radio lobes of AGN, since radio lobes do not have sufficient surface brightness to be detectable with these VLBI observations. Furthermore, most IFRS are unresolved in the high-resolution observations by Middelberg et al. (2011), making it unlikely that they are extended radio lobes.
-
•
Pulsars Cameron et al. (2011) tested the hypothesis that IFRSs may be pulsars, by performing a pulsar search on a sample of IFRSs. Their results show that any putative pulsars in the field have a pulsed flux density well below the observed flux density of the IFRS, and they conclude that the IFRS are not radio pulsars.
-
•
Radio-loud AGN The extreme values of the ratio of to reported in Fig. 4 are known to occur in radio-loud AGN, and have not been observed in any other type of extragalactic object. All the available observations (radio/IR flux densities, radio/IR ratio, VLBI, polarisation) are consistent with the cores of radio-loud AGN, and we conclude that radio-loud AGN are therefore a natural explanation of IFRS.
If IFRSs are caused by radio-loud AGN, their remaining unusual aspect is the extreme faintness at 3.6 m. We now consider three possible causes:
-
•
Dwarf galaxies that host a radio-loud AGN If a radio-loud AGN were to be hosted by a dwarf galaxy at moderate redshift, then the low luminosity of the host galaxy could reproduce both the faint 3.6 m flux density and the high to ratio of the IFRS. However, such objects are observationally unknown, and theoretically unlikely given the weak potential well of a dwarf galaxy.
-
•
Moderate-redshift radio-loud AGN with heavy dust extinction Fig. 5 shows that known moderate-redshift () AGN would be detected in our 3.6 m observations. We can postulate moderate-redshift objects which are heavily obscured at 3.6 m, but the amounts of extinction required are very high. For example, 3C 273 at would require an extinction of to occupy the position of IFRSs in Fig. 5. On the other at hand, at high redshift (), where the observed 3.6 m emission is generated in visible wavelengths in the galaxy rest-frame, as little as magnitudes of extinction is sufficient to raise the track of a radio-loud QSO into the regime of the IFRS.
However, even if the AGN is obscured by dust, it is hard to obscure the host galaxy to the low 3.6 m flux limits presented here. Even in Arp 220, where as much as 100 magnitudes of extinction obscure the nucleus (e.g. Haas et al., 2001), the outer shell of the host galaxy is still bright at IR wavelengths. To reproduce the extreme IR-faintness of the IFRS, the extinction must cover the entire body of the galaxy .
We therefore cannot exclude the possibility that the IFRSs could be a new class of galaxy at z 1–2, in which the entire galaxy must be shrouded in dust, reducing its integrated flux density by a factor of 100.
-
•
High-redshift radio-loud AGN Fig. 5 and the - relation show that, if IFRSs belong to a parent population similar to that of known radio-loud AGN, they must lie at . We note that obscured high-redshift radio galaxies and quasars have been detected by Martínez-Sansigre et al. (2006); Dey et al. (2008); Yan et al. (2007) and Sajina et al. (2007). While IFRSs bear some similarities to these galaxies, IFRSs are even more extreme in their to ratios. For example, Martínez-Sansigre et al. (2006) choose their sample by requiring that Jy, whilst the IFRSs have Jy. While none of the IFRSs are detected at 24 m, the available SWIRE data at 24 m are relatively insensitive compared to the 3.6 m SERVS data, and, given the very low , only a very extreme spectral energy distribution would enable them to be detected at 24 m.
We conclude that the most natural explanation for IFRSs is that they are very similar to known classes of radio-loud AGN, but at a redshift . In all these properties, the IFRS most resemble the HzRGs of Seymour et al. (2007), Ivison et al. (2008) and Jarvis et al. (2009), but with even more extreme 20 cm to 3.6 m flux density ratios. However, we cannot exclude the possibility that they are a new class of lower-redshift () radio-loud AGN in which the luminosity of the entire host galaxy is reduced by a factor of 100 by dust extinction.
The 20 cm flux densities of our IFRS range from 0.14 to 26 mJy. The weakest end of the range corresponds to a luminosity at to at , giving it the luminosity of an FR i galaxy at any reasonable redshift. On the other hand, the brightest end of the range corresponds to a luminosity at to at , making it a FR ii galaxy at any reasonable redshift. Thus the class of IFRS spans both the FR i and FR ii luminosity classes, with the majority of galaxies straddling the FR i/FR ii break, depending on their redshift.
It would be instructive to consider these results in terms of black hole mass, , but Snellen et al. (2003) have shown there is no good correlation between radio luminosity and black hole mass for radio-loud galaxies and so we cannot estimate a black hole mass except in the most general terms. But we do have good observational evidence for the 3.6 m flux densities of host galaxies of high-redshift radio galaxies, which is shown in Fig. 5.
We have detected 51 IFRS in the 7 deg2 area of ATLAS, implying a density of IFRSs on the sky of 7 per deg2 for mJy. It is difficult to make a meaningful comparison of the numbers of IFRSs with source counts at the present time without a better constraint on redshift. The SKADS simulation (Wilman et al., 2008) gives a sky density of 0.5 FR ii galaxies deg-2 at , implying that only 3–4 of the IFRSs discussed here are FR ii galaxies at . However, the space density of all but the highest-luminosity, FRII-type radio sources are very poorly constrained at high redshifts, and AGN models are very poorly constrained by current observations at the low flux densities probed here. Thus it is possible (Zinn et al., 2011) that the IFRS could be radio-loud AGN of moderate radio luminosity and much higher space density than their more powerful counterparts.
5 Conclusion
We have searched for IR counterparts to 39 IR-faint radio sources using deep 3.6 m observations from SERVS. Even though the sensitivity is 3–5 times better than the previous observations (with SWIRE), few or none of the IFRSs are detected after taking into account the number of chance associations, and a stacked image indicates a median 3.6 m flux density of 0.21 Jy. This places extreme constraints on the properties of these sources, making it likely that they are radio-loud AGN at redshifts , or heavily dust-obscured radio-loud AGN at redshifts . While some may have radio-to-IR ratios similar to 3C 273, but at a much higher redshift, the most extreme of them require several magnitudes of obscuration in the optical/NIR to remain undetected by deep imaging.
While we cannot rule out the possibility that more than one type of object may be represented by IFRSs, the evidence suggests that a significant proportion, if not all, of the IFRS sources are either
-
•
radio-loud AGN (similar to known high-redshift radio-loud AGN) at , or
-
•
a new class of lower-redshift () radio-loud AGN in which the luminosity of the entire host galaxy is severely reduced by dust extinction.
Acknowledgements
This work is based in part on observations made with Spitzer, which is operated by the Jet Propulsion Laboratory, California Institute of Technology under a contract with NASA. Support for this work was provided by NASA through an award issued by JPL/Caltech. This research has made use of the NASA/IPAC Extragalactic Database (NED) which is operated by the Jet Propulsion Laboratory, California Institute of Technology, under contract with the National Aeronautics and Space Administration. The Australia Telescope is funded by the Commonwealth of Australia for operation as a National Facility managed by CSIRO. JA gratefully acknowledges the support from the Science and Technology Foundation (FCT, Portugal) through the research grant PTDC/FIS/100170/2008. MYM acknowledges the support of an Australian Postgraduate Award as well as Postgraduate Scholarships from AAO and ATNF.
We thank P. Barmby for providing unpublished details of her source density calculations, Barnaby Norris for generating the stacked median image, and George Hobbs for helpful comments on the pulsar density at high galactic latitude.
| ID | Long name | err(RA) | err(dec) | S(20 cm) | S(3.6 m) | notes |
|---|---|---|---|---|---|---|
| (arcsec) | (arcsec) | (mJy) | (Jy) | |||
| ES0011 | ATELAIS J003207.44-443957.8 | 1.21 | 1.00 | 1.67 | out | |
| ES0056 | ATELAIS J003346.75-442902.8 | 1.00 | 1.17 | 0.58 | ||
| ES0079 | ATELAIS J003248.60-442625.7 | 1.18 | 1.22 | 0.31 | out | |
| ES0135 | ATELAIS J003330.12-442115.4 | 1.59 | 1.55 | 0.18 | ||
| ES0190 | ATELAIS J003155.15-441610.4 | 1.38 | 1.79 | 0.27 | out | |
| ES0318 | ATELAIS J003705.54-440733.6 | 1.00 | 1.12 | 1.59 | ||
| ES0407 | ATELAIS J003045.75-435926.3 | 1.00 | 1.00 | 0.65 | out | |
| ES0427 | ATELAIS J003411.59-435817.0 | 1.00 | 1.00 | 21.36 | . | VLBI source - see Middelberg et al. 2008b. |
| ES0433 | ATELAIS J003413.43-435802.4 | 1.00 | 1.00 | 0.25 | ||
| ES0436 | ATELAIS J003726.34-435733.0 | 1.07 | 1.53 | 0.19 | . | |
| ES0463 | ATELAIS J003410.14-435625.5 | 1.23 | 1.75 | 0.14 | ||
| ES0509 | ATELAIS J003138.63-435220.8 | 1.00 | 1.00 | 22.20 | out | polarised source - see Middelberg et al. 2010 |
| ES0548 | ATELAIS J003027.04-434948.3 | 1.14 | 1.62 | 0.31 | out | |
| ES0593 | ATELAIS J003510.80-434637.2 | 1.20 | 1.72 | 0.17 | . | |
| ES0696 | ATELAIS J003402.26-434008.5 | 1.00 | 1.00 | 0.49 | . | |
| ES0743 | ATELAIS J003311.40-433547.3 | 1.06 | 1.51 | 0.16 | out | |
| ES0749 | ATELAIS J002905.22-433403.9 | 1.00 | 1.00 | 7.01 | out | |
| ES0913 | ATELAIS J003733.42-432453.4 | 1.00 | 1.00 | 0.68 | ||
| ES0973 | ATELAIS J003844.13-431920.4 | 1.30 | 1.43 | 9.14 | polarised source - see Middelberg et al. 2010 | |
| ES1056 | ATELAIS J003446.40-441926.9 | 1.00 | 1.40 | 0.37 | ||
| ES1083 | ATELAIS J003150.17-431235.2 | 1.00 | 1.35 | 0.22 | out | |
| ES1118 | ATELAIS J003622.25-431015.0 | 1.04 | 1.49 | 0.51 | ||
| ES1154 | ATELAIS J003546.92-430632.4 | 1.00 | 1.08 | 0.53 | . | |
| ES1170 | ATELAIS J003327.96-430439.8 | 1.00 | 1.26 | 0.42 | out | |
| ES1180 | ATELAIS J003219.77-430315.6 | 1.00 | 1.00 | 0.50 | out | |
| ES1193 | ATELAIS J003719.58-430201.4 | 1.05 | 1.51 | 0.23 | ||
| ES1259 | ATELAIS J003827.17-425133.7 | 1.00 | 1.00 | 4.52 | ||
| ES1260 | ATELAIS J003824.94-425137.9 | 1.30 | 1.85 | 0.80 | ||
| ES1275 | ATELAIS J003739.09-424814.0 | 1.33 | 1.90 | 0.46 | out | |
| CS0114 | ATCDFS J032759.89-275554.7 | 1.00 | 1.00 | 7.17 | 2.2 0.54 | VLBI source - see Norris et al. 2007. |
| CS0122 | ATCDFS J032812.99-271942.6 | 1.41 | 3.58 | 0.46 | ||
| CS0164 | ATCDFS J032900.20-273745.7 | 1.00 | 1.24 | 1.21 | ||
| CS0173 | ATCDFS J032909.66-273013.7 | 1.41 | 3.76 | 0.35 | 2.14 0.65 | |
| CS0194 | ATCDFS J032928.59-283618.8 | 1.00 | 1.00 | 6.09 | ||
| CS0215 | ATCDFS J032950.01-273152.6 | 1.00 | 1.00 | 1.10 | ||
| CS0241 | ATCDFS J033010.21-282653.0 | 1.00 | 1.53 | 1.28 | ||
| CS0255 | ATCDFS J033024.08-275658.7 | 1.18 | 3.16 | 0.55 | 1.91 0.53 | |
| CS0275 | ATCDFS J033043.69-284755.6 | 1.38 | 1.82 | 0.36 | ||
| CS0283 | ATCDFS J033048.68-274445.3 | 1.15 | 2.03 | 0.29 | not detected by Huynh et al. 2010 | |
| CS0415 | ATCDFS J033213.07-274351.0 | 1.00 | 1.00 | 1.21 | not detected by Huynh et al. 2010 | |
| CS0446 | ATCDFS J033231.54-280433.5 | 2.21 | 3.64 | 0.34 | detected by Huynh et al. 2010 | |
| CS0487 | ATCDFS J033301.19-284720.7 | 1.00 | 1.59 | 1.12 | Maybe not an IFRS - see Middelberg et al. 2010 | |
| CS0506 | ATCDFS J033311.48-280319.0 | 1.56 | 2.36 | 0.17 | detected by Huynh et al. 2010 | |
| CS0538 | ATCDFS J033330.20-283511.1 | 1.44 | 2.57 | 1.40 | ||
| CS0588 | ATCDFS J033404.70-284501.7 | 1.28 | 3.31 | 0.45 | ||
| CS0682 | ATCDFS J033518.48-275742.2 | 1.18 | 2.87 | 0.34 | ||
| CS0694 | ATCDFS J033525.08-273313.2 | 1.00 | 1.39 | 0.60 | ||
| CS0696 | ATCDFS J033525.25-283105.2 | 1.00 | 1.77 | 0.31 | ||
| CS0703 | ATCDFS J033531.02-272702.2 | 1.00 | 1.00 | 26.08 | polarised source - see Middelberg et al. 2010 | |
| CS0706 | ATCDFS J033533.22-280621.8 | 1.05 | 1.50 | 0.26 | ||
| CS0714 | ATCDFS J033538.16-274400.6 | 1.44 | 2.21 | 0.39 |
References
- Barmby et al. (2008) Barmby, P., Huang, J.-S., Ashby, M. L. N., Eisenhardt, P. R. M., Fazio, G. G., Willner, S. P. & Wright, E. L., 2008, ApJS, 177, 431,
- Biggs et al. (2010) Biggs, A. D., Younger, J. D., & Ivison, R. J., 2010, MNRAS, submitted (arXiv:1004.0009)
- Burgay et al. (2006) Burgay, M.; Joshi, B. C.; D’Amico, N.; Possenti, A.; Lyne, A. G.; Manchester, R. N.; McLaughlin, M. A.; Kramer, M.; Camilo, F.; Freire, P. C. C., 2006, MNRAS, 368, 283
- Cameron et al. (2011) Cameron, A. D., Keith, M., Hobbs, G., Norris, R. P., Mao, M.Y., & Middelberg, E., 2011, MNRAS, in press.
- De Breuck et al. (2002) De Breuck, C., van Breugel, W., Stanford, S. A., Röttgering, H., Miley, G., & Stern, D. 2002, AJ, 123, 637
- Dey et al. (2008) Dey, A., et al. 2008, ApJ, 677, 943
- Garn & Alexander (2008) Garn, T., & Alexander, P. 2008, MNRAS, 391, 1000
- Grant et al. (2011) Grant, J.K., George, S. J., Taylor, A. R., Stil, J. M., Kothes, R., & Scott, D., 2011, ApJ, in press.
- Haas et al. (2001) Haas, M., Klaas, U., Müller, S. A. H., Chini, R., & Coulson, I. 2001, A&A, 367, L9
- Higdon et al. (2005) Higdon, J. L., et al. 2005, ApJ, 626, 58
- Higdon et al. (2008) Higdon, J. L., Higdon, S. J. U., Willner, S. P., Brown, M. J. I., Stern, D., Le Floc’h, E., & Eisenhardt, P. 2008, ApJ, 688, 885
- Huynh et al. (2010) Huynh, M. T., Norris, R. P., & Middelberg, M., 2010, ApJ, 710, 698
- Ivison et al. (1998) Ivison, R. J. , et al. 1998, MNRAS, 298, 583
- Ivison et al. (2007) Ivison, R. J. , et al. 2007, MNRAS, 380, 199
- Ivison et al. (2008) Ivison, R. J. , et al. 2008, MNRAS, 390, 1117
- Jarvis et al. (2001) Jarvis, M. J., Rawlings, S., Eales, S., Blundell, K. M., Bunker, A. J., Croft, S., McLure, R. J., & Willott, C. J. 2001, MNRAS, 326, 1585
- Jarvis et al. (2009) Jarvis, M. J., Teimourian, H., Simpson, C., Smith, D. J. B., Rawlings, S., & Bonfield, D. 2009, MNRAS, 398, L83
- Kewley et al. (2000) Kewley, L. J., Heisler, C. A., Dopita, M. A., Sutherland, R., Norris, R. P., Reynolds, J. & Lumsden, S., 2000, ApJ, 530, 704
- Lonsdale et al. (2004) Lonsdale, C., et al. 2004, ApJS, 154, 54
- Magorrian et al. (1998) Magorrian, J., et al. 1998, AJ, 115, 2285
- Manchester et al. (2005) Manchester, R. N., Hobbs, G. B., Teoh, A., & Hobbs, M. 2005, AJ, 129, 1993
- Martínez-Sansigre et al. (2006) Martínez-Sansigre, A., Rawlings, S., Lacy, M., Fadda, D., Jarvis, M. J., Marleau, F. R., Simpson, C., & Willott, C. J. 2006, MNRAS, 370, 1479
- Martínez-Sansigre et al. (2007) Martínez-Sansigre, A., et al. 2007, MNRAS, 379, L6
- Mauduit et al. (2011) Mauduit, M., et al. 2011, ApJ, submitted.
- Middelberg et al. (2008a) Middelberg, E., et al. 2008a, AJ, 135, 1276
- Middelberg et al. (2008b) Middelberg, E., Norris, R. P., Tingay, S., Mao, M. Y., Phillips, C. J., & Hotan, A. W. 2008b, A&A, 491, 435
- Middelberg et al. (2011) Middelberg, E., Norris, R. P., Hales, C. A., Seymour, N., Johnston-Hollitt, M., Huynh, M. T., Lenc, E., & Mao, M. Y. 2011, A&A, 526, A8
- Norris et al. (2006) Norris, R. P., et al. 2006, AJ, 132, 2409
- Norris et al. (2007) Norris, R. P., Tingay, S., Phillips, C., Middelberg, E., Deller, A., & Appleton, P. N. 2007, MNRAS, 378, 1434
- Sajina et al. (2007) Sajina, A., Yan, L., Lacy, M., & Huynh, M. 2007, ApJ, 667, L17
- Scoville et al. (2007) Scoville, N., et al. 2007, ApJS, 172, 1
- Seymour et al. (2007) Seymour, N., et al. 2007, ApJS, 171, 353
- Seymour et al. (2009) Seymour, N., Huynh, M., Dwelly, T., Symeonidis, M., Hopkins, A., McHardy, I. M., Page, M. J., & Rieke, G. 2009, MNRAS, 398, 1573
- Surace et al. (2005) Surace, J., et al. 2005, SWIRE Data Delivery Document, NASA-IPAC.
- Snellen et al. (2003) Snellen, I. A. G., Lehnert, M. D., Bremer, M. N., & Schilizzi, R. T. 2003, MNRAS, 342, 889
- Smail et al. (1997) Smail, I., Ivison, R. J., & Blain, A.W. 1997, ApJ, 490, L5
- Vigotti et al. (2003) Vigotti, M., Carballo, R., Benn, C. R., De Zotti, G., Fanti, R., Gonzalez Serrano, J. I., Mack, K.-H., & Holt, J. 2003, ApJ, 591, 43
- Willott et al. (2003) Willott, C. J., Rawlings, S., Jarvis, M. J., & Blundell, K. M. 2003, MNRAS, 339, 173
- Wilman et al. (2008) Wilman, R. J., et al. 2008, MNRAS, 388, 1335
- Yan et al. (2007) Yan, L., et al. 2007, ApJ, 658, 778
- Zinn et al. (2011) Zinn, P.-C., Middelberg, E., & Ibar, E., 2011, A&A, in press.