TWO DISTINCT RED GIANT BRANCHES IN THE GLOBULAR CLUSTER NGC 288
Abstract
We report the presence of two distinct red giant branches (RGBs) in the globular cluster NGC 288 from the narrow-band calcium and Strömgren & photometry obtained at the CTIO 4m Blanco telescope. The RGB of NGC 288 is clearly split into two in the [=] index, while the split is not shown in the color. Unlike other globular clusters with multiple populations reported thus far, the horizontal branch of NGC 288 is only mildly extended. Our stellar population models show that this and the presence of two distinct RGBs in NGC 288 can be reproduced if slightly metal-rich ( 0.16) second generation stars are also enhanced in helium by small amount ( 0.03) and younger by 1.5 Gyrs. The RGB split in index is most likely indicating that the second generation stars were affected by supernovae enrichment, together with the pollutions of lighter elements by intermediate-mass asymptotic giant branch stars or fast-rotating massive stars. In order to confirm this, however, spectroscopy of stars in the two distinct RGB groups is urgently required.
1 INTRODUCTION
Unlike the conventional wisdom, observations made during the past decade have revealed that many globular clusters (GCs) are possessing more than one stellar population. Some of these peculiar GCs, such as Cen (Lee et al., 1999; Bedin et al., 2004), M54 (Layden & Sarajedini, 1997; Siegel et al., 2007), M22 (Da Costa et al., 2009; Lee et al., 2009a; Marino et al., 2009), NGC 1851 (Han et al., 2009; Lee et al., 2009b; Carretta et al., 2010), Terzan 5 (Ferraro et al., 2009), and NGC 2419 (Cohen et al., 2010; Di Criscienzo et al., 2011) show evidences of supernovae (SNe) enrichment, indicating that they are relics of more massive primeval dwarf galaxies, rather than being normal GCs. For other GCs with multiple populations, such as NGC 2808 (Piotto et al., 2007), NGC 6388 (Moretti et al., 2009), and M4 (Marino et al., 2008), however, the evidence for the discrete distribution of heavy elements as observed in the RGB of Cen is lacking, although spreads in some lighter elements (Carretta et al., 2009, and references therein) and helium (D’Antona et al., 2005; Lee et al., 2005; Piotto et al., 2007; Yoon et al., 2008) are reported. Therefore, the presence of chemical inhomogeneity and multiple populations in these GCs is largely considered due to the pollution from the intermediate-mass asymptotic giant branch (AGB) stars and (or) fast-rotating massive stars (Ventura & D’Antona, 2008; Decressin et al., 2007), which is expected even in normal GCs.
Because of their important implications on the hierarchical merging paradigm of Galaxy formation, search for more GCs with dwarf galaxy origin (i.e., with evidence of SNe enrichment) would be extremely important. The purpose of this Letter is to report that NGC 288 is also showing a clear split in the RGB from the narrow-band calcium photometry. This observation is compared with our stellar population models to argue that the two populatons are different in terms of overall metallicity, helium, and age by small amounts.
2 OBSERVATIONS AND COLOR-MAGNITUDE DIAGRAMS
Our observations in , , and passbands were performed using the CTIO 4m Blanco telescope on 2009 July 27. The telescope was equipped with eight 20484096 SITe CCDs, providing a plate scale of 0.27 arcsec pixel-1 and a field-of-view of 3636 arcmin on the sky. However, since the 44 inch filters used in our photometry can not cover the entire field, only four CCD chips located in central region (i.e., chip 2, 3, 6, and 7) covering 20482500 pixels per chip were used in the final photometry. The total exposure times for , Strömgren , and were 1650, 264, and 132 seconds, respectively, split into short and long exposures in each band. NGC 288 was placed on chip 6, approximately 3.0 arcmin South and 3.1 arcmin East from the CCD center. The IRAF111IRAF is distributed by the National Optical Astronomy Observatories, which are operated by the Association of Universities for Research in Astronomy, Inc., under cooperative agreement with the National Science Foundation. MSCRED Package was used for preprocessing including bias correction and flat fielding. The brightnesses of objects in NGC 288 were measured with the point-spread function (PSF) fitting routine DAOPHOT II and ALLFRAME (Stetson, 1987, 1994), and aperture corrections were calculated using the DAOGROW (Stetson, 1990). Our photometry in , , and passbands were then used to calculate the index defined by Anthony-Twarog et al. (1991). The filter in the index is meant to measure essentially ionized calcium H and K lines, and the index is known to be about three times more sensitive to metallicity than index is (Twarog & Anthony-Twarog, 1995). The same filter set employed in this observation was extensively used by us in our previous investigations of GCs (Rey et al., 2000, 2004; Lee et al., 2009a, b).
Figure 1 shows color-magnitude diagrams (CMDs) of NGC 288 in (, ) and (, ) planes. To examine the CMD features more clearly, magnitude error, chi, sharpness and separation index (Stetson et al., 2003) were used to reject stars with large photometric uncertainty and those affected by blending and adjacent starlight contamination. All stars in the Figure 1 lie within the chip 6, and therefore our CMDs are not subject to any uncertainty stemming from the possible chip to chip variations of the mosaic CCDs. The most remarkable feature of Figure 1 is the presence of two distinct RGBs in the vs. CMD. When measured at mag, the mean separation between the two RGBs is about 0.10 mag in index. The discrete distribution shown in RGB, however, is not apparent in the subgiant branch (SGB). Note also that the RGB split is not shown in (, ) CMD. This is most likely because the filter in the index is much more sensitive to changes in abundance than other color indices like .
Given the small foreground reddening value of = 0.03 (Harris, 1996) toward NGC 288, it is very unlikely that the differential reddening has caused the double RGBs. Furthermore, in contrast to other color indices, the index is known to be insensitive to interstellar reddeing, = 0.12 and = 0.16 (Anthony-Twarog et al., 1991). Therefore, if we adopt the reddening of = 0.03, = 0.0036 is obtained for NGC 288, which is negligible compared to the separation in index ( 0.10 mag) between the two RGBs. Star counts of two subpopulations indicate that the bluer RGB population (“Pop-1”) takes about 60% of the whole population, while the redder RGB population (“Pop-2”) comprises about 40% of total population, in the magnitude interval mag. This ratio is not sensitive to the adopted separation index in our photometry.
3 COMPARISON WITH STELLAR POPULATION MODELS
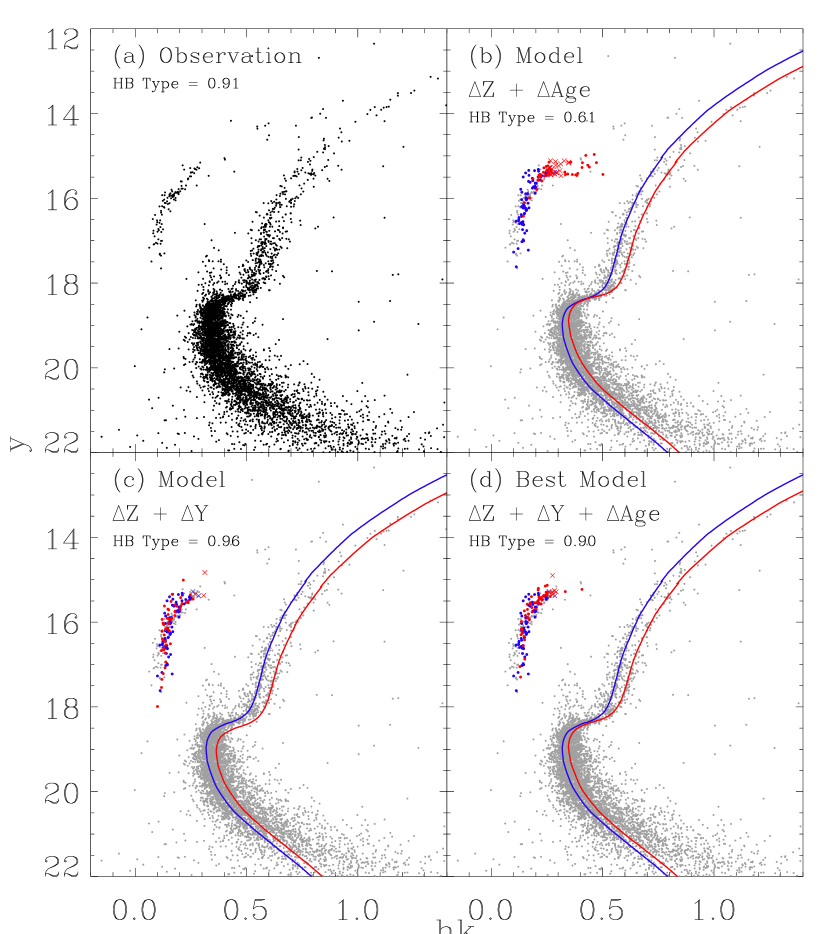
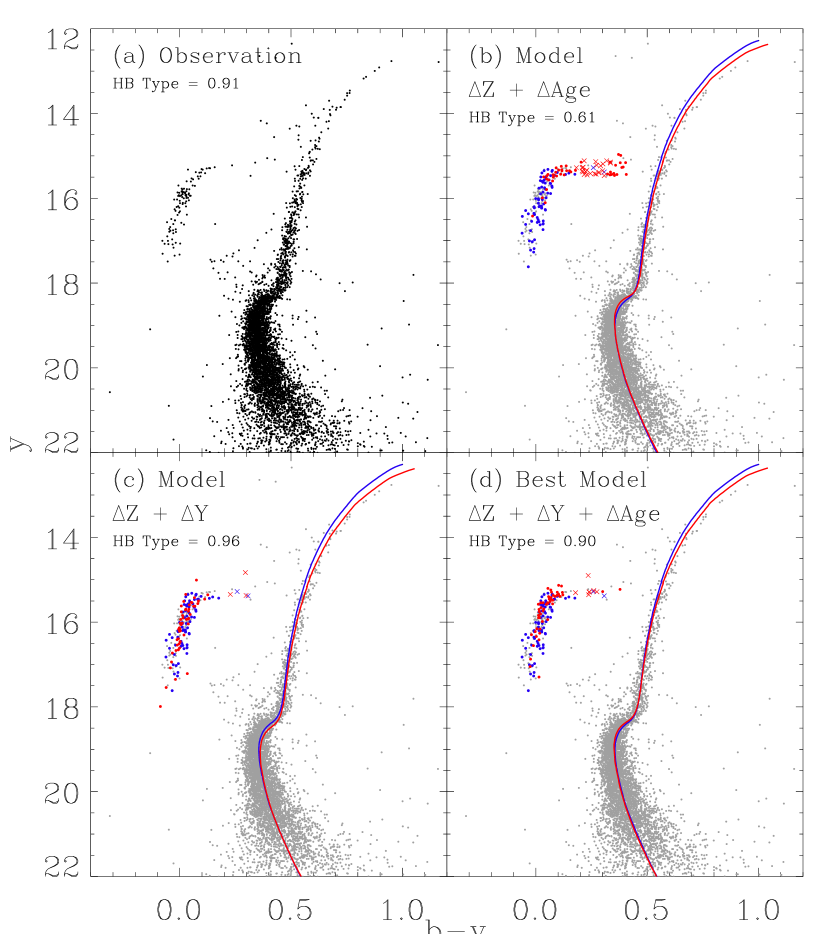
In order to better understand the origin of the RGB split in index, and to place constraints on the chemical combinations of two subpopulations, we have constructed stellar population models based on the latest version of the Yonsei-Yale (Y2) isochrones (Yi et al., 2008) and HB evolutionary tracks (S.-I. Han et al. 2011, in preparation). Readers are referred to Lee et al. (1990, 1994) and Yoon et al. (2008) for the details of our model construction. Figures 2 and 3 present our synthetic CMDs for NGC 288 in (, ) and (, ) planes, respectively. Our models were constructed under three different assumptions regarding the chemical enrichment and age spread in NGC 288. First, we assumed that the second generation population (Pop-2; redder RGB) is more enhanced in metallicity and younger ( 0.16 dex, 1.5 Gyr), but not enhanced in helium abundance [hereafter Z+Age model; panel (b) in Figures 2 and 3]. These models match well with the observed CMDs from the MS through the RGB in (, ) and (, ) planes. Yet, the models fail to reproduce the HB, as the synthetic HBs are too extended in color including significant numbers of RR Lyraes and red HB stars (HB type222The HB type is the quantity, (BR)(BVR), where B, V, and R are the numbers of blue HB, RR Lyrae variable, and red HB stars, respectively (Lee et al., 1994). = 0.61), while the observed HB is only mildly extended with mostly blue HB stars (HB type = 0.91). This is because both metal enhancement and younger age in second population move the HB to red in CMD (see Lee et al., 1994). Second, we then assumed that both metal and helium abundances are enhanced ( 0.16 dex, 0.03 dex), but age is constant [hereafter Z+Y model; panel (c) in Figures 2 and 3]. These models match well with the observed CMDs from the RGB through the HB in (, ) and (, ) planes. However, they can not reproduce the narrow SGB in (, ) CMD. Therefore, both Z+Age and Z+Y models are in conflict with the observed CMDs of NGC 288.
Finally, we assumed that not only metal and helium abundances are enhanced, but also age is younger in Pop-2 [hereafter Z+Y+Age model; panel (d) in Figures 2 and 3]. These models are in good agreements with the observations from the MS to the HB. The enhanced metal abundance in Pop-2 makes the RGB split in index as observed, while the younger age can explain the narrow and apparently single SGB in (, ) CMD. The increase in helium abundance in Pop-2 moves HB bluer (see Lee et al., 2005), almost cancelling out the effects by enhanced metallicity and younger age, making the blue HB only mildly extended with the HB type similar to the observed value (HB type = 0.90). Note that, in our HB simulations, we employ the standard Reimers (1977) mass-loss law and the same mass-loss parameter for the two subpopulations. Input parameters adopted in our best models (i.e., Z+Y+Age model) are listed in Table 1. Our models are computed with the same abundance of [CNONa/Fe] for both Pop-1 and Pop-2. More detailed models including the possible difference in [CNONa/Fe] between the two subpopulations would change the age estimates (see, e.g., Cassisi et al., 2008).
4 DISCUSSION
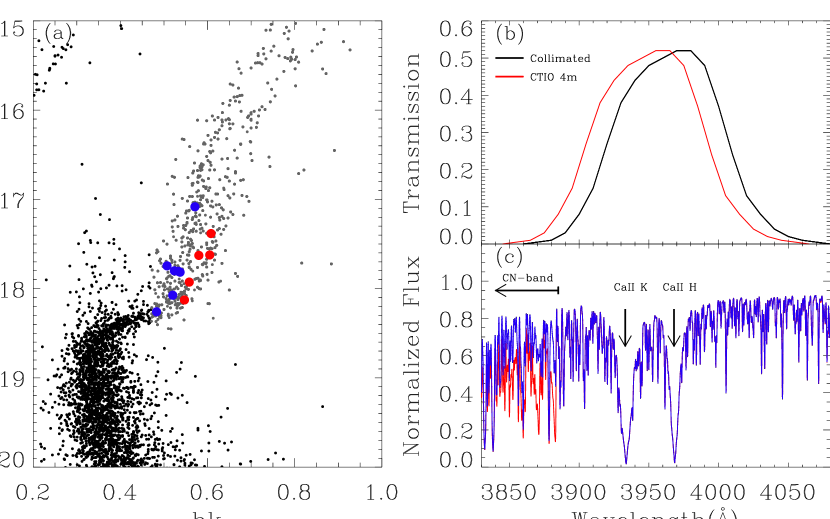
We have shown that the RGB of NGC 288 is split into two distinct sequences. While this is most likely the effect of Ca II H & K lines, it is important to check whether the CN band at 3870 Å could affect the index due to the proximity of the CN band to the blue tail of filter transmission curve. In particular, according to Kayser et al. (2008), lower RGB stars in NGC 288 exhibit CN bimordality that spans about 0.6 dex. In Figure 4a, we have matched their spectroscopic data with our photometry, where we can see that “CN-stong” stars lie well on the redder RGB sequence, whereas “CN-weak” stars are on the bluer RGB. This further suggests that possible contamination of CN band to index should be investigated in more detail. It is known that the passband of the narrow band interference filter, such as the filter employed in our photometry, depends on the angle of incidence beam (see Clarke et al., 1975; Lee et al., 2009a). This issue is therefore more relevant when the filter is used with a relatively fast telescope like the prime focus of the CTIO 4m telescope, where the central wavelength drift of the filter is estimated to be about 15 Å to the shorter wavelength333http://www.ctio.noao.edu/instruments/filters/filters_66.html (see Figure 4b).
In order to see the influence of CN band on the index in our photometry, we have calculated synthetic spectra using the ATLAS 9 model atmosphere (Castelli & Kurucz, 2003) for the RGB star at the magnitude level of HB with = K, (in cgs unit), = km/s, and [Fe/H] = (see Lee et al. 2009a Supplementary Information for detail). The typical RGB stars in GCs show an anticorrelation between CN band and CH band strengths and a correlation between CN band and NH band strengths, indicating that the nitrogen controls the CN band strength (Briley & Smith, 1993). Therefore, we have compared the synthetic spectra between the stars with normal and enhanced nitrogen abundances (see Figure 4c). We obtain 0.006 for [N/Fe] = 1.0 dex, which suggests that the influence of CN band on the index would be negligible in our photometry444If we have assumed the wavelength drift of 20 Å, a similarly small value of ( 0.009) is obtained, confirming that this result is not very sensitive to the uncertainty in the value of the wavelength drift.. Recently, Sbordone et al. (2011) also reached at a similar conclusion, finding that CNONa anticorrelations have an effect of at most 0.04 mag in the color at fixed . Their calculations include not only the direct effects of CN and other absorption bands (NH & CH), but also the effects on the continuum levels in the , , and filters.
If the CNONa abundances have only little effects on the index as discussed above, which should be confirmed in the forthcoming works, the RGB split discovered in our vs. CMD would indicate a small difference in abundance between the two subpopulations. Since calcium and other heavy elements can only be supplied through SNe explosions, this in turn would suggest that the second generation stars were affected by SNe enrichment, together with the pollutions of lighter elements (such as the enhancenment of N and the depletion of O) by intermediate-mass asymptotic giant branch stars or fast-rotating massive stars. Spectroscopy of stars in the two distinct RGB sequences is crucial to confirm the small difference in the abundance of heavier elements suggested in our photometry.
References
- Anthony-Twarog et al. (1991) Anthony-Twarog, B. J., Twarog, B. A., Heim, E. A., & Caldwell, N. 1991, AJ, 101, 1902
- Bedin et al. (2004) Bedin, L. R., Piotto, G., Anderson, J., Cassisi, S., King, I. R., Momany, Y., & Carraro, G. 2004, ApJ, 605, L125
- Briley & Smith (1993) Briley, M. M., & Smith, G. H. 1993, PASP, 105, 1260
- Carretta et al. (2009) Carretta, E., Bragaglia, A., Gratton, R. G., D’Orazi, V., & Lucatello, S. 2009, A&A, 508, 695
- Carretta et al. (2010) Carretta, E., et al. 2010, ApJ, 722, L1
- Cassisi et al. (2008) Cassisi, S., Salaris, M., Pietrinferni, A., Piotto, G., Milone, A. P., Bedin, L. R., & Anderson, J. 2008, ApJ, 672, L115
- Castelli & Kurucz (2003) Castelli, F., & Kurucz, R. L. 2003, in IAU Symp. 210, Modelling of Stellar Atmospheres, ed. N. Piskunov, W. W. Weiss, & D. F. Gray (San Franscisco: ASP), 20
- Clarke et al. (1975) Clake, D., McLean, I. S., & Wyllie, T. H. A. 1975, ApJ, 43, 215
- Cohen et al. (2010) Cohen, J. G., Kirby, E. N., Simon, J. D., & Geha, M. 2010, ApJ, 725, 288
- Da Costa et al. (2009) Da Costa, G. S., Held, E. V., Saviane, I., & Gullieuszik, M. 2009, ApJ, 705, 1481
- D’Antona et al. (2005) D’Antona, F., Bellazzini, M., Caloi, V., Pecci, F. F., Galleti, S., & Rood, R. T. 2005, ApJ, 631, 868
- Decressin et al. (2007) Decressin, T., Meynet, G., Charbonnel, C., Prantzos, N., & Ekström, S. 2007, A&A, 464,1029
- Di Criscienzo et al. (2011) Di Criscienzo, M., D’Antona, F., Milone, A. P., Ventura, P., Caloi, V., Carini, R., D’Ercole, A., Vesperini, E., & Piotto, G. 2011, arXiv:astro-ph/1103.0867
- Ferraro et al. (2009) Ferraro, F. R., et al. 2009, Nature, 462,483
- Han et al. (2009) Han, S.-I., Lee, Y.-W., Joo. S.-J., Sohn, S. T., Yoon, S.-J., Kim, H.-S., & Lee, J.-W. 2009, ApJ, 707, L190
- Harris (1996) Harris, W. E. 1996, AJ, 112, 1487 (updated in 2010 available on http://physwww.physics.mcmaster.ca/harris/mwgc.dat)
- Kayser et al. (2008) Kayser, A., Hilker, M.,Grebel, E. K., & Willemsen, P. G. 2008, A&A, 486, 437
- Layden & Sarajedini (1997) Layden, A. C., & Sarajedini, A. 1997, AJ, 486, L107
- Lee et al. (2009a) Lee, J.-W., Kang, Y.-W., Lee, J., & Lee, Y.-W. 2009a, Nature, 462, 48
- Lee et al. (2009b) Lee, J.-W., Lee, J., Kang, Y.-W., Lee, Y.-W., Han, S. -I., Joo, S.-J., Rey, S.-C., & Yong, D. 2009b, ApJ, 695, 78
- Lee et al. (1990) Lee, Y.-W., Demarque, P., & Zinn, R. 1990, ApJ, 350, 155
- Lee et al. (1994) Lee, Y.-W., Demarque, P., & Zinn, R. 1994, ApJ, 423, 248
- Lee et al. (1999) Lee, Y.-W., Joo, J.-M., Sohn, Y.-J., Rey, S.-C., Lee, H. -C., & Walker, A. R. 1999, Nature, 402, 55L
- Lee et al. (2005) Lee, Y.-W., et al. 2005, ApJ, 621, L57
- Marino et al. (2008) Marino, A. F., Vilanova, S., Piotto, G., Milone, A. P., Momany, Y., Bedin, L. R., & Medling, A. M. 2008, A&A, 490, 625
- Marino et al. (2009) Marino, A. F., Milone, A. P., Piotto, G., Vilanova, S., Bedin, L. R., Bellini, A., & Renzini, A. 2009, A&A, 505, 1099
- Moretti et al. (2009) Moretti. A., et al. 2009, A&A, 493, 539
- Piotto et al. (2007) Piotto, G., Bedin, L. R., Anderson, J., King, I. R., Cassisi, S., Milone, A. P., Vilanova, S., Pietrinferni, A., & Renzini, A. 2007, ApJ, 661, L53
- Reimers (1977) Reimers, D. 1977, A&A, 57, 395
- Rey et al. (2000) Rey, S.-C., Lee, Y.-W., Joo, J.-M., Walker, A., & Baird, S. 2000, AJ, 119, 1824
- Rey et al. (2004) Rey, S.-C., Lee, Y.-W., Ree, C. H., Joo, J.-M., Sohn, Y.-J., & Walker, A. 2004, AJ, 127, 958
- Sbordone et al. (2011) Sbordone, L., Salaris, M., Weiss, A., & Cassisi, S. 2011, arXiv:astro-ph/1103.5863
- Siegel et al. (2007) Siegel, M. H., et al. 2007, ApJ, 667, L57
- Stetson (1987) Stetson, P. B. 1987, PASP, 99, 191
- Stetson (1990) Stetson, P. B. 1990, PASP, 102, 932
- Stetson (1994) Stetson, P. B. 1994, PASP, 106, 250
- Stetson et al. (2003) Stetson, P. B., Bruntt, H., & Grundahl, F. 2003, PASP, 115, 413
- Twarog & Anthony-Twarog (1995) Twarog, B. A., & Anthony-Twarog, B. J. 1995, AJ, 109, 2828
- Ventura & D’Antona (2008) Ventura, P., & D’Antona, F. 2008, MNRAS, 385, 2034
- Yi et al. (2008) Yi, S. K., Kim, Y.-C., Demarque, P., Lee, Y. -W., Han, S. -I., & Kim, D. -G. 2008, IAU Symposium, 252, 413
- Yoon et al. (2008) Yoon, S. -J., Joo, S. -J., Ree, C. H., Han, S. -I., Kim, D. -G., & Lee, Y. -W. 2008, ApJ, 677, 1080

| Parameter | Population 1 | Population 2 |
|---|---|---|
| Z | 0.00083 | 0.00121 |
| Y | 0.231 | 0.258 |
| [/Fe] | 0.3 | 0.3 |
| Age | 13.70.3 Gyr | 12.20.3 Gyr |
| aaReimers (1977) mass-loss parameter. | 0.53 | 0.53 |
| bbMean mass-loss on the RGB (). | 0.2179 | 0.2094 |
| ccMass dispersion on the HB (). | 0.020 | 0.020 |
| Population Ratio | 0.6 | 0.4 |