Surface state charge dynamics of a high-mobility three dimensional topological insulator
Abstract
We present a magneto-optical study of the three-dimensional topological insulator, strained HgTe using a technique which capitalizes on advantages of time-domain spectroscopy to amplify the signal from the surface states. This measurement delivers valuable and precise information regarding the surface state dispersion within 1 meV of the Fermi level. The technique is highly suitable for the pursuit of the topological magnetoelectric effect and axion electrodynamics.
Spin 1/2 particles exhibit a counterintuitive property that their wavefunction acquires a phase upon 360∘ rotation. If spin and orbital degrees of freedom are mixed in a particular way, the momenta of electrons in a crystalline lattice feel important effects of this ‘Berry’s phase’, which can lead to a new phase of matter whose description requires a fundamental redress of the theory of semiconductors Kane and Mele (2005); Zhang et al. (2009); Hasan and Kane (2010), and probably many other materials classes Raghu et al. (2008); Groth et al. (2009); Dzero et al. (2010). These topological insulators exhibit an odd number of metallic surface bands with helical spin texture Hsieh et al. (2008, 2009); Chen et al. (2009) surrounding the nominally insulating bulk and display characteristic suppression of backscattering from step edges and nonmagnetic impurities Alpichshev et al. (2010); Roushan et al. (2009). We present magneto-optical measurements deep in the terahertz frequency regime exploring the charge dynamics of surface states in high-mobility strained films of HgTe Fu and Kane (2007); Dai et al. (2008); Luo and Zunger (2010); Brüne et al. (2011). Using a time-domain technique, we detect a strong magneto-optical signal which is dominated by surface bands. This information reveals precise details of the low-energy excitations and momentum-energy dispersion of the helical metallic surface state.
The observation of the quantum spin Hall effect (QSHE) in CdTe-HgTe-CdTe quantum wells Bernevig et al. (2006); König et al. (2007) represents a significant advance in the ability to robustly segregate electronic currents of opposite spin, an effect which paves the way to new applications for spintronics and fault-tolerant quantum computation. In bulk, HgTe possesses the band inversion property due to spin-orbit interaction, a prerequisite condition for the QSHE, but also needed to realize a three dimensional topological insulator phase. Unfortunately, the Fermi level appears directly at the intersection of two bands, rendering the bulk semimetallic and leaving the surface states and the expected topological aspects of this material obscured by the low-energy bulk excitations. However, when HgTe is compressively strained against a CdTe substrate, the bulk band intersection becomes fully gapped in response to the lowered symmetry, permitting isolated access to helical surface bands Fu and Kane (2007); Dai et al. (2008); Luo and Zunger (2010); Brüne et al. (2011). Recently, strong evidence for the existence of the Berry’s phase, surface bands, and associated zero Landau level were observed as a quantum Hall effect of surface states, whose existence were subsequently verified using angle-resolved photoemission Brüne et al. (2011).
In order to probe directly the surface states of strained HgTe, we have developed a method of acquiring time-domain terahertz magneto-optical data using a home-built superconducting magnet in a flow cryostat, illustrated in Figure 1a. Complementary to frequency-domain measurements performed on the same sample at higher temperature (50 K) Shuvaev et al. (2011), which were interpreted in terms of a thermally-activated carriers in the bulk, our measurements were performed at low temperature, where the terahertz response is due to a combination of intrinsically doped bulk carriers and topological surface bands Brüne et al. (2011). At 4.35 K, the magnetic field and incident polarizer angle were set, and one direct pulse plus one echo, due to internal reflection inside the substrate, were collected for analyzer angles subtending 400∘ in 10∘ steps. The pulse and echo were then partitioned into and as shown in Figure 1b, and separately Fourier transformed to obtain the electric field amplitudes and .
When the pulse passes through or reflects from the film, the electric field direction can rotate due to off-diagonal elements of the dielectric tensor or possibly the predicted topological magneto-electric effect Qi et al. (2008). Accounting for the horizontally-polarizing detector and emitter antenna of the spectrometer, the electric field amplitude in pulse at the detector is
| (1) |
where is the electric field generated by the source and is the complex, sample-induced Faraday rotation of the th pulse. Figure 1d,e shows an example fit of equation (1) to the measured intensity of the second pulse for fields of 1.4 T. The change in shape of the intensity distribution around 35 is caused by a change in the complex Faraday angle at this frequency, which we attribute to an absorptive transition among surface state Landau levels. The fitting procedure was applied to both pulses to uniquely determine and at each frequency and field value measured.
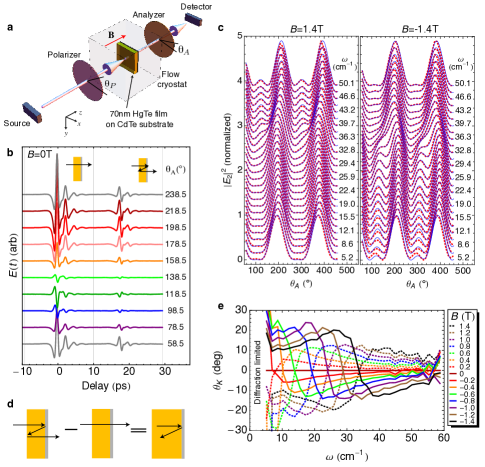
The simultaneous acquisition of multiple pulses with separate histories of contact with the film provides an advantage in accurately determining the polarization rotation due to the film. Any polarizing effects of the polyethylene cryostat windows, as well as inaccuracy in repositioning the polarizer following an angle sweep is exactly the same for the two pulses, so taking the difference in the two Faraday angles = cancels these extraneous effects111This interpretation of the difference angle is possible because the CdTe substrate showed negligible rotation under similar conditions.. A separate measurement of a reference CdTe substrate showed negligible rotation in magnetic field, and this normal-incidence Kerr angle , shown in Figure 1e and 2a-b is precisely the rotation of polarization induced when the pulse reflects at normal incidence from the substrate side of the film (Fig. 1d), and the accuracy to which it can be determined is greater than for the Faraday angles separately.
The field-induced changes in are typical of cyclotron resonance (CR) behavior, for which the dynamical conductivity appropriate for photon angular momentum either parallel (+) or antiparallel (-) the momentum of the incident photon is:
| (2) |
where is the cyclotron frequency, the Drude weight, and is the inverse lifetime of the th band. The elementary response functions in Equation (2) are then plugged into the expression
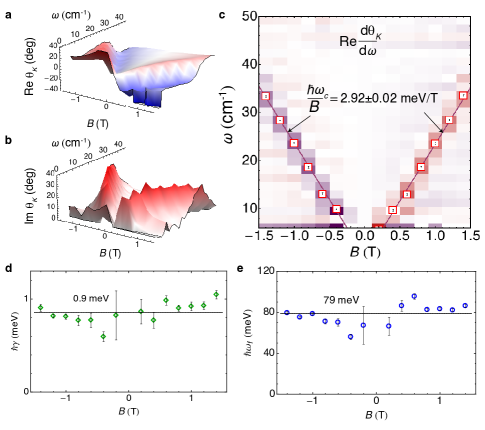
to fit the measured Kerr angle. Here, is the measured substrate index of refraction and is the impedance of free space (see Supplemental Materials 222See Supplemental Material for the measured refractive index of CdTe, quality of fits to , and derivation of relevant equations presented in the text.). While we explore the possibility of a multi-component CR below, the resonance at each field is fit and satisfactorily described by a single effective , , and . This procedure results in the parameters summarized in Figures 2c-e. The sign of the rotation indicates that the carriers involved in the CR are electron-like, and fits to the field dependence give meV, a field-linear cyclotron frequency with meV/T, and total Drude weight meV. Using the relation , and the nearly field-independent (Figure 2d), these fits imply a very high carrier mobility cm2/V s, consistent with previous transport Brüne et al. (2011) and optical Shuvaev et al. (2011) measurements.
In the limit of small carrier concentration, which as we will see below is the relevant limit in the context of this discussion, the 2D Fermi-surfaces are isotropic, and and at low fields are uniquely determined by the Fermi momentum, , and the group velocity at the Fermi-energy, (see Supplemental Materials)
Knowledge of and therefore permits determination of the parameters and , which in turn provides valuable and precise information on the band structure at and around the Fermi energy.
In our 70 nm films, the conduction band is quantized and well-separated in energy due to confinement in the direction, and at low temperature any possible bulk contributions come from a small number of two-dimensional electron pockets. Unlike bulk, the surface contributions to the Drude weight are present for all values of the chemical potential, due to their gapless nature. Because the surface bands are at higher filling () and are more steeply dispersing () than the conduction bands, these states not only always contribute to the CR, but also always contribute more strongly to the magneto-optical signal than a set of bulk states with the same Fermi surface area.
Before we address the implications of possible contributions from the bulk, we start with the simplest assumption, namely that the only contributions to the observed Kerr rotation originate from the two surfaces of the film with approximately the same charge carrier concentration. This is motivated by the magneto-transport showing a quantized Hall effect that results from the 2D Dirac-like topological surface states with densities 4.81011cm-2 and 3.71011cm-2 for the CdTe and vacuum interfaces (respectively) and negligible contribution from the bulk Brüne et al. (2011). Since with this assumption meV for the two surfaces, combination with gives 5.88 m/s and nm-1 (see Fig 3a). The corresponding carrier concentration per surface is cm-2 in good agreement with the high field transport data Brüne et al. (2011) and strongly evidencing a surface-dominated origin of the CR signal. The remaining difference is within the observed variations from one cool-down to another of the same sample, which we attribute to molecular adsorption at the surface of the film at cryogenic temperatures. Comparing these values with the quantum well bandstructure in Brüne et al. (2011), the level of the chemical potential should be positioned above the conduction band bottom with 25% of the Drude weight arising from the bulk states of the film, with the remainder due to the surface bands. Attributing only 75% of the observed Drude weight to the surface states would result in: 5.09 m/s and nm-1, as indicated by the green dotted lines in Fig. 3a. Angle-resolved photoelectron spectroscopy shows a linear dispersion down to 1 eV below the Fermi energy with a velocity 4.3 m/s Brüne et al. (2011). The somewhat higher value obtained from the optical data is expected, since this probes the velocity at the Fermi energy which is closer to the light conduction bands hybridizing with the 2D surface states.
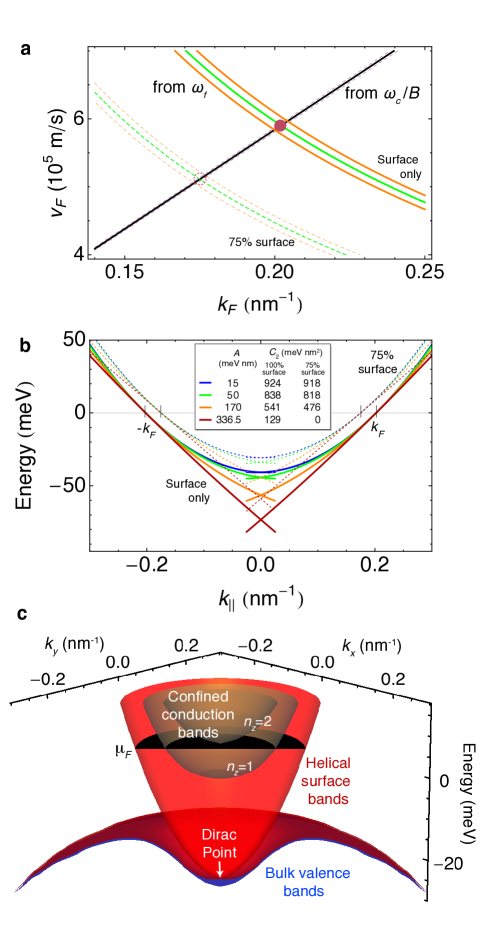
A more detailed perspective of the surface-dominated cyclotron resonance can be attained through comparison of these results to a surface state model dispersion relation Liu et al. (2010). This form accommodates the topologically protected Dirac point (DP) through the term, but allows for significant deviations from the ideal conical dispersion through the term. By varying these parameters, one can interpolate continuously between a pure Dirac cone () and a parabola () emanating from the Dirac point at zone center and energy lying inside the bulk gap. All of the curves of this type with the same values of and fit equally well to our data, as shown in Figure 3b. However, in order to place the DP inside the bulk gap, estimated to be meV at zone center Brüne et al. (2011), the parameter must be very small, 50 meVnm, to be consistent with our data. The resultant parameter is therefore quite large in comparison to other topological materials Hsieh et al. (2009, 2008); Chen et al. (2009); Liu et al. (2010), indicating a relatively rapid departure from the ideal conical dispersion near the DP in strained HgTe. The large second-order term leads one to suspect that higher order isotropic terms (, , …) may be necessary for detailed analysis of certain experiments.
While we do not measure the Fermi energy directly, the simplified dispersion analysis above puts the chemical potential within 40 meV of the Dirac point. This difference can be overcome through gating in an appropriate experimental design, and the chemical potential can be tuned near the Zeeman split zero Landau level. This would fulfill the conditions required to observe the predicted topological magnetoelectric coupling effect Qi et al. (2008); Tse and MacDonald (2010) as a quantized Kerr rotation. This long-sought effect bears close mathematical analogy to high-energy particle theory, permitting one to use terahertz spectroscopy to study the properties of an ‘axion’ domain wall Wilczek (1987), and the methods developed here are highly suited for this pursuit.
We have studied the low energy electrodynamics of topological surface states of strained HgTe using a novel time-domain magneto-optical spectroscopic technique providing Kerr angle spectra to very low energies (1 meV). The method allowed us to obtain the parameters describing the topological surface states near the Fermi energy, until now not resolved by other experimental techniques, namely free carrier spectral weight, quasi-particle scattering rate, cyclotron frequency, Fermi-velocity and Fermi-momentum. Taken together with the requirement that the Dirac point must lie inside the bulk gap, our results imply that the surface bands of strained HgTe are markedly nonconical.
We acknowledge valuable discussions with Shoucheng Zhang and Alberto Morpurgo. This work is supported by the SNSF through Grant No. 200020-135085 and the National Center of Competence in Research (NCCR) MaNEP.
References
- Kane and Mele (2005) C. L. Kane and E. J. Mele, Phys. Rev. Lett. 95, 226801 (2005).
- Zhang et al. (2009) H. Zhang, C.-X. Liu, X.-L. Qi, X. Dai, Z. Fang, and S.-C. Zhang, Nat Phys 5, 438 (2009), URL http://dx.doi.org/10.1038/nphys1270.
- Hasan and Kane (2010) M. Z. Hasan and C. L. Kane, Rev. Mod. Phys. 82, 3045 (2010).
- Raghu et al. (2008) S. Raghu, X.-L. Qi, C. Honerkamp, and S.-C. Zhang, Phys. Rev. Lett. 100, 156401 (2008).
- Groth et al. (2009) C. W. Groth, M. Wimmer, A. R. Akhmerov, J. Tworzydło, and C. W. J. Beenakker, Phys. Rev. Lett. 103, 196805 (2009).
- Dzero et al. (2010) M. Dzero, K. Sun, V. Galitski, and P. Coleman, Phys. Rev. Lett. 104, 106408 (2010).
- Hsieh et al. (2008) D. Hsieh, D. Qian, L. Wray, Y. Xia, Y. S. Hor, R. J. Cava, and M. Z. Hasan, Nature 452, 970 (2008), URL http://dx.doi.org/10.1038/nature06843.
- Hsieh et al. (2009) D. Hsieh, Y. Xia, D. Qian, L. Wray, J. H. Dil, F. Meier, J. Osterwalder, L. Patthey, J. G. Checkelsky, N. P. Ong, et al., Nature 460, 1101 (2009), URL http://dx.doi.org/10.1038/nature08234.
- Chen et al. (2009) Y. L. Chen, J. G. Analytis, J.-H. Chu, Z. K. Liu, S.-K. Mo, X. L. Qi, H. J. Zhang, D. H. Lu, X. Dai, Z. Fang, et al., Science 325, 178 (2009), URL http://www.sciencemag.org/content/325/5937/178.abstract.
- Alpichshev et al. (2010) Z. Alpichshev, J. G. Analytis, J.-H. Chu, I. R. Fisher, Y. L. Chen, Z. X. Shen, A. Fang, and A. Kapitulnik, Phys. Rev. Lett. 104, 016401 (2010).
- Roushan et al. (2009) P. Roushan, J. Seo, C. V. Parker, Y. S. Hor, D. Hsieh, D. Qian, A. Richardella, M. Z. Hasan, R. J. Cava, and A. Yazdani, Nature 460, 1106 (2009), URL http://dx.doi.org/10.1038/nature08308.
- Fu and Kane (2007) L. Fu and C. L. Kane, Phys. Rev. B 76, 045302 (2007).
- Dai et al. (2008) X. Dai, T. L. Hughes, X.-L. Qi, Z. Fang, and S.-C. Zhang, Phys. Rev. B 77, 125319 (2008).
- Luo and Zunger (2010) J.-W. Luo and A. Zunger, Phys. Rev. Lett. 105, 176805 (2010).
- Brüne et al. (2011) C. Brüne, C. X. Liu, E. G. Novik, E. M. Hankiewicz, H. Buhmann, Y. L. Chen, X. L. Qi, Z. X. Shen, S. C. Zhang, and L. W. Molenkamp, Phys. Rev. Lett. 106, 126803 (2011).
- Bernevig et al. (2006) B. A. Bernevig, T. L. Hughes, and S.-C. Zhang, Science 314, 1757 (2006), URL http://www.sciencemag.org/content/314/5806/1757.abstract.
- König et al. (2007) M. König, S. Wiedmann, C. Brüne, A. Roth, H. Buhmann, L. W. Molenkamp, X.-L. Qi, and S.-C. Zhang, Science 318, 766 (2007), URL http://www.sciencemag.org/content/318/5851/766.abstract.
- Shuvaev et al. (2011) A. M. Shuvaev, G. V. Astakhov, A. Pimenov, C. Brüne, H. Buhmann, and L. W. Molenkamp, Phys. Rev. Lett. 106, 107404 (2011).
- Qi et al. (2008) X.-L. Qi, T. L. Hughes, and S.-C. Zhang, Phys. Rev. B 78, 195424 (2008).
- Liu et al. (2010) C.-X. Liu, X.-L. Qi, H. Zhang, X. Dai, Z. Fang, and S.-C. Zhang, Phys. Rev. B 82, 045122 (2010).
- Tse and MacDonald (2010) W.-K. Tse and A. H. MacDonald, Phys. Rev. Lett. 105, 057401 (2010).
- Wilczek (1987) F. Wilczek, Phys. Rev. Lett. 58, 1799 (1987).