Ultra-low noise single-photon detector based on Si avalanche photodiode
Abstract
We report operation and characterization of a lab-assembled single-photon detector based on commercial silicon avalanche photodiodes (PerkinElmer C30902SH, C30921SH). Dark count rate as low as was achieved by cooling the photodiodes down to . While afterpulsing increased as the photodiode temperature was decreased, total afterpulse probability did not become significant due to detector’s relatively long deadtime in a passively-quenched scheme. We measured photon detection efficiency at .
I Introduction
Single-photon detectors (SPDs) are widely used for measuring extremely weak light levels, and they are an enabling technology for biophysics, astrophysics, metrology, quantum optics and quantum information experiments. Nowadays, there exist a number of competing technologies for SPDs, e.g., photomultipliers,PMT1 ; PMT2 superconducting nanowire devices,SSPD1 ; SSPD2 ; SSPD3 visible light photon counters,VLPC2 ; VLPC1 and avalanche photodiodes (APDs).cova When it comes to real-world applications, however, APDs are the most practical choice due to their good characteristics at relatively lower cost.
Silicon (Si) APDs are most often used in order to detect single photons in the visible and near-infrared wavelength range up to .cova Photon detection by Si APDs at longer wavelengths is also possible, enabled by efficient wavelength conversion to the above range.SFG1 ; SFG2 ; SFG3
Commercial SPDs based on Si APDs are available with dark count rates in tens to hundreds range.SPCM ; id ; mpd ; Tau-SPAD Selected detector modules with extremely low dark count rates (below ) are also available, however they have a very small photosensitive area ( in diameter) and low photon detection efficiency in the near-infrared wavelength range ( at ).id However, detectors with a very low dark count rate at a high (50%) photon detection efficiency can be important for a number of experiments and applications.ursin07 ; Lu07 ; Barz10
In this paper, we report a lab-assembled SPD that exhibits dark count rates of only about . Our SPD is based on PerkinElmer C30902SH or C30921SH APDs,pe supplemented with our own electronics and cooling assembly. These APDs have a large input aperture (diameter of sensitive area or ) and high quantum efficiency in the 600–900 wavelength range. The paper is organized as follows: we describe the design of our lab-assembled SPDs, characterize them thoroughly, then compare their performance to that of commercial SPDs.
II Detector design
We assembled several SPDs and tested nine APD samples: eight in window package (referred to as C30902SH-, where is the sample number) and one in light-pipe package (C30921SH). Each APD was mounted on a thermoelectric cooler (TEC). We used 3-stage TEC (Thermonamic TEC3-71-31-17-03) to reach temperatures down to , and 4-stage TEC (Kryotherm TB-4-(83-18-4-1)-1.3) for lower temperatures. The TEC-APD assembly was mounted (using a thermally-conductive epoxy) inside an aluminum-alloy housing with an anti-reflection coated window. On the outside, the housing was mated with a low thermal resistance fan-cooled heatsink (Noctua NH-U12P) to keep the TEC hot plate close to the room temperature. In order to minimize heat flow to the cold plate, electrical connections to the APD and temperature sensor (miniature thermistor, RMT Ltd. TB04) were made with diameter platinum wires, allowing easy manual soldering. Furthermore, to reduce the heat flow via air convection, the TEC-APD assembly was tightly surrounded with cut-to-shape styrofoam (of ordinary type commonly found in, e.g., shipping packaging material for consumer electronics). To prevent ice formation at the cold plate, the housing was sealed with rubber o-rings to keep it air-tight, and a small bag of strong desiccant was placed inside. For desiccant, we used calcium sulfate -anhydrite (Drierite) which worked well down to at least , and P2O5 (Sicapent) for lower temperatures at the cold plate.
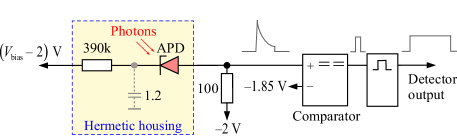
We use a simple and robust passively-quenched detector circuit.cova ; cova-quenching-circuits It consists of a high-voltage power supply, bias resistor (placed close to the APD inside the hermetic housing), high-speed comparator sensing the onset of avalanche, and pulse width extender (Fig. 1).circuit The circuit works owing to the presence of a stray capacitance of about between the cathode of the APD and the ground. During the avalanche, this capacitance quickly discharges through the resistor, causing a short voltage pulse detected by a fast comparator. Detector electronics also contains a TEC controller that maintains a set temperature of the APD.circuit
III Detector characteristics
III.1 APD breakdown voltage
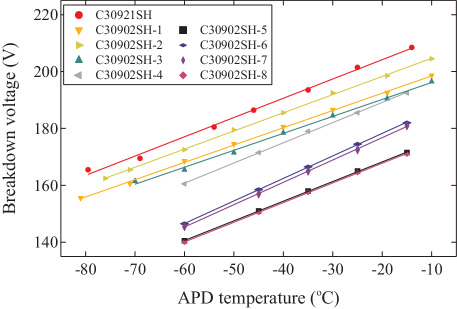
We set the APD temperature and bias voltage with two trimpots. The tunability of is required because the breakdown voltage increases with temperature. Figure 2 shows that depends on linearly with a coefficient ranging from to for different APD samples.
III.2 Photon detection efficiency and dark count rate
For characterization of our lab-assembled SPDs, we measured the photon detection efficiency (DE) and dark count rate (DC) as a function of overbias voltage . The detection efficiency is obtained by measuring the count rate at a certain incoming photon rate , where is continuous-wave (c.w.) optical power focused in a spot in the middle of the APD photosensitive area, is the laser wavelength, is the Planck constant and is the speed of light. The optical power illuminating the detector is obtained by measuring c.w. laser power with an optical power meter, then attenuating the light down to single-photon level with a set of calibrated attenuators (variable attenuator and neutral density filters) providing a cumulative attenuation (dB).
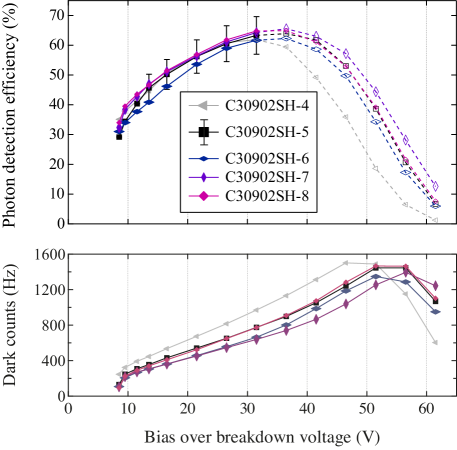
Figure 3 shows DE and DC as a function of at . We measured a maximum DE of at overbias. A DE of at overbias gives a possible trade-off between high DE and low DC. We remark that DE could be further increased slightly by decapsulating the APD package, whose entrance window is not anti-reflection coated.
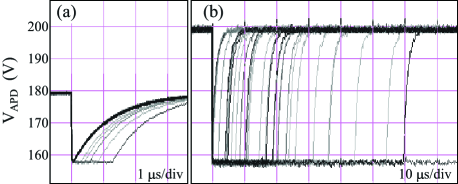
Hereafter, we investigate the drop of DE and DC at higher overbias voltages. In the passively-quenching circuit, the avalanche self-quenches quickly when the current through the APD drops below a certain value (latching current, ).cova-quenching-circuits The self-quenching happens because at a sufficiently low current, the number of carriers in the junction would randomly fluctuate to zero. In a self-sustaning avalanching condition, voltage at the APD drops to about , thus the steady-state APD current equals . To achieve self-quenching, the bias resistor has to be sufficiently large and sufficiently low such that the steady-state current is lower than the latching current. We use bias resistor, which allows the avalanche to self-quench quickly at . Figure 4 shows oscillograms of voltage across the APD when is and . As can be seen, all avalanches self-quench within a few at the lower overbias voltage, whereas they self-sustain for a long time at the higher overbias, randomly extending the detector deadtime with a concomitant drop in measured DE and DC. Although using a larger bias resistor and could possibly result in a higher DE, we have noticed an uncontrolled rise of dark counts at , and did not further investigate APD performance at those voltages. The remaining measurements in this paper are taken at , and are thus not affected by the avalanche self-sustaining behavior.
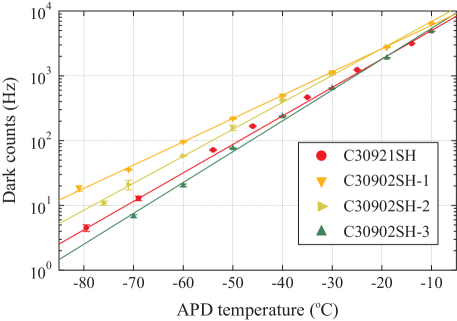
While DE in our measurement is insensitive of , DC increases exponentially with temperature (Fig. 5). On average, one can expect DC to halve for each decrease in temperature. At , we observed for the best sample, and for the worst one. We remark that temperatures down to can easily be achieved with a single-stage TEC.
III.3 Maximum count rate
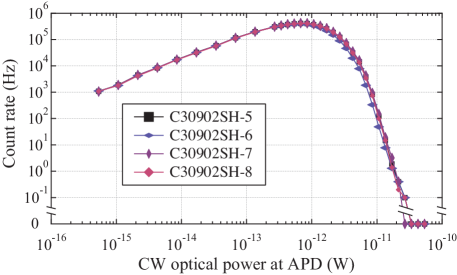
Beyond the useful photon-counting range where the count rate grows linearly with optical illumination, passively-quenched SPDs exhibit saturation and blinding behavior.VM ; Gerhardt2011 In case of our detectors, saturation starts at optical power above and the count rate peaks at (Fig. 6). The SPDs become completely blind to single photons above . These saturation and blinding curves are similar to other passively-quenched SPDs.VM
III.4 Afterpulsing
Because of the relatively long deadtime of passively-quenched SPDs, afterpulsing is usually not as significant as with actively-quenched modules.cova ; cova-quenching-circuits However, since afterpulsing is known to increase as decreases,afterpulsing we have estimated afterpulsing probabilities of our lab-assembled SPDs at low temperatures. In order to measure them, we have measured the autocorrelation function under complete darkness by following the time-correlated single-photon counting method.TCSPC Usually for this purpose, is measured under dim c.w.Becker05 or pulsed light.Cova91 ; Stipcevic10 Assuming of photon counts is identical to that of dark counts, the latter is simpler to measure. Also it is more precise than under c.w. light, when afterpulsing probability is very small. Note that this is not the first example of using of dark counts for quantifying afterpulsing probability.afterpulsing ; Giudice09
From , the afterpulsing probability is given by
| (1) |
where is a delay time, and is the average dark count probability per sample time .AO_Rarity_2000 Since is a constant over the delay time , the afterpulsing probability can be determined by alone. In the limit when (no correlation between counts), we get (no afterpulsing). (resp. ) is to be understood as an increased (resp. decreased) probability of recording a correlated count, causing (resp. , which is to be interpreted as detector deadtime and zero afterpulsing).
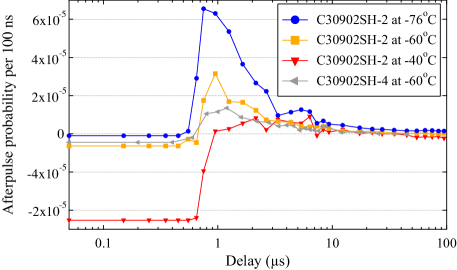
Figure 7 shows afterpulsing probabilities for two APD samples. For the first few hundreds of , is negative because over the detector deadtime. From Eq. (1), the magnitude of is set by the dark count probability for . This is why there are different non-zero levels for different samples and during the deadtime.
| Detector model | SPCM-AQRHSPCM | id100-20id | PDM seriesmpd | Tau-SPADTau-SPAD | our SPD |
|---|---|---|---|---|---|
| Peak detection efficiency | 65% () | 35% () | 49% () | 75% ()111In the center of the photosensitive area. | |
| Detection efficiency at | 55% | 7% | 14% | 59%111In the center of the photosensitive area. | 50%222Although a higher DE can be achieved, we report the value measured at overbias voltage, which we have chosen as a trade-off setting between high DE and low DC. |
| Dark count rate () | typ. 250333 unit is available although it is about twice as expensive (). | 444Less than unit is available on a special order. | 555Specification for PD2CTA model. | typ. 10 | |
| Sensitive area diameter () | 180 | 20 | 20555Specification for PD2CTA model. | 150 | 500 |
| Dark count rate per unit area () | |||||
| Afterpulsing probability | 0.5% | % | % | %111In the center of the photosensitive area. | 0.15% |
| Saturation count rate () | 25 | 20 | 666Not specified in the datasheet; we infer it from the specified deadtime of . | 777Not specified in the datasheet; we infer it from the specified deadtime of . | 0.4 |
For , there is hardly any measurable afterpulsing. As decreases, the afterpulsing probability starts to rise. However, even at the total afterpulsing probability within the first is only 0.15%. This low probability is due to detector’s relatively long deadtime. Since the probability of afterpulsing decays exponentially from the time of avalanche,cova ; afterpulsing most of the trapped carriers are released during the long detector deadtime without causing a count. Note that cooling the APD to the lowest temperature will not necessarily provide the lowest spurious count rate, because in the first few the afterpulsing probability would dominate. The optimum temperature to achieve the lowest noise depends on the photon count rate in a given application, with lower temperature desirable at lower count rates. However, with this deadtime it never makes sense to set temperature above .
IV Comparison to commercial detectors
Before we conclude, let us compare characteristics of our lab-assembled SPD to other widely-used commercial Si-based SPDs. Table 1 shows primary characteristics of various SPDs. Our lab-assembled detector has one of the lowest dark count rates, the largest sensitive area, and a fairly high photon detection efficiency. In particular, our SPD has several orders of magnitude lower dark count rate per unit area than the other detectors. The maximum count rate of our lab-assembled SPD, however, is much smaller than the other SPDs, because we use the passive quenching scheme. One should note, however, that many quantum optics and quantum information experiments do not need such a high count rate.kim10 Thus, our lab-assembled SPD provides a valuable alternative. We remark that it costs under $1000 in components.
V Conclusion
In conclusion, we have built and characterized a lab-assembled SPD based on passively-quenched Si APDs, which exhibit a very low dark count rate ( at for the best sample) and which simultaneously have both a high photon detection efficiency ( at ) and a large photosensitive area ( diameter). In the passively-quenched scheme, afterpulsing probability remains low thanks to detector’s longer deadtime. In view of the relatively low photon detection efficiency (about 10% at ) and small sensitive area ( diameter) of low dark count commercial detectors,id our lab-assembled SPD provides an alternative choice for quantum optics and quantum information experiments, as long as a high count rate is not required.
Acknowledgments
This work was supported by the National Research Foundation of Korea (grant nos. 2009-0070668 and 2009-0084473) and the Research Council of Norway (grant no. 180439/V30). Y.-S.K. acknowledges support from the Korea Research Foundation (KRF-2007-511-C00004). V.M. acknowledges support from the BK21 program. S.S. acknowledges support from the ECOC’2004 foundation and the Research Council of Sweden (VR, grant no. 621-2007-4647).
References
- (1) Photomultiplier handbook (Burle Technologies, Inc., 1980).
- (2) Photomultiplier tubes: Basics and applications (Hamamatsu Photonics K. K., 2006).
- (3) G.N. Gol’tsman, O. Okunev, G. Chulkova, A. Lipatov, A. Semenov, K. Smirnov, B. Voronov, A. Dzardanov, C. Williams, and R. Sobolewski, Appl. Phys. Lett. 79, 705 (2001).
- (4) M. Tarkhov, J. Claudon, J.Ph. Poizat, A. Korneev, A. Divochiy, O. Minaeva, V. Seleznev, N. Kaurova, B. Voronov, A.V. Semenov, and G. Gol’tsman, Appl. Phys. Lett. 92, 241112 (2008).
- (5) G. Goltsman, A. Korneev, A. Divochiy, O. Minaeva, M. Tarkhov, N. Kaurov, V. Seleznev, B. Voronov, O. Okunev, A. Antipov, K. Smirnov, Yu. Vachtomin, I. Milostnaya, and G. Chulkova, J. Mod. Opt. 56, 1670 (2009).
- (6) E. Waks, K. Inoue, W.D. Oliver, E. Diamanti, and Y. Yamamoto, IEEE J. Sel. Top. Quantum Electron. 9, 1502 (2003).
- (7) J. Kim, S. Takeuchi, Y. Yamamoto, and H.H. Hogue, Appl. Phys. Lett. 74, 902 (1999).
- (8) S. Cova, M. Ghioni, A. Lotito, I. Rech, and F. Zappa, J. Mod. Opt. 51, 1267 (2004).
- (9) P. Kumar, Opt. Lett. 15, 1476 (1990).
- (10) H. Pan, E. Wu, H. Dong, and H. Zeng , Phys. Rev. A 77, 033815 (2008).
- (11) R.T. Thew, H. Zbinden, and N. Gisin, Appl. Phys. Lett. 93, 071104 (2008).
- (12) Excelitas Technologies (formerly PerkinElmer Optoelectronics). Single photon counting module SPCM-AQRH datasheet. http://www.excelitas.com/downloads/DTS_SPCM_AQRH.pdf (accessed April 15, 2011).
-
(13)
ID Quantique. id100 series datasheet. http://www.idquantique.
com/images/stories/PDF/id100-single-photon-detector/id100-s
pecs.pdf (accessed April 15, 2011). -
(14)
Micro Photon Devices. PDM series datasheet. http://www.micro
photondevices.com/media/pdf/PDM.pdf (accessed September 22, 2011). -
(15)
PicoQuant. Tau-SPAD datasheet. http://www.picoquant.com/
datasheets/photon_counting/Tau-SPAD.pdf (accessed July 30, 2011). - (16) R. Ursin, F. Tiefenbacher, T. Schmitt-Manderbach, H. Weier, T. Scheidl, M. Lindenthal, B. Blauensteiner, T. Jennewein, J. Perdigues, P. Trojek, B. Ömer, M. Fürst, M. Meyenburg, J. Rarity, Z. Sodnik, C. Barbieri, H. Weinfurter, and A. Zeilinger, Nat. Phys. 3, 481 (2007).
- (17) C.-Y. Lu, X.-Q. Zhou, O. Gühne, W.-B. Gao, J. Zhang, Z.-S. Yuan, A. Goebel, T. Yang, and J.-W. Pan, Nat. Phys. 3, 91 (2007).
- (18) S. Barz, G. Cronenberg, A. Zeilinger, and P. Walther, Nat. Photonics 4, 553 (2010).
- (19) Excelitas Technologies (formerly PerkinElmer Optoelectronics). Silicon avalanche photodiodes C30902 series datasheet. http://www.excelitas.com/downloads/DTS_C30902.pdf (accessed April 15, 2011).
- (20) S. Cova, M. Ghioni, A. Lacaita, C. Samori, and F. Zappa, Appl. Opt. 35, 1956 (1996).
- (21) The electronics has originally been designed by C. Kurtsiefer and his coworkers, and modified by us.
- (22) V. Makarov, New J. Phys. 11, 065003 (2009).
- (23) I. Gerhardt, Q. Liu, A. Lamas-Linares, J. Skaar, C. Kurtsiefer, and V. Makarov, Nat. Commun. 2, 349 (2011).
- (24) A.C. Giudice, M.Ghioni, S. Cova, and F. Zappa, Proceedings of the 33rd European Solid-State Device Research conference (IEEE, 2003), p. 347.
- (25) W. Becker, Advanced time-correlated single photon counting techniques (Springer, 2010).
-
(26)
W. Becker, TCSPC Performance of the id100-50 Detector, Becker & Hickl GmbH (2005). http://www.boselec.com/product
s/documents/id100-seriesAPDtestdata.pdf (accessed August 1, 2011). - (27) S. Cova, A. Lacaita, and G. Ripamonti, IEEE Electron. Dev. Lett. 12, 685 (1991).
- (28) M. Stipčević, H. Skenderović, and D. Gracin, Opt. Express 18, 17448 (2010).
- (29) A.C. Giudice, R. Biasi, I. Rech, S. Marangoni, I. Labanca, G. Simmerle, M. Ghioni, and S. Cova, J. Mod. Opt. 56, 317 (2009).
- (30) J.G. Rarity, T.E. Wall, K.D. Ridley, P.C.M. Owens, and P.R. Tapster, Appl. Opt. 39, 6746 (2000).
- (31) Y.-S. Kim, H.-T. Lim, Y.-S. Ra, and Y.-H. Kim, Phys. Lett. A 374, 4393 (2010).