Diffusion of Mn interstitials in (Ga,Mn)As epitaxial layers
Abstract
Magnetic properties of thin (Ga,Mn)As layers improve during annealing by out-diffusion of interstitial Mn ions to a free surface. Out-diffused Mn atoms participate in the growth of a Mn-rich surface layer and a saturation of this layer causes an inhibition of the out-diffusion. We combine high-resolution x-ray diffraction with x-ray absorption spectroscopy and a numerical solution of the diffusion problem for the study of the out-diffusion of Mn interstitials during a sequence of annealing steps. Our data demonstrate that the out-diffusion of the interstitials is substantially affected by the internal electric field caused by an inhomogeneous distribution of charges in the (Ga,Mn)As layer.
pacs:
66.30.J-, 61.72.Dd, 75.50.PpI Introduction
The coupling of transport and magnetic properties in (Ga,Mn)As thin films has triggered an intense research in the field of spintronics.Dietl et al. (2000) Most of the efforts have been focused to increase the Curie temperature () from the approx. 40 K in as-grown films up to the current record temperature of approx. 190 K, being the most successful strategy the post-growth annealing.Edmonds et al. (2004); Olejník et al. (2008); Schmid et al. (2008) In spite of the numerous theoretical and experimental works, a successful modeling of the involved processes is still lacking.
In an ideal approach, Ga atoms (approximately up to 10%) of the host GaAs lattice are substituted by Mn atoms (Mnsub) and supply both charge (act as acceptors) and magnetic moments that order ferromagnetically. Far from this scenario, some of the Mn atoms are located in interstitial positions (Mnint)Yu et al. (2002) and supply two electrons and order antiferromagnetically to Mnsub.Edmonds et al. (2005) As a result of the competing processes, and saturation magnetization decrease.Máca and Mašek (2002); Jungwirth et al. (2006) The reduction of point defects cannot be achieved by increasing the growth temperature (like in the case of GaAs thin layers) due to the formation of metallic MnAs clusters.Munekata et al. (1989) Instead, the (Ga,Mn)As layers are post-growth annealed to decrease the density of interstitialsEdmonds et al. (2004); Yu et al. (2002) and, to achieve the current record , the annealing is combined with successive surface etching.Olejník et al. (2008) Recent studies indicate that Mnint diffuse through the (Ga,Mn)As lattice towards the free surface where they are passivated and produce a thin Mn rich surface layer.Olejník et al. (2008, 2008) However, the lack of non-destructive probing methods has prevented a step-by-step monitoring of the process across the whole layer and its detailed modeling.
In our previous paper we described a method for the determination of the concentrations of Mn ions in various lattice positions, the method is based on a precise measurement of high-resolution x-ray diffraction (HRXRD) curves around several reciprocal-lattice points.Horák et al. (2010) A variant of the HRXRD method consists in the measurement of the dependence of the diffracted intensity on the photon energy around the MnK absorption edge (anomalous diffraction). From this dependence it is possible to determine the difference of the densities of Mn atoms placed in non-equivalent interstitial lattice positions.Holý et al. (2010)
Another x-ray based methods for the investigation of the lattice positions of Mn atoms in (Ga,Mn)As are the x-ray standing wave method (XRSW) and x-ray absorption spectroscopy (methods extended x-ray absorption fine structure – EXAFS and x-ray absorption near-edge spectroscopy – XANES). The former method uses the effect of x-ray standing wave produced by diffraction in the GaAs substrate. The standing wave excites a fluorescence of the Mn atoms and from the dependence of the fluorescence intensity on the incident angle of the primary radiation the Mn lattice positions can be deduced.Holý et al. (2006); Lee et al. (2010) From the XRSW data it follows that the density of Mn interstitial atoms indeed decreases during annealing, however a quantitative determination of the Mn density profile is practically not possible. The EXAFS method makes it possible to determine roughly the relative amount of the Mn interstitials in a (Ga,Mn)As layer (see Refs. Bacewicz et al., 2005; Demchenko et al., 2007, among others).
Here we present a detailed numerical model of the process of out-diffusion of Mnint during annealing supported by HRXRD and X-ray absorption near edge spectroscopy (XANES). We investigate a sample of (Ga,Mn)As after several annealing steps combined with a wet-chemical removal of the surface layer. The depth profiles of the concentration of Mnint obtained from the HRXRD measurements are compared with the results of numerical simulation of Mn diffusion. From this comparison we are able to estimate the diffusion coefficient of the interstitial ions as well as their trapping rate at the surface. In addition, we study the Mn-rich layer surface by XANES using a grazing incidence surface-sensitive geometry. From the experiments it follows that the surface layer acts as a sink for the incoming Mn interstitials and the out-diffusion process is substantially affected by local electric field in the (Ga,Mn) As layer.
II Experiment
The (Ga,Mn)As epitaxial layer of the nominal thickness of 100 nm and the Mn content of 14% has been grown on a GaAs buffer with the thickness of 150 nm deposited on a GaAs(001) substrate. After the deposition the sample was cleaned in O-plasma and HCl and cleaved to two parts. The first part was ”as-grown” control sample (A) with the Curie temperature below 6 K. The second part was annealed in the air for 24 hours at 160∘C, the Curie temperature increased to 142 K (sample denoted as B-1).
Both samples were characterized by HRXRD. According to the method described in our previous paperHorák et al. (2010) we measured diffraction curves around several reciprocal lattice points. The results indicated (see the following sections) that not all of the interstitial Mn atoms diffused out during the annealing, most likely the passivation of the surface by interstitial ions inhibited the diffusion process. To make evident that the remaining Mn interstitials in the (Ga,Mn)As layer are still mobile, the sample B-1 was rinsed in HCl for 30 s to remove the surface Mn-rich layer and subsequently annealed at 160∘C for one hour. This cleaning&annealing procedure has been repeated 20 times. The sample after the twenty steps of the cleaning&annealing procedure (denoted as B-2) was finally annealed at 160∘C for 80 hours to homogenize the layer and the sample in the final state was denoted as B-3. The sample in states B-2 and B-3 were characterized again by the HRXRD procedure described in Ref. Horák et al., 2010 to obtain the depth profile of the concentration of the Mn interstitials. The experimental diffraction curves for all samples and all diffractions were simultaneously fitted with theoretical curves. The same value of the concentration of the substitutional Mn was kept for all samples during the fitting procedure, since we assume that the Mn atoms in substitutional positions are not affected by the annealing.
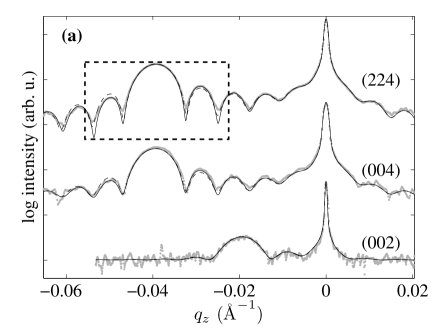
The HRXRD measurements were carried out by a standard laboratory high-resolution x-ray diffractometer equipped with a 2 kW Cu tube with linear focus, parabolic multilayer mirror and a 4Ge220 Bartels monochromator. We used a three-bounce Ge analyzer crystal in front of a point detector. Examples of the measured and fitted diffraction curves are presented in Fig. 1, the fitting procedure and the results are commented in Section III.
The XANES measurements have been carried out at the ANKA synchrotron source, Karlsruhe. X-Spec ionisation chambers from Oxford-FMB were used for the intensity monitors and a five element germanium detector from Canberra for the detection of the fluorescence energy. The used peaking time of the detector electronic was 500 ns. We measured the dependence of the intensity of the MnK fluorescence line in dependence of the energy of the primary x-ray beam for various angles below and above the critical angle of total external reflection, deg for the energy range used (around 6.5 keV). The surface sensitivity of the XANES measurement is achieved by the fact that increasing , the penetration depth and consequently the depth from the fluorescence signal is collected, increases from few nm for to several m.
III Results of the diffraction measurements
The experimental HRXRD curves of all samples were fitted using a standard two-beam dynamical theory of x-ray diffraction Pietsch et al. (2004). From the fit we obtained the optimized parameters (the concentration of the interstitials and the thickness of the layer), their values are summarized in Tab. 1. The details of the experimental data evaluation are described in the previous paperHorák et al. (2010).
The substitutional Mn atoms are not affected by the annealing Yu et al. (2002), this allows us to consider the same concentration of the substitutional Mn in all samples during the fitting procedure. The concentration of the substitutional Mn () was determined by anomalous x-ray diffraction method performed on the same samples.Holý et al. (2010)
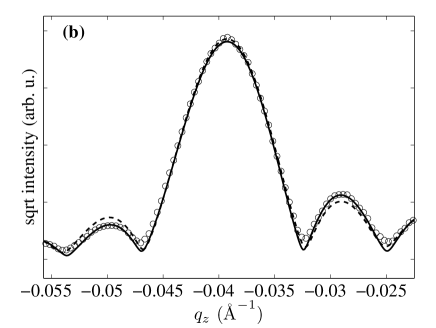
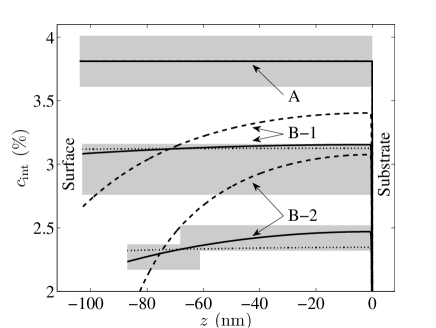
Figure 1 (a) shows the diffraction curves of sample B-2 (20x etched&annealed) measured in diffractions 002, 004 and 224 along with their fits assuming a (Ga,Mn)As layer with homogeneous concentrations of Mn interstitial and substitutional atoms. The quality of the fit is reasonably good, however a close inspection in Fig. 1 (b) reveals that the fitted curve does not reproduce well the asymmetry in the intensities of the 1st thickness oscillations around the layer maximum. From this asymmetry it follows that the (Ga,Mn)As layer in this sample is vertically inhomogeneous. In order to obtain a better fit, two sublayers with various densities of Mn interstitial atoms have to be considered. The fitted experimental data using the model of one layer and the model of two sublayers are shown on Fig. 1. Of course, the interstitial concentration profile is a continuous function of , however more than two layers in the model would lead to an ambiguous solution of the fitting procedure. This two layer approximation allows us to describe the vertically inhomogeneous concentration as a step-like function of the depth. The errors of the interstitial concentration in the individual sublayers (mentioned in the Tab. 1) is comparable with the difference of their values. We should emphasize that these errors come from the uncertainty of the average interstitial density in the sample B-2 and the difference in these interstitial concentrations is , as follows from the fit. The presence of the inhomogeneity in the interstitial concentration is demonstrated unambiguously, since the uncertainty of the difference of the concentrations is much smaller than the error of the total interstitial density. The results of the fitting is depicted in Fig. 2.
The total thickness of the (Ga,Mn)As layer in sample B-2 was determined from the HRXD analysis to nm. From the comparison of the thicknesses of samples B-1 and B-2 it follows that the average decrease of the thickness due to the rinsing in HCl for 30 seconds was 0.8 nm. This value corresponds also to the difference between the thicknesses of the samples A and B-1. Most probably, this is the thickness of a thin oxidized layer at the surface corresponding to the Mn-rich layer after annealing.
IV Diffusion of Mn interstitials
The results of the HRXRD measurements presented in the previous section unambiguously demonstrate that the (Ga,Mn)As layer in sample B-2 is slightly inhomogeneous, i.e., the Mn interstitials exhibit a diffusion gradient. We performed a detailed simulation of the out-diffusion of Mn interstitials during annealing, taking into account their drift in an internal electric field and the sample surface acting as a sink for the interstitials.
The interstitial Mn ions diffuse through the sample during the annealing, the movement of the Mn ions is electrically compensated by the simultaneous diffusion of holes. Simulating the Mn diffusion, we restrict to one dimension denoting the coordinate across the layer, because of the lateral homogeneity of the layer. In our notation we define the origin of the coordinate system () at the interface between the (Ga,Mn)As layer and the buffer layer, the z-axis is pointing to the substrate. The thickness of the layer is denoted by , therefore, the coordinate of the free layer surface is .
The diffusion is described by the following drift-diffusion equationsOlejník et al. (2007)
| (1) | |||
| (2) |
for the density of the Mn interstitials and the density of the holes . We define fluxes of the interstitial (hole) density according to the continuity equation. and are the diffusion constants of interstitials and holes, respectively, related to their mobilities and by the Einstein relationAshcroft and Mermin (1976)
| (3) |
where is the temperature, is the Boltzmann constant and is the electric charge of the corresponding particle ( for holes and for interstitials) .
The electrostatic potential fulfills the Poisson equation
| (4) |
where is the concentration of the substitutional Mn ions considered time-independent and homogenous within the whole layer. The factor 2 on the right-hand side of the last equation reflects the fact that the Mn interstitials are double donors. On the right-hand side of the Eq. (4) the concentration of other charged defects, especially As antisite defects, should be also included if they are present. In our case however the density of the As antisite defects is very small Horák et al. (2010) – definitely smaller than the estimated error of the concentration of Mn acceptors (Mn atoms in substitutional positions). The constants and are the elementary charge and the permittivity of GaAs respectively. The boundary condition for the electrostatic potential
| (5) |
follows from the zero electric field far below the (Ga,Mn) As/GaAs interface.
The surface is passivated during the annealing due to the diffusion of the oxygen from the air into the surface layer Olejník et al. (2008), where Mn oxide is created. The presence of the surface Mn oxide layer after the annealing and its removal after the etching was indicated by the XANES experiments, described later.
We model the process of the Mn oxidation as well as the diffusion of the oxygen and the Mn atoms into the surface layer by a phenomenological surface ”container” at the sample free surface that traps the Mn interstitials coming from the volume of the layer. The thickness of this container can be neglected since the surface oxide layer is very thin (less than 3 nm), following from other experiments Schmid et al. (2008); Olejník et al. (2008). The amount of the Mn ions is effectively decreased just below the surface as some of them are transformed to oxide losing their charge. We assume that the rate of change of this amount is proportional to the local concentration of Mn interstitials and to the remaining ”free capacity” of the surface container. Regarding these assumptions we define the flux of the Mn interstitials into the surface container as
| (6) |
where the maximum capacity of the container is , which corresponds to the possible maximum number of the trapped Mn ions per unit area. Consequently, the number of the trapped particles in the container in time is
| (7) |
The proportionality factor is connected to the rate of the chemical reaction in the container (oxidation of Mn interstitials) and it includes also the diffusion coefficient of the oxygen. The value of this phenomenological parameter can hardly be estimated from the theory. The behavior of the system was tested for various values of , i.e., from the limit of noninteracting surface to the limit of the instantaneous oxidization of the Mn just below the surface.
Since the Mn interstitial ion is a double donor, its oxidation at the surface creates two holes and the flux of the interstitials towards the surface is electrically compensated by the hole flux into the (Ga,Mn)As layer
| (8) |
Realizing, firstly, that one boundary of our system is the surface container, and secondly, there is no movement of the interstitials or the holes far below the surface we can write the boundary conditions for Eq. (1) and (2):
| (9) | ||||
| (10) |
In the calculation we consider zero fluxes of the interstitials and holes in the depth comparable to the film thickness. Eqs. (1) and (2) contain unknown parameters , , and . We assume that these quantities are independent on the local densities and .
We assume that the post-growth annealing of the sample B-1 was long enough (24 hours) to almost fill the container. Therefore, the capacity of the surface container is of the same order of magnitude as the decrease in the total amount of the interstitials during the first annealing, i.e., the difference in the total amount of the interstitials in samples A and B-1. This assumption is supported by the homogeneity of the layer in sample B-1, following from the x-ray diffraction data. The absence of a concentration gradient of the interstitials indicates that the flux of the interstitials into the container () is smaller than their flux within the layer. On the other hand, the flux into the container can be much larger than the flux in the layer during the early period of the annealing, when the container is empty. This leads to the vertical inhomogeneity measurable after many etching and annealing steps (sample B-2).
The mobility and the diffusion coefficient of the holes [ (Ref. Sze and Ng, 2007)] at the annealing temperature C are assumed much larger than those of the interstitials [ (extracted from the data in Ref. Edmonds et al., 2004)]. Therefore, the movement of the holes is rapid enough comparing to the slow interstitials so that they are always in equilibrium for any configuration of the interstitials. This assumption is valid if a difference of the mobilities of the holes and the interstitials is at least several orders of magnitudes, in this case the result of the simulation does not depend on the value of .
In our model, the rinsing in the HCl corresponds to the emptying of the surface container. During the HCl dip the (Ga,Mn)As layer is slightly thinned, this thickness variation is included in the simulation of the cyclical cleaning&annealing procedure. The effect of this cyclical procedure transforming the sample B-1 to B-2 was modelled by the simulation of the diffusion process.
V Simulation results and discussion
In principle it is possible to optimize numerically the diffusion parameters , and to fit the experimental HRXRD data to the diffraction curves calculated from the simulated concentration profiles. This approach is extremely slow due to time consuming calculations of the diffusion, and moreover, the sensitivity of the diffraction profiles to the diffusion parameters is too small to obtain their precise values. Therefore, we calculated the concentration profiles for many sets of the diffusion parameters covering all possible combinations of values within the limit of several orders of magnitude around the expected values (estimated in Sec. IV or previously publishedEdmonds et al. (2004)). We estimated the diffusion parameters of the studied system by choosing the set of the parameters bringing the best agreement of the simulated profiles and the depth profiles determined by HRXRD. The concentration of the interstitials resulted from the HRXRD measurements of the sample A and B-1, resp. B-1 and B-2 determines the initial and final states of the system for the simulation of the post-growth and cyclical annealing, respectively.
Using this procedure, we found the following values , , and . The diffusion coefficient estimated from our simulations is approximately 30 times larger than the published value determined from electrical resistance measurements.Edmonds et al. (2004) If we used the published value of the diffusion coefficient in our model, we were not able to explain simultaneously both the observed inhomogeneity and the decrease of the total amount of the interstitials. Unfortunately, there is a lack of published values of the interstitial diffusivity in (Ga,Mn)As for a detailed comparison. For instance, the values of the diffusion coefficient of Mn interstitials smaller by several orders of magnitude can be found in Ref. Adell et al., 2011 than the value extrapolated from the results in Ref. Edmonds et al., 2004 for the same annealing temperature(C), i.e., is higher than the temperature used in our experiments (160∘C).
The comparison of the simulated concentration profiles and the profiles determined from the HRXRD measurements are shown in Fig. 2. The uncertainty of the HRXRD results, which evidently affects also the initial values for the simulation, allows us to estimate the diffusivity only very roughly. For the demonstration of the sensitivity of the profile on the diffusivity value, we included also the simulation results for 10 times larger and 10 times smaller diffusivities in Fig. 2, the latter value is close to that in Edmonds et al., 2004. A higher diffusivity leads to a more homogenous concentration profile, whereas a smaller diffusivity yields a highly nonhomogeneous profile.
As determined by HRXRD, the concentration of the interstitials decreased by % during the post-growth annealing (A B1). From the decrease of the total amount of the interstitials it is possible to evaluate the container filling . The optimized value of the maximum container capacity following from the numerical simulation of the diffusion is . The estimated capacity of our model container can be compared also to the published results, Holý et al. (2006) where thin annealed (Ga,Mn)As layers were studied by x-ray standing wave fluorescence. From this work we used the value of the total Mn density in the 3 nm thick surface layer after 4 hours of annealing at 200∘C and we calculated the surface density of the interstitials in the (phenomenological) surface container corresponding to this surface layer. This density () is comparable in order of magnitude with our value of then maximum container capacity.
Finally, from the diffraction data of sample B-3 it follows that the layer was homogenized again during the final 80-hour annealing (B-2B-3); the thickness of the crystalline layer is smaller even without the etching procedure, most probably, due to the strong oxidization of the surface during the long time delay before the final annealing. Therefore, we are not able to extrapolate the properties of the surface container to sample B-3 and this is the reason why the simulated and the measured profile of the interstitial concentration in sample B-3 could not be compared. The HRXRD measurement of sample B-3 indicates that the inhomogeneity in the previous sample state (B-2) was not caused to the formation of any immobile defects during the annealing.
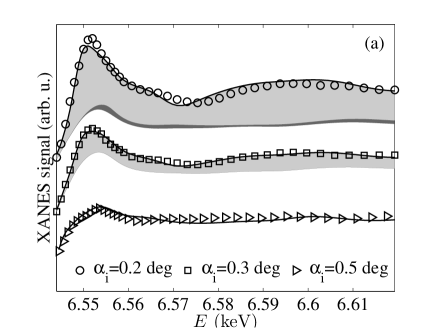
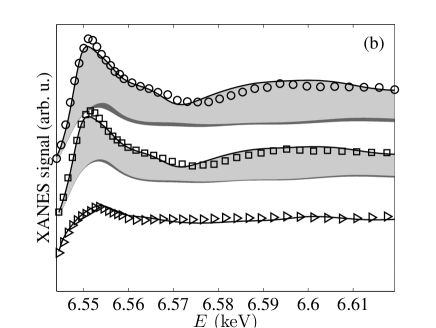
In order to support our model of the surface container represented by the surface Mn-oxide layer we performed a series of x-ray absorption spectroscopy measurements around the MnK absorption edge of the sample A in a reflection geometry with various incidence angles of the primary beams, i.e., for various depths, from which the XANES signal was collected. To observe the influence of the etching and annealing on the surface, we did the measurement for three modifications of sample A: firstly, the original as grown sample A, secondly, the as grown sample A was etched and annealed for one hour at 160∘C to create the Mn-rich surface layer. Finally, the surface layer was removed by another etching. The XANES spectra are displayed in Fig. 3.
The measured spectra were qualitatively compared with the results of ab-initio XANES simulations using the FDMNES code.Joly (2001) We calculated the XANES spectra for Mn substitutional atoms, Mn interstitial ions in two non-equivalent positions and for two Mn oxide phases, namely cubic MnO (manganosite) and orthorombic MnO2 (groutelite). The measured spectra have been fitted to a weighted average of the spectra simulated for various Mn positions. From the data it follows indeed that the Mn-rich layerHolý et al. (2006) at the surface consists of Mn oxide. The presence of the Mn oxide can be clearly identified in the as grown sample, this native oxide layer is very thin as the significant XANES signal from the MnO (recognizable by the sharp peak approx. at keV) was obtained only for the smallest angle of incidence [see Fig. 3(a)]. After the removal of the native oxide by etching and subsequent annealing, the oxide layer was thicker than in the previous case, since the intensity of the signal from the MnO is present also for a larger penetration depth (i.e., for a larger angle of incidence) (Fig. 3(b)). Finally, from the fits of the simulated spectra to experimental data [Fig. 3(c)] it follows that there is no Mn oxide at all after final etching of the sample.
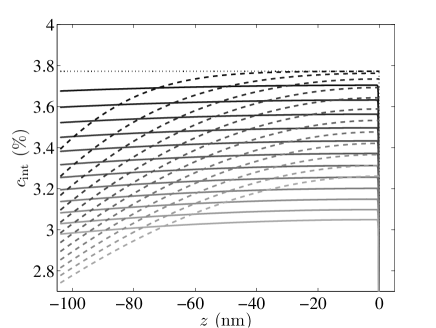
Concluding our observations from the numerical simulations we formulate the interpretation of the annealing process in (Ga,Mn) As layers, very often identified with out-diffusion of the interstitials. The highly mobile holes reach very quickly an equilibrium state, in which their diffusion flux is compensated by the drift flux. This stable state is the result of two driving forces: the compensation of the local charge unbalance and the uniform distribution of the particles driven by the diffusion. If the diffusion of the holes were neglected, the holes would perfectly screen the charge of the substitutional Mn ions. In this case of a perfect screening, the Mn interstitials would not feel the electric field and their migration would be driven only by the diffusion. The calculated profiles of the interstitial densities including and neglecting the diffusion process of the holes are compared in Fig. 4.
The excess holes near the surface caused by the passivation of the interstitials, diffuse deeper to the layer leaving the space below the surface negatively charged. On the other hand, the bottom part of the layer starts charging positively as more holes arrive here by the diffusion. This charge unbalance produces an electric field acting on the interstitials. The resulting electrostatic force acts on the interstitials in the same direction as on the holes, since both particle types are positively charged. However, in contrast to the holes, the surface layer acts as a sink for the interstitials and consequently the interstitials diffuse to the surface.
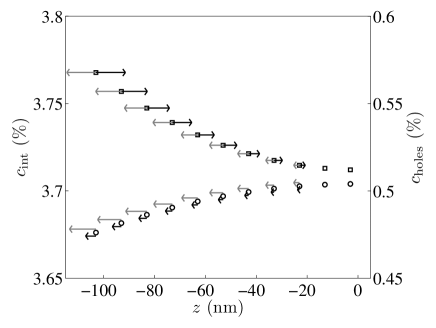
Effects of the drift and the diffusion are superimposed creating the resulting density profiles of the holes and interstitials shown in Fig. 5. From our simulations it follows that the drift flux of the interstitials is larger than the diffusive flux. As Fig. 4 demonstrates, the diffusion of the interstitials itself produce an inhomogeneous layer with a large concentration gradient. Such a large inhomogeneity was not observed by HRXRD; the (Ga,Mn)As layers are usually homogenous even for samples in which the annealing was stopped before reaching the best possible improvement of their magnetic properties. On the other hand, the model including both migration processes of the interstitials and the holes produces a small gradient of the interstitial concentration and the number of the interstitials in the layer after the annealing is smaller than in case of the diffusion alone. Therefore, the main process responsible for the interstitial migration is the drift driven by the rapid diffusion of the holes.
VI Conclusion
We studied the diffusion of Mn interstitials in (Ga,Mn)As during a post growth annealing that is responsible for the improvement of the magnetic properties of this material. By a combination of a multiple short-time annealing with the removal of a thin surface layer a nonzero gradient of the interstitial concentration was created. We used high resolution x-ray diffraction for the determination of the depth profile of the interstitial concentration. We showed that the results of the diffusion simulations are consistent with the x-ray diffraction measurements. Basic parameters of the diffusion were estimated by a comparison of the concentration profiles obtained by the diffusion simulation with the profile determined from the x-ray measurement. We were able to estimate a capacity and a trapping rate of the surface layer absorbing out-diffused Mn interstitials as well as the mobility of the interstitials. From our work it follows that a main mechanism responsible for the removal of Mn interstitals, e.g., improvement of the magnetic properties of (Ga,Mn)As, is the drift of Mn interstitials to a surface driven by a diffusion of holes. Consequently, the movement of the interstitials during post-growth annealing is substantially affected by the internal electrical field caused by an inhomogeneous distribution of holes and positively charged interstitials.
Acknowledgements.
This work is a part of the research programme MSM 0021620834 financed by the Ministry of Education of the Czech Republic. The work has been supported by the European Community’s Seventh Framework Programme NAMASTE under grant agreement number 214499. The XANES experiment was carried out at synchrotron ANKA, Germany.References
- Dietl et al. (2000) T. Dietl, H. Ohno, F. Matsukura, J. Cibert, and D. Ferrand, Science 287, 1019 (2000), http://www.sciencemag.org/content/287/5455/1019.full.pdf .
- Edmonds et al. (2004) K. W. Edmonds, P. Bogusławski, K. Y. Wang, R. P. Campion, S. N. Novikov, N. R. S. Farley, B. L. Gallagher, C. T. Foxon, M. Sawicki, T. Dietl, M. Buongiorno Nardelli, and J. Bernholc, Phys. Rev. Lett. 92, 037201 (2004).
- Olejník et al. (2008) K. Olejník, M. H. S. Owen, V. Novák, J. Mašek, A. C. Irvine, J. Wunderlich, and T. Jungwirth, Phys. Rev. B 78, 054403 (2008).
- Schmid et al. (2008) B. Schmid, A. Müller, M. Sing, R. Claessen, J. Wenisch, C. Gould, K. Brunner, L. Molenkamp, and W. Drube, Phys. Rev. B 78, 075319 (2008).
- Yu et al. (2002) K. M. Yu, W. Walukiewicz, T. Wojtowicz, I. Kuryliszyn, X. Liu, Y. Sasaki, and J. K. Furdyna, Phys. Rev. B 65, 201303 (2002).
- Edmonds et al. (2005) K. W. Edmonds, N. R. S. Farley, T. K. Johal, G. van der Laan, R. P. Campion, B. L. Gallagher, and C. T. Foxon, Phys. Rev. B 71, 064418 (2005).
- Máca and Mašek (2002) F. Máca and J. Mašek, Phys. Rev. B 65, 235209 (2002).
- Jungwirth et al. (2006) T. Jungwirth, J. Sinova, J. Mašek, J. Kučera, and A. H. MacDonald, Rev. Mod. Phys. 78, 809 (2006).
- Munekata et al. (1989) H. Munekata, H. Ohno, S. von Molnar, A. Segmüller, L. L. Chang, and L. Esaki, Phys. Rev. Lett. 63, 1849 (1989).
- Horák et al. (2010) L. Horák, Z. Šobáň, and V. Holý, Journal of Physics: Condensed Matter 22, 296009 (2010).
- Holý et al. (2010) V. Holý, X. Martí, L. Horák, O. Caha, V. Novák, M. Cukr, and T. U. Schülli, Applied Physics Letters 97, 181913 (2010).
- Holý et al. (2006) V. Holý, Z. Matěj, O. Pacherová, V. Novák, M. Cukr, K. Olejník, and T. Jungwirth, Phys. Rev. B 74, 245205 (2006).
- Lee et al. (2010) T.-L. Lee, C. Bihler, W. Schoch, W. Limmer, J. Daeubler, S. Thieß, M. S. Brandt, and J. Zegenhagen, Phys. Rev. B 81, 235207 (2010).
- Bacewicz et al. (2005) R. Bacewicz, A. Twar g, A. Malinowska, T. Wojtowicz, X. Liu, and J. Furdyna, Journal of Physics and Chemistry of Solids 66, 2004 (2005), the 14th International Conference on Ternary and Multinary Compounds.
- Demchenko et al. (2007) I. N. Demchenko, K. Lawniczak-Jablonska, T. Story, V. Osinniy, R. Jakiela, J. Z. Domagala, J. Sadowski, M. Klepka, A. Wolska, and M. Chernyshova, Journal of Physics: Condensed Matter 19, 496205 (2007).
- Pietsch et al. (2004) U. Pietsch, V. Holý, and T. Baumbach, High-Resolution X-Ray Scattering from Thin Films and Lateral Nanostructures (Springer, Berlin, 2004).
- Olejník et al. (2007) K. Olejník, V. Novák, M. Cukr, O. Pacherová, Z. Matěj, V. Holý, and M. Maryško, AIP Conference Proceedings 893, 1219 (2007).
- Ashcroft and Mermin (1976) N. W. Ashcroft and N. D. Mermin, Solid state physics (Brooks Cole, 1976).
- Sze and Ng (2007) S. M. Sze and K. K. Ng, Physics of Semiconductor Devices (John Wiley & Sons, New Jersey, 2007).
- Adell et al. (2011) J. Adell, I. Ulfat, L. Ilver, J. Sadowski, K. Karlsson, and J. Kanski, Journal of Physics Condensed Matter 23, 085003 (2011).
- Joly (2001) Y. Joly, Phys. Rev. B 63, 125120 (2001).

| Sample | thickness (nm) | (%) |
|---|---|---|
| A (as grown) | ||
| B-1 (annealed) | ||
| B-2(20x etch.&ann.) | ||
| top sublayer | ||
| bottom sublayer | ||
| B-3 (homogenized) | ||