Subnanosecond spectral diffusion of a single quantum dot in a nanowire
Abstract
We have studied spectral diffusion of the photoluminescence of a single CdSe quantum dot inserted in a ZnSe nanowire. We have measured the characteristic diffusion time as a function of pumping power and temperature using a recently developed technique [G. Sallen et al, Nature Photon. 4, 696 (2010)] that offers subnanosecond resolution. These data are consistent with a model where only a single carrier wanders around in traps located in the vicinity of the quantum dot.
pacs:
42.50.Lc, 78.67.Lt, 78.55.EtElementary light emitters made of a single quantum object are very sensitive to their local environment. Their optical properties such as intensity, polarization or spectrum can be modified by charge or spin changes in their environment. Spectral diffusion (SD) of a single light emitter corresponds to random spectral jumps of a narrow line within a broader spectral profile. This effect has been observed in single molecule Ambrose ; Plakhotnik or single semiconductor quantum dot Empedocles ; Empedocles97 ; Robinson ; Seufert ; Turck ; Besombes ; Besombes2 experiments. It is generally due to Stark effect caused by the electric field of randomly trapped charges Empedocles97 ; Robinson ; Seufert ; Turck ; Besombes or spin fluctuations Besombes2 in the vicinity of the emitter.
Single light emitters are very promising objects for quantum information as single photon sources, flying/solid qubit interface Simon , or for single photon manipulation Simon2 ; Auffeves ; GNL . In quantum cryptography Beveratos ; Waks , the spectrum of the single photons can be rather broad Beveratos and SD does not significantly affect the performances. On the contrary, quantum logic operation using linear optics as proposed by Knill et al KLM or quantum logic gates using nonlinear interaction at the single photon level (see GNL and reference therein) require undistinguishable single photons with ideal spectral purity. This means that they must necessarily be SD-free, which is also the case for quantum memories. A solution to be SD-free is to operate faster than spectral diffusion. The knowledge of the characteristic time of spectral diffusion is thus required to know whether such a solution is possible.
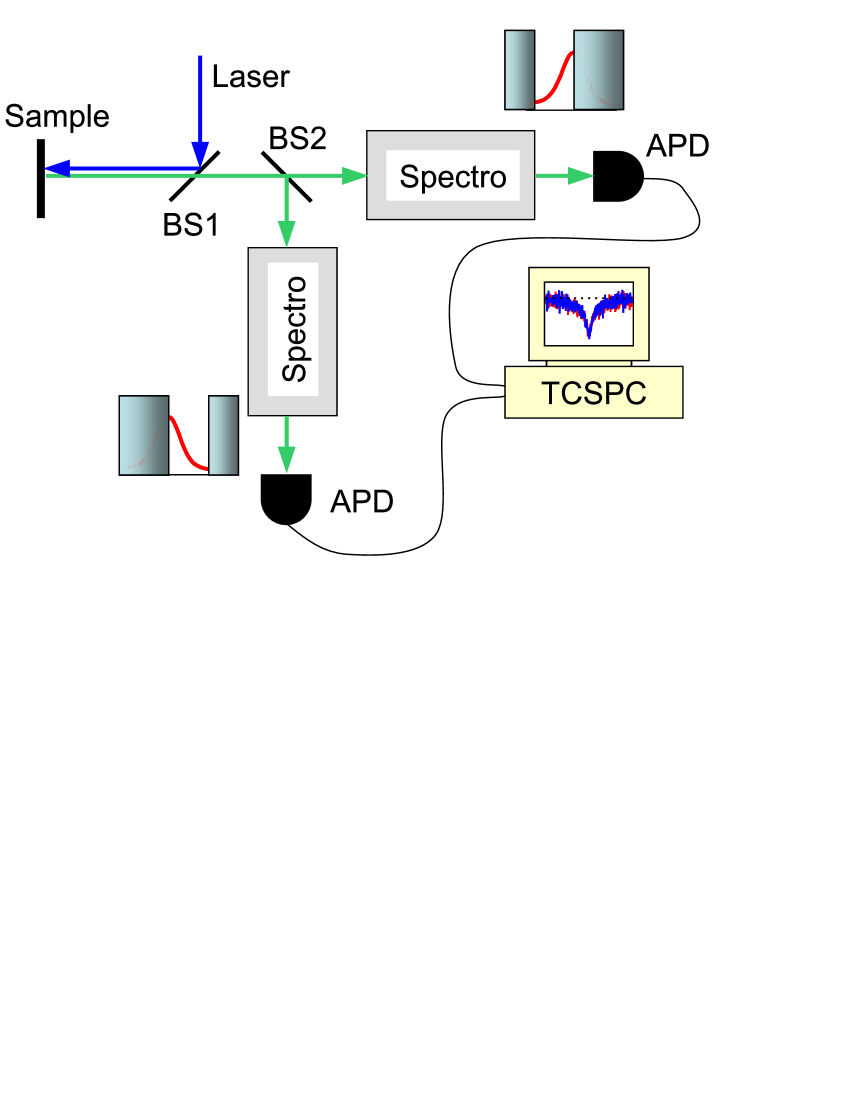
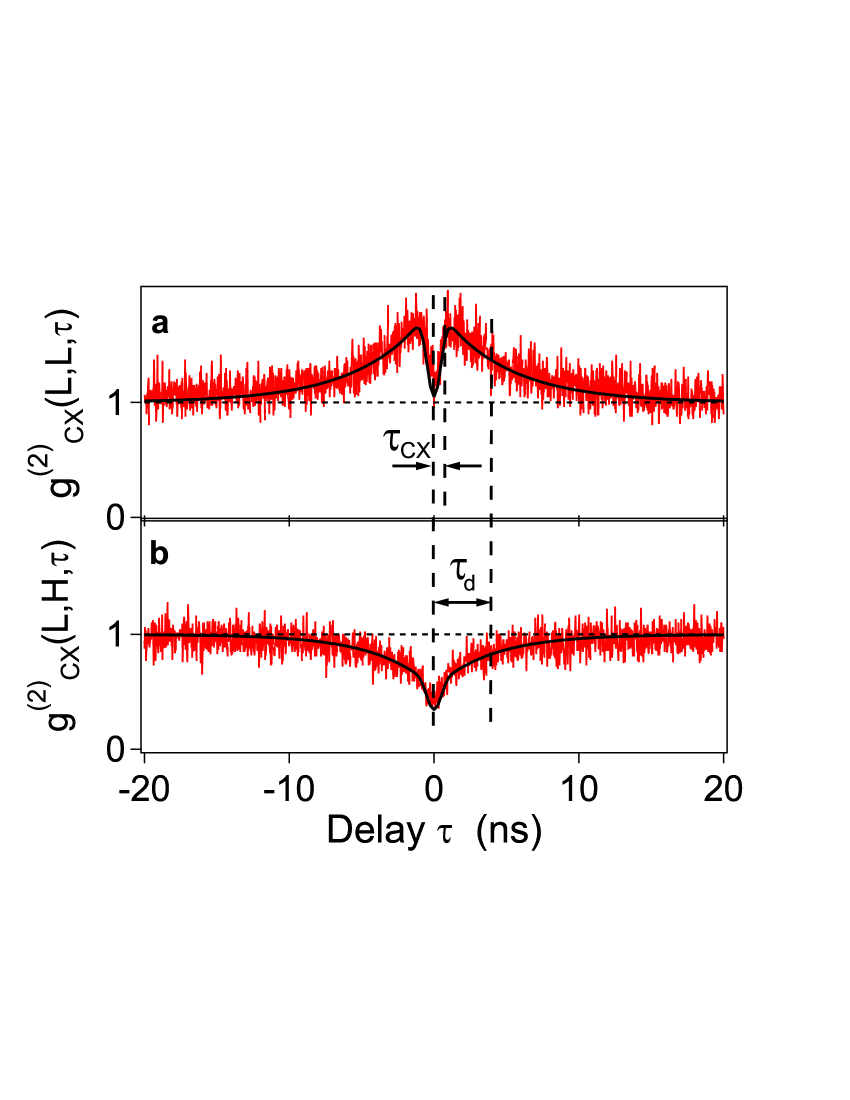
Visualizing directly the spectral wandering by recording a time series of spectra has been so far the usual method to observe SD Ambrose ; Empedocles ; Robinson ; Seufert ; Turck ; Besombes . For single photon emitters, the time resolution was therefore limited by the minimum time of about 1ms required for a photon counting charged coupled device (CCD) to acquire a spectrum. Palinginis et al Palinginis have improved this resolution by measuring a modulation frequency-dependent linewidth in a spectral hole-burning experiment using inhomogeneously broadened ensembles of semiconducting nanocrystals. Our recently developed technique Sallen converts spectral fluctuations into intensity fluctuations, as also reported in Plakhotnik ; Zumbusch ; Coolen ; Marshall . It benefits from the subnanosecond time resolution of an Hanbury-Brown and Twiss photon correlation set-up and improves by more than 4 orders of magnitude the accessible SD times. It gives access for the first time to SD time in the ns range as shown in this paper. This technique is presented in details in ref Sallen . A sketch of the experimental set-up is shown in fig.1. In short, it is based on correlations of photons emitted within a spectral window narrower than the SD broadened line. Owing to the wandering of the homogeneous line, the emission energy stays a limited time within this spectral window leading to photon bunching. The characteristics time of this effect can be easily accessed by photon correlation. fig.2(a) shows a typical result for autocorrelation on one half of the line, and fig.2(b) for cross-correlation between the two halves of the line.
In the present work we use this method Sallen to evaluate the SD characteristic time of CdSe quantum dots embedded in a ZnSe nanowire Aichele ; Tribu ; correlation and obtain informations about the SD mechanism in this system.
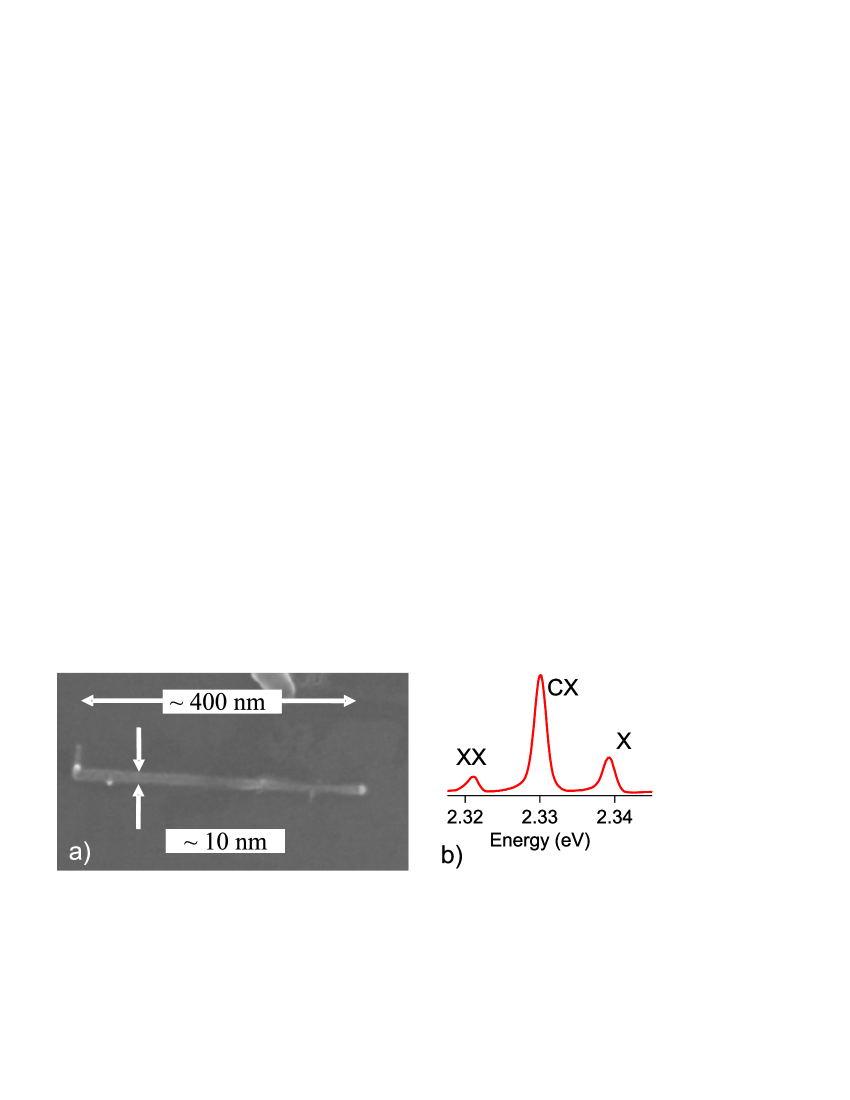
Semiconductor nanowires (NWs) appear as promising building blocks for nanoscale devices and circuits since they can be grown almost defect free on low-cost, routinely used substrates such as silicon Li . Furthermore, NW heterostructures are much less limited by lattice mismatches which greatly widens the possible materials combinations compared to standard self-assembled quantum dots (QDs). Details on the growth of the CdSe/ZnSe NWs can be found in Aichele . Their diameter is around nm. An image of the sample is shown in fig. 3 together with a typical photoluminescence spectrum. Exciton (X), biexciton (XX) and charged exciton (CX) lines have been identified unambiguously using photon correlation spectroscopy correlation . According to previously published results Turck_PSSB ; Patton , it is commonly admitted that charged excitons in CdSe/ZnSe QDs are negatively charged. The radiative lifetimes of these transitions are respectively ps, ps, ps. The luminescence wavelength is around nm with a high count rate of counts per second at K. This system has demonstrated single photon generation up to a temperature of K Tribu . The QD is either neutral (X and XX lines) or charged (CX line). It can be seen in fig. 3(b) that the CX line is more intense than the X and XX lines, indicating that the QD spends more time in the charged state than in the neutral states correlation .
The SD rate is extracted directly from the time width of the correlation measurement as shown in fig. 2. In practice, a more accurate value of the diffusion rate is obtained by fitting the antibunching trace coming from cross-correlation data (fig. 2(b)) rather than the fitting from the autocorrelation data (fig. 2(a)) since the latter contains the excitonic lifetime as an extra time scale. Details of the model used for the fitting are given in Sallen .
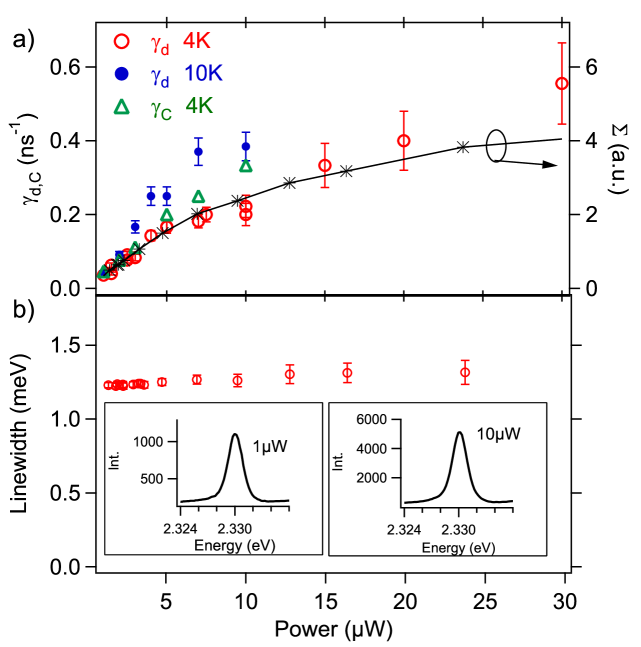
Systematic cross-correlation data analysis allowed us to study the SD rate as a function of different parameters. We have plotted in fig 4(a) the diffusion rate as a function of pumping power at two different temperatures. It can be seen that the diffusion rate increases as the pumping power is raised. Higher temperatures leads also to larger diffusion rates.
To explain the power and temperature dependency shown in fig.4, we have in mind a model with charge traps in the vicinity of the QD Berthelot . Electrical charges are randomly trapped and induce a fluctuating electric field leading to spectral diffusion of QD transitions via Stark effect. To account for the observed SD broadened linewidth, charge traps need to be located within a few nm of the QD Empedocles97 ; Robinson . In the case of ZnSe the residual doping is of n-type and we assume that the charges are electrons. Surprisingly, we have observed that neither the SD-induced linewidth (i.e amplitude of the spectral fluctuations) nor the lineshape depend on the pumping power, as shown in fig.4(b). A possible explanation would be that there is only room for a single charge exploring several trapping sites around the QD and that additional charges are blocked by Coulomb repulsion. Indeed the presence of several charges, that could be induced by large pump power, would lead to a broadening of the SD-induced linewidth, which is not observed.
The charge number trapped around the QD is governed by the following rate equation :
| (1) |
where the first (second) term is the loading (escape) term. The loading term is proportional to to account for the fact that the maximum number of charge is one. The loading rate is proportional to the number of electrons in the ZnSe barrier, where corresponds to the number of photocreated electron-hole pairs in the barrier and to the residual doping. For the escape mechanism, we assume that the prominent effect is the recombination of the trapped electron with a photocreated hole. This leads to an escape rate also proportional to . We assume an activation type behavior for the temperature dependency of and Kamada . The energy corresponds to shallow potential fluctuations experienced by the charges in the barrier. Raising the temperature increases their diffusion length and makes it more likely for the electrons (holes) to load (empty) the deeper traps causing the spectral diffusion of the QD. From the increase of spectral diffusion with temperature, at low powers, we can infer an activation energy meV.
Within this model, the spectral diffusion rate is given by
| (2) |
From the experimental data displayed in fig.4, it appears that the diffusion rate approaches zero as the pumping power vanishes. This means that the contribution of is negligible compared to the term depending on the carrier number . As seen in fig 4(a) the diffusion rates at T=4K and T=10K exhibit a sublinear power dependency. So does the total light intensity emitted within the exciton, biexciton and charged exciton lines. The quantity is proportional to the carrier number in the nanowire as long as these three lines are not saturated, which is the case up to a pump power of W in our situation. For larger pump power, higher order multiexcitonic lines appear away from the detected spectral window, and the power dependency slightly underestimates the total amount of carrier in the nanowire. The similar power dependencies of and is therefore a good indication of the validity of equation (2) but it is not an unambiguous proof. Additionally we mention that sub-linear power behavior of the total amount of carrier could also partly be attributed to Auger scattering in the barrier OHara ; Berthelot .
We compare now the spectral diffusion rate with the charged to neutral hopping rate also displayed in fig.4. This rate has been extracted from the width of the bunching peak of the autocorrelation of the whole line of the charged exciton correlation . The similar hopping rate power dependency suggests a charged/neutral hopping mechanism similar to the spectral diffusion one as exposed above Baier . The comparison between the absolute quantitative values of and is not fully reliable since the data have been acquired on different days. Nevertheless the close values of and are in favor of a scenario in which a spectral diffusion event is a jump into the other charge state and back with a modified surrounding charge distribution.
To summarize, we have used a recently developed method Sallen to measure spectral diffusion of single emitters with a subnanosecond resolution. We have used this technique to study, as a function of pumping power and temperature, the spectral diffusion characteristics of the photoluminescence of a single CdSe quantum dot inserted in a ZnSe nanowire. We have found a characteristic SD time of a few ns and have given good indications that this rate is proportional to the carrier number in the wire. In addition to the power independent linewidth, these findings support a model where a single charge is wandering within a few nm around the quantum dot, suggesting a spectral diffusion mechanism closely related to the charged/neutral QD hopping events.
T.A. acknowledges support by Deutscher Akademischer Austauschdienst (DAAD). Part of this work was supported by European project QAP (Contract No. 15848).
References
- (1) W.P. Ambrose, and W.E. Moerner, Nature 349, 225 (1991).
- (2) T. Plakhotnik and D. Walser, Phys. Rev. Lett. 80, 4064 (1998)
- (3) S.A. Empedocles, D.J. Norris, and M.G. Bawendi, Phys. Rev. Lett. 77, 3873 (1996).
- (4) H.D. Robinson and B.B. Goldberg, Phys. Rev. B 61, R5086 (2000).
- (5) J. Seufert, R. Weigand, G. Bacher, T. Kümmell, A. Forchel, K. Leonardi, and D. Hommel Appl. Phys. Lett. 76, 1872 (2000)
- (6) V. Türck, S. Rodt, O. Stier, R. Heitz, R. Engelhardt, U.W. Pohl, and D. Bimberg, Phys. Rev. B 61, 9944 (2000).
- (7) L. Besombes, K. Kheng, L. Marsal, and H. Mariette, Phys. Rev. B 65, 121314 (2002).
- (8) S.A. Empedocles and M.G. Bawendi, Science 278, 2114 (1997).
- (9) L. Besombes, Y. Leger, J. Bernos, H. Boukari, H. Mariette, J. P. Poizat, T. Clement, J. Fernández-Rossier, and R. Aguado, Phys. Rev. B 78, 125324 (2008)
- (10) C. Simon et al, Eur Phys Journal D 58, 1 (2010)
- (11) C. Simon, Y.-M. Niquet, X. Caillet, J. Eymery, J.-P. Poizat, and J.-M. Gérard, Phys. Rev. B 75, 081302 (2007)
- (12) A. Auffèves-Garnier, C. Simon, J.-M. Gérard, and J.P. Poizat, Phys. Rev. A 75, 053823 (2007)
- (13) J.L. O’Brien, A. Furusawa, and J. Vuc̆ković, Nature Photon. 3, 687 (2009)
- (14) A. Beveratos, R. Brouri, T. Gacoin, A. Villing, J.P. Poizat, and P. Grangier Phys. Rev. Lett. 89, 187901 (2002)
- (15) E. Waks, K. Inoue, C. Santori, D. Fattal, J. Vuckovic, G.S. Solomon, and Y. Yamamoto Nature 420, 762 (2002)
- (16) E. Knill, R. Laflamme, G. J. Milburn, Nature 409, 46 (2001); see also A. Kiraz, M. Atatüre, and A. Imamoğlu, Phys. Rev. A 69, 032305 (2004) and P. Kok, W. J. Munro, K. Nemoto, T. C. Ralph, J.P. Dowling, and G. J. Milburn Rev. Mod. Phys. 79, 135 (2007)
- (17) P. Palinginis, S. Tavenner, M. Lonergan, and H. Wang Phys. Rev. B 67, 201307 (2003).
- (18) G. Sallen, A. Tribu, T. Aichele, R. André, L. Besombes, C. Bougerol, M. Richard, S. Tatarenko, K. Kheng, and J. Ph. Poizat, Nature Photon. 4, 696 (2010)
- (19) Zumbusch, A., Fleury, L., Brown, R., Bernard, J. & Orrit, M. Probing individual two-level systems in a polymer by correlations of single molecule fluorescence, Phys. Rev. Lett. 70, 3584-3587 (1993).
- (20) L. Coolen, X. Brokmann, P. Spinicelli, and J.-P. Hermier Phys. Rev. Lett. 100, 027403 (2008).
- (21) L.F. Marshall, Jian Cui, X. Brokmann, and M.G. Bawendi, Phys. Rev. Lett. 105, 053005 (2010)
- (22) T. Aichele, A. Tribu, C. Bougerol, K. Kheng, R. André, and S. Tatarenko Appl. Phys. Lett. 93, 143106 (2008).
- (23) G. Sallen, A. Tribu, T. Aichele, R. André, L. Besombes, C. Bougerol, S. Tatarenko, K. Kheng, and J. Ph. Poizat, Phys. Rev. B 80, 085310 (2009).
- (24) A. Tribu, G. Sallen, T. Aichele, R André, J.-Ph. Poizat, C. Bougerol, S. Tatarenko, and K. Kheng, Nano Lett. 8, 4326 (2008).
- (25) V. Türck, S. Rodt, R. Heitz, O. Stier, M. Strassburg, U. W. Pohl, and D. Bimberg, Phys. Status Solidi B 224, 217 (2001).
- (26) B. Patton, W. Langbein, and U. Woggon, Phys. Rev. B 68, 125316 (2003).
- (27) Y. Li, F. Qian, J. Xiang, and C.M. Lieber, Materials today 9, 18 (2006)
- (28) A. Berthelot, I. Favero, G. Cassabois, C. Voisin, C. Delalande, Ph. Roussignol, R. Ferreira, and J.M. Gérard, Nature Physics 2, 759 (2006).
- (29) K. E. O’Hara, J. R. Gullingsrud, and J. P. Wolfe , Phys. Rev. B 60, 10872 (1999)
- (30) H. Kamada and T. Kutsuwa Phys. Rev. B 78, 155324 (2008)
- (31) M. H. Baier, A. Malko, E. Pelucchi, D. Y. Oberli, and E. Kapon Phys. Rev. B 73, 205321 (2006)
- (32) J.J. Finley, M. Sabathil, P. Vogl, G. Abstreiter, R. Oulton, A. I. Tartakovskii, D. J. Mowbray, M. S. Skolnick, S. L. Liew, A. G. Cullis, and M. Hopkinson, Phys. Rev. B 70, 201308(R) (2004)