Ab initio study of compressed Ar(H2)2: structural stability and anomalous melting
Abstract
We study the structural stability and dynamical properties of Ar(H2)2 under pressure using first-principles and ab initio molecular dynamics techniques. At low temperatures, Ar(H2)2 is found to stabilize in the cubic C15 Laves structure (MgCu2) and not in the hexagonal C14 Laves structure (MgZn2) as it has been assumed previously. Based on enthalpy energy and phonon calculations, we propose a temperature-induced MgCu2 MgZn2 phase transition that may rationalize the existing discrepancies between the sets of Raman and infrared vibron measurements. Our AIMD simulations suggest that the melting line of Ar(H2)2 presents negative slope in the interval GPa. We explain the origin of this intriguing physical phenomenon in terms of decoupling of the Ar and H2 degrees of freedom and effective thermal-like excitations arising from coexisting liquid H2 and solid Ar phases.
pacs:
31.15.A-, 64.70.K-, 81.30.-t, 64.70.djI Introduction
Solid hydrogen H2 is expected to become metallic at compressions higher than GPa [stadele00, ]. In fact, experimental signatures of the long-sought insulator-to-metal phase transition remain elusive up to pressures of GPa [narayana98, ]. Accepted pressure-induced mechanisms by which the metallicity of hydrogen can be enhanced involve atomization of H2 molecules and partial filling of electronic molecular levels due to charge transfer from or band hybridization with other chemical species [loubeyre93, ; strobel09, ; zurek09, ]. Already in the earlier 90’s Loubeyre et al., based on the disappearance of the Raman (R) vibron mode and the darkening of the material, claimed to observe metallization of the Ar(H2)2 compound when compressed in the diamond-anvil-cell (DAC) up to GPa [loubeyre93, ]. The stable room-temperature (RT) phase structure of this compound was identified with the hexagonal C14 Laves structure typified by the MgZn2 crystal (space group: ). Strikingly, posterior synchrotron infrared (IR) measurements did not show evidence of molecular bonding instabilities nor metallic Drude-like behavior up to at least GPa [datchi96, ]. Subsequently, Bernard et al. suggested that activation of H2 dissociation processes and corresponding development of metallization in Ar(H2)2 could occur via a solid-solid phase transition of the MgZn2 AlB2 (space group: ) type at pressures already within the reach of DAC capabilities [bernard97, ]. However, recent ab initio work done by Matsumoto et al. demonstrates that the onset of metallicity in the AlB2 structure commences at pressures significantly higher than in pure bulk H2 [matsumoto07, ].
In view of the growing interest on hydrogen-rich van der Waals (vdW) compounds under pressure [strobel09, ; somayazulu09, ], partly motivated by the hydrogen-storage problem, and of the unresolved discrepancies described above, we have conducted a theoretical study on Ar(H2)2 under extreme conditions using first-principles density functional theory (DFT) calculations and ab initio molecular dynamics simulations (AIMD). In this letter, we present results showing that at low temperatures and pressures up to GPa the Ar(H2)2 crystal stabilizes in the cubic C15 Laves structure typified by the MgCu2 solid (space group: ). This structure has not been considered in previous works [bernard97, ; matsumoto07, ; chacham95, ] though its probable relevance to Ar(H2)2 was pointed out recently [cazorla09, ]. On the light of first-principles enthalpy and phonon calculations, we propose a temperature-induced (pressure-induced) phase transition of the MgCu2 MgZn2 (MgZn2 MgCu2) type that may clarify the origin of the discrepancies between the sets of R and IR data. Furthermore, in the high- regime ( GPa) we find that a metallic hydrogen-rich liquid can be stabilized at temperatures of K wherein H-H coordination features render molecular dissociation activity. By means of AIMD simulations, we estimated an upper bound of the melting curve of Ar(H2)2 and found a negative slope spanning over the interval GPa. Our simulations show that the lattice composed by H2 molecules melts at temperatures significantly lower than the lattice of Ar atoms does, so leading to stable mixtures of coexisting liquid H2 and solid Ar over wide ranges. We propose an argument based on this atypical physical behavior to explain the cause of the estimated negative slope.

II Overview of the calculations
Our calculations were performed using the all-electron projector augmented wave method and generalized gradient approximation of Wang and Perdew as implemented in the VASP code [vasp, ]. Dense Monkhorst-Pack special -point meshes [monkhorst76, ] for sampling of the first Brillouin zone (IBZ) and a cutoff energy of eV were employed to guarantee convergence of the total energy per particle to within meV. In particular, we used , and -point grids for calculations on the perfect unit cell corresponding to the MgCu2, MgZn2 and AlB2 crystal structures, respectively. All the considered crystal structures were relaxed using a conjugate-gradient algorithm and imposing the forces on the particles to be less than eV/Å. The phonon frequencies in our calculations were obtained using the small-displacement method [kresse95, ; phon, ] over the unit cells (-point phonon frequencies) and large supercells containing atoms. Ab initio molecular dynamics simulations were carried out in the canonical ensemble using bulk supercells of Ar(H2)2 containing atoms (-point sampling). At given pressure, the dynamical properties of the system were sampled at K intervals from zero-temperature up to the melting curve of pure Ar. Temperatures were maintained using Nosé-Hoover thermostats. A typical AIMD simulation consisted of ps of thermalization followed by ps over which statistical averages were taken. It is worth noticing that we recently used a very similar computational approach to the one described here to study the energetic and structural properties of Ar(He)2 and Ne(He)2 crystals under pressure [cazorla09, ], and that very recent experiments [fukui10, ] have confirmed the validity of our predicted curves.

III Results and Discussion
III.1 Low- results
A series of candidate structures were considered in our ab initio enthalpy calculations (rutile, fluorite, MgNi2, etc.) however only the MgZn2, MgCu2 and AlB2 structures turned out to be energetically competitive so the following analysis concentrates on these ones. Ignoring quantum zero-point motion effects, we found that Ar(H2)2 is energetically more stable in the MgCu2 structure than in either the MgZn2 or AlB2 structures at pressures GPa (see Figure 1). Also we predicted that at GPa the solid transitates from the MgCu2 to the AlB2 structure. The calculated zero-temperature equation of state of Ar(H2)2 in the MgCu2 structure displays very good agreement with respect to the available experimental data [bernard97, ] (see Figure 2). For instance, at and Å3/particle we obtain a pressure of and GPa, respectively, to be compared with the experimental values and GPa. It must be noted that the estimated equation of state and pressure-dependence of the H-H intermolecular bond distance of the MgZn2 and MgCu2 phases appear to be indistinguishable within the numerical uncertainty in our calculations (namely, GPa and Å-see Figure 2-).
Since hydrogen is a very light molecule, quantum zero-point motion corrections must be included in the calculations. Customarily this is achieved using quasi-harmonic approaches that involve estimation of the vibrational phonon frequencies. In following this procedure, we found that Ar(H2)2 in the MgZn2 structure always exhibits imaginary -phonon frequencies at pressures below GPa. This means that the MgZn2 structure is mechanically unstable, at least, at low temperatures. On the other hand, we found that the MgCu2 structure is perfectly stable at all the studied pressures. Our numerical tests showed that this result does not depend on the approximation of the exchange-correlation functional used [ceperley80, ]. In Figure 3, we show the phonon frequency spectra of Ar(H2)2 in the MgCu2 crystal structure calculated along a -point path contained within the IBZ and at pressure GPa .

Since the x-ray resolved RT crystal structure of Ar(H2)2 is MgZn2 [loubeyre93, ], we carried out a series of AIMD simulations of this and the MgCu2 structure at K in order to explore their stability. In fact, analysis of our simulations based on estimation of the averaged mean-squared displacement and position-correlation function [vocadlo03, ] showed that both MgCu2 and MgZn2 structures are mechanically stable at RT. On view of these results and the reported x-ray data, we concluded that a temperature-induced MgCu2 MgZn2 transition occurs at fixed (or equivalently, a pressure-induced MgZn2 MgCu2 transition at fixed - see Figure 1 -). This temperature-induced transformation can be understood in terms of entropy: Ar(H2)2 in the MgZn2 structure is highly anharmonic so ionic entropy contributions to the total free-energy stabilize this structure over the MgCu2 phase with raising temperature. In fact, IR measurements displayed an splitting of the vibron mode in the interval K [ulivi99, ]. This sppliting can be induced by the degenerancy removal of the infrarred mode due to the decrease of the crystal quality caused by precursor effects of the MgZn2 MgCu2 transition.
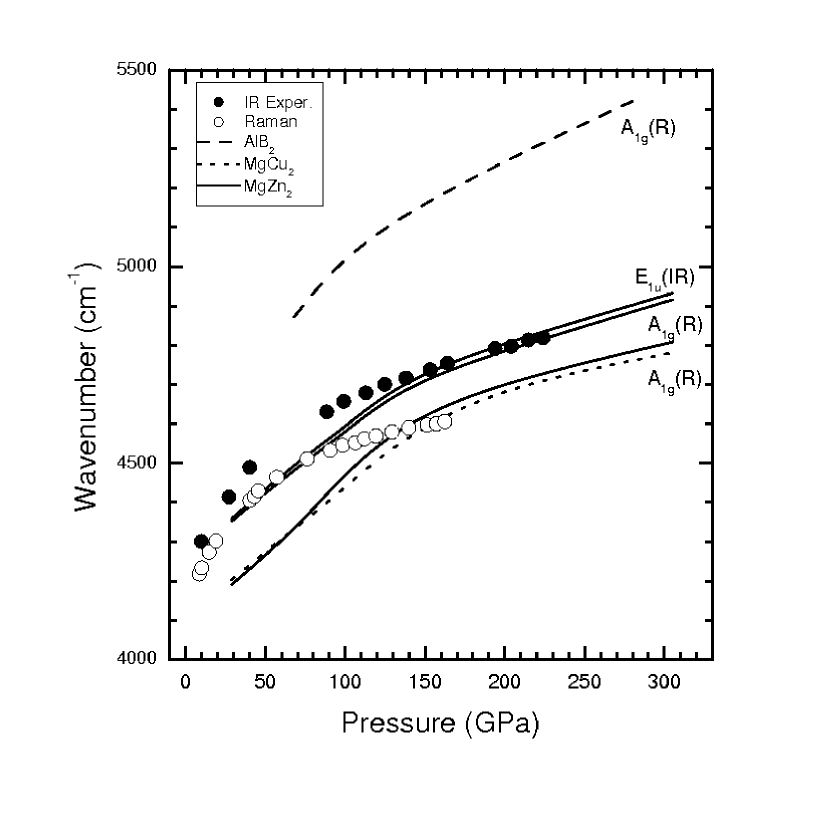
The causes of the aforementioned R-IR experimental disagreements can be rationalized in the light of the foreseen MgCu2 MgZn2 transition, as we explain in what follows. In Figure 4, we enclose the calculated R and IR vibron frequencies of Ar(H2)2 in the MgZn2, MgCu2 and AlB2 structures as function of pressure. At high pressures, it is shown that the vibron line corresponding to the MgZn2 and MgCu2 structures are practically identical, whereas they settle appreciably below the line estimated for the AlB2 structure, and follow closely the low- R results [loubeyre93, ]. These outcomes together with the energy and phonon results already presented, led us to think that the sudden dissapearance of the R vibron mode observed at high- might be related to the MgCu2 MgZn2 transition unravelled in this Letter and not to pressure-induced metallic-like behavior [loubeyre93, ] or MgZn2 AlB2 phase transition [bernard97, ] as previously suggested. In fact, accurate electronic density of states (DOS) analysis performed on the perfect MgZn2, MgCu2 and AlB2 crystal structures show no closure of the electronic band gap up to compressions of at least GPa. Furthermore, the vibron line that we calculated for the MgZn2 structure (see Figure 4) agrees closely with Datchi’s IR data obtained at high pressures. This accordance is coherent if one considers that the series of IR experiments were realized near the edge of the MgCu2-MgZn2 phase boundary, as we sketch in Figure 1. Conclusive experiments confirming the validity of our statements might consist of new series of x-ray and IR measurements performed at temperatures below K and high pressures; according to our predictions, the vibron signature will eventually disappear at the crossing with the MgCu2-MgZn2 phase boundary since IR vibron modes in the MgCu2 structure are inactive.

III.2 High- results
An intriguing physical phenomenon has been recently predicted and subsequently observed in H2 under pressure. It consists in the appearance of a maximum peak on its melting line followed by a negative slope [bonev04, ; deemyad08, ]. This phenomenon have been explained in terms of subtle changes on the intermolecular forces due to compression instead of more familiar arguments like promotion of valence electrons to higher energy orbitals or occurrence of molecular dissociation processes. Motivated by these interesting findings on hydrogen, we investigated the dynamical properties of Ar(H2)2 at high- and high- in the search of similar physical manifestations and to provide further understanding of vdW compounds in general. There exist several well-established techniques by which one can determine the melting line of a material; these essentially base on solid-liquid phase coexistence simulations and/or Gibbs free-energy calculations [gillan, ]. Application of these methods at quantum first-principles level of description, however, turns out to be computationally very intensive and laborious. A simulation approach that has proved successful in reproducing general melting trends in materials at affordable computational cost, including experimental negative melting slopes, is the ‘heat-until-it-melts’ method [tamblyn08, ; raty07, ]. This technique allows for estimation of a precise upper bound of the solid-liquid phase boundary of interest. It must be stressed that we did not pursue accurate calculation of the melting line of Ar(H2)2 but to identify possible anomalous effects on it.
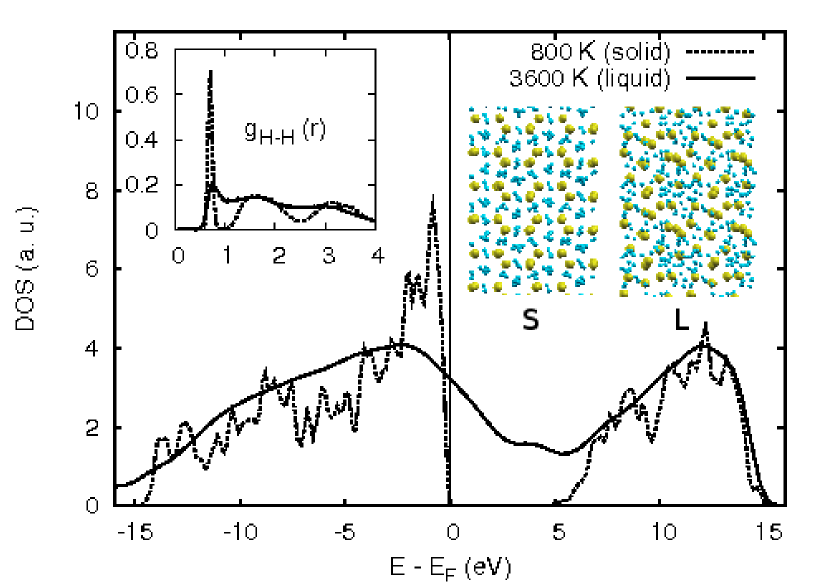
Results from our AIMD simulations are shown in Figure 5 and can be summarized as follows: (i) the lattice of H2 molecules melts at temperatures significantly lower than the whole crystal does so leading to mixtures of liquid H2 and solid Ar over wide ranges; (ii) the fusion of the H2 lattice occurs at temperatures very close to the melting line of pure hydrogen while Ar(H2)2 as a whole practically reproduces the melting behavior of pure Ar up to GPa; (iii) the value of the estimated slope is negative within the pressure interval GPa whereas positive elsewhere. Results (i) and (ii) can be interpreted in terms of similar arguments than recently disclosed in solid mixtures of Ne-He and Ar-He, namely: lattices composed of same-species particles effectively behave like not interacting one with another but following alike physical trends (bond distance, compressibility, etc.) than found in their respective pure system [cazorla09, ]. In fact, we recently conjectured the superior energy stability of the MgCu2 structure over MgZn2 in Ar(H2)2, as rigorously demonstrated here, using this type of reasoning and crystal symmetry arguments [cazorla09, ]. Regarding result (iii), this is in itself a manifestation of a very peculiar and intriguing physical phenomenon. In general, systems presenting negative melting slope are characterized by open crystalline structure (water and graphite), surpassing promotion of valence electrons in the fluid phase (alkali metals) or continuous changing interparticle interactions (molecular hydrogen). In the present case either open crystalline structure or electronic band promotion effects (energetically prohibitive) can be ruled out, so changes in the interparticle interactions holds as the likely cause. The question to be answered next then is: what is the exact nature of these changing interactions?, or more precisely, do they relate to dramatic changes in electronic structure? are the ionic degrees of freedom and effective decoupling of the Ar and H2 lattices crucial to them? In order to detect possible electronic phase transitions and/or molecular dissociation processes, we performed meticulous averaged DOS and H-H radial correlation function () analysis over the atomic configurations generated in the AIMD runs. Within the thermodynamic range GPa and K (where ), we found that Ar(H2)2 is always an insulator material, either solid or liquid, where H2 molecules remain stable. Therefore, dramatic changes in electronic structure can be discarded as the originating mechanism behind the alternating sign of . Actually, on the contrary case, one would have expected the value of to be negative also beyond GPa since in principle there is not reason to think that the originating electronic effects go missing at higher-. Interestingly, at compressions above GPa and temperatures high enough for the system to melt we did observe closure of the electronic energy band gap; according to analysis and visual recreation of the AIMD configurations, this electronic phase transition is a consequence of emergent H2 dissociation processes. In Figure 6, we enclose DOS and results that illustrate this insulator-to-metal phase transition. It is worth noticing that this result is consistent with shock-wave compression experiments [weir96, ] and ab initio investigations [bonev04, ] performed on pure hydrogen. With regard to the predicted negative melting slope, ionic effects are the likely subjacent cause. Considering results (i) and (ii) above, one can envisage a plausible explanation of this phenomenon: since the lattice of H2 molecules melts at temperatures much lower than the lattice of Ar atoms does, collisions between diffusive H2 molecules and localized Ar atoms act like effective thermal-like excitations on the last that ultimately provoke the global melting of the system at temperatures below those of pure Ar. H2 itself presents negative melting slope beyond GPa so this effect is echoed, and enhanced significantly, in the melting line of Ar(H2)2 (see Figure 5). Beyond GPa, the stability of the Ar lattice becomes further reinforced so the effect of H2 collisions there is just to deplete the slope of the global melting curve in comparison to that of pure Ar. In order to test the validity of such hypothesis, we performed a series of AIMD simulations at GPa ( Å3/particle) in which we kept the lattice of H2 molecules frozen and left the lattice of Ar atoms to evolve. Under these conditions we found that fusion of the Ar structure occurs at temperatures K above that of pure Ar, hence the original melting mechanism proposed seems to be corroborated. Analogous melting behavior than described here can be expected in other rare gas-H2 compounds, like Xe(H2)7, and maybe also in SiH4(H2)2 and CH4(H2).
IV Concluding Remarks
To summarize, we have studied the behavior of Ar(H2)2 under pressure at low and high temperatures using computational first-principles techniques. As results, we have unravelled (i) temperature(pressure)-induced solid-solid phase transitions that may resolve the existing discrepancies between the sets of R and IR experimental data, and (ii) an anomalous melting phenomenon consisting of negative melting slope. The atypical melting line of Ar(H2)2 can be understood in terms of the decoupling of H2 and Ar ionic degrees of freedom and of coexistence of same-species liquid and solid phases. Metallization of liquid Ar(H2)2 is predicted at high conditions.
Acknowledgements.
DE acknowledges support of MICINN of Spain (Grants No. CSD2007-00045 and MAT2007-65990-C03-01). The authors acknowledge computational resources on the U.K. National Supercomputing HECToR service.References
- (1) M. Städele and R. Martin, Phys. Rev. Lett 84, 6070 (2000); P. Loubeyre, F. Occelli and R. Letoullec, Nature 416, 613 (2002)
- (2) C. Narayana, H. Luo, H. Orloff and A. L. Ruoff, Nature (London) 393, 46 (1998)
- (3) P. Loubeyre, R. Letoullec and J-P. Pinceaux, Phys. Rev. Lett. 72, 1360 (1994)
- (4) T. A. Strobel, M. Somayazulu and R. J. Hemley, Phys. Rev. Lett. 103, 065701 (2009)
- (5) E. Zurek, R. Hoffmann, N. W. Ashcroft, A. R. Oganov and A. O. Lyakhov, PNAS 106, 17640 (2009)
- (6) F. Datchi, P. Loubeyre, R. Letoullec, A. F. Goncharov, R. J. Hemley and H. K. Mao, Bull. Am. Phys. Soc. 41, 564 (1996)
- (7) S. Bernard, P. Loubeyre and G. Zérah, Europhys. Lett. 37, 477 (1997)
- (8) N. Matsumoto and H. Nagara, J. Phys.: Condens. Matter 19, 365237 (2007)
- (9) M. Somayazulu et al., Nature Chem. 2, 50 (2010)
- (10) H. Chacham and B. Koiller, Phys. Rev. B 52, 6147 (1995)
- (11) C. Cazorla, D. Errandonea and E. Sola, Phys. Rev. B 80, 064105 (2009)
- (12) G. Kresse and J. Furthmüller, Phys. Rev. B 54, 11169 (1996); Y. Wang and J. P. Perdew, Phys. Rev. B 44, 13298 (1991)
- (13) H. J. Monkhorst and J. D. Pack, Phys. Rev. B 13, 5188 (1976)
- (14) G. Kresse, J. Furtmüller and J. Hafner, Europhys. Lett. 32, 729 (1995)
- (15) D. Alfè, Comp. Phys. Comm. 180, 2622 (2009)
- (16) H. Fukui, N. Hirao, Y. Ohishi and A. Q. R. Baron, J. Phys.: Condens. Matter 22, 095401 (2010)
- (17) D. M. Ceperley and B. I. Alder, Phys. Rev. Lett. 45, 566 (1980)
- (18) L. Vočadlo, D. Alfè, M. J. Gillan, I. G. Wood, J. P. Brodholt and G. D. Price, Nature 424, 536 (2003)
- (19) L. Ulivi, R. Bini, P. Loubeyre, R. Letoullec and H. J. Jodl, Phys. Rev. B 60, 6502 (1999)
- (20) S. A. Bonev, E. Schwegler, T. Ogitsu and G. Galli, Nature (London) 431, 669 (2004)
- (21) S. Deemyad and I. Silvera, Phys. Rev. Lett. 100, 155701 (2008)
- (22) E. Pechenik, I. Kelson and G. Makov, Phys. Rev. B 78, 134109 (2008)
- (23) M. J. Gillan, D. Alfè, J. Brodholt, L. Vočadlo and G. D. Price, Rep. Prog. Phys. 69, 2365 (2006); D. Alfè, M. J. Gillan and G. D. Price, Nature 401, 462 (1999).
- (24) I. Tamblyn, J-Y. Raty and S. A. Bonev, Phys. Rev. Lett. 101, 075703 (2008)
- (25) J-Y. Raty, E. Schwegler and S. A. Bonev, Nature 449, 448 (2007)
- (26) S. T. Weir, A. C. Mitchell and W. J. Nellis, Phys. Rev. Lett. 76, 1860 (1996).