Dwarf galaxy populations in present-day galaxy clusters: I. Abundances and red fractions
Abstract
We compare the galaxy population in the Virgo, Fornax, Coma and Perseus cluster to a state-of-the-art semi-analytic model, focusing on the regime of dwarf galaxies with luminosities from approximately L⊙ to L⊙. We find that the number density profiles of dwarfs in observed clusters are reproduced reasonably well, and that the red fractions of model clusters provide a good match to Coma and Perseus. On the other hand, the red fraction among dwarf galaxies in Virgo is clearly lower than in model clusters. We argue that this is mainly caused by the treatment of environmental effects in the model. This explanation is supported by our finding that the colours of central (“field”) dwarf galaxies are reproduced well, in contrast to previous claims. Finally, we find that the dwarf-to-giant ratio in model clusters is too high. This may indicate that the current model prescription for tidal disruption of faint galaxies is still not efficient enough.
keywords:
galaxies: abundances – galaxies: clusters: general – galaxies: dwarf – galaxies: evolution – galaxies: statistics1 Introduction
Dwarf galaxies in nearby clusters display an
intriguing variety in their
properties such as colour and morphology, often accompanied by
differences in their kinematic and spatial distribution. Several
types have been distinguished, such as
dwarf irregulars (dIrr), dwarf ellipticals (dE) and blue compact
dwarf galaxies (BCD) (e.g. Sandage & Binggeli 1984).
Recent studies
have established the presence of even finer subclasses: dEs with
and without nuclei, as well as with and without disk components,
were found to have
different shapes, stellar populations, spatial and kinematic distributions (Lisker et
al. 2006, 2007, 2008, 2009; Toloba et al. 2009; Paudel et al. 2010).
The origin of those subclasses, and the
evolution of cluster dwarf galaxies in general, is not yet well
understood theoretically. The reason for this is partially that the
large dynamic range between a dwarf galaxy and its host cluster makes
it difficult to study them with hydrodynamical simulations.
Semi-analytic models (SAMs, e.g. Kauffmann et al. 1993; Cole et
al. 2000) applied to N-body simulations are therefore a viable
alternative. While SAMs have contributed significantly to our understanding of
higher mass galaxies, they have not been exploited much in the study
of dwarf galaxies, with the exception of the dwarf galaxies in the Local
Group (e.g.
Benson et al. 2002; Macciò et al. 2010; Li et al.
2010; Font et al. 2011). Some basic comparisons between dwarf galaxies
in clusters in SAMs and observations have been made by Kauffmann et al. (1993), Springel et al. (2001) and
Benson et al. (2003), all finding that the shape of the -band cluster
luminosity function is reproduced well down to faint magnitude (with the latter
two neglecting its normalization). Tully et al. (2002) have used a SAM to
infer formation redshifts of cluster dwarf galaxies, while
Nagashima & Yoshii (2004) and
Janz & Lisker (2008, 2009) focus
on scaling relations in dwarf galaxies. In all these studies, SAMs have either been based on analytical
merger trees, or were limited to small volumes.
The new high-resolution Millennium-II simulation (hereafter MS-II,
Boylan-Kolchin et al. 2009) now allows SAMs based on N-body
simulations of a cosmological volume to probe the regime of low mass
galaxies. The first such SAM has recently been publicly
released111SQL databases containing the full galaxy data at all
redshifts and for both the Millennium and MS-II simulations
are publicly released at
http://www.mpa-garching.mpg.de/millennium(Guo et al. 2011,
G11 hereafter). It has been tuned to reproduce the =0 stellar mass
function (SMF hereafter) down to log(, andalso matches
the =0
luminosity function (LF hereafter)
down to reasonably well, making it a
promising tool to understand the origin and evolution of the
different dwarf galaxy types.
Before more detailed studies are conducted, it is however important to check whether the global properties of cluster dwarf galaxies, like their kinematic and spatial distribution, their abundance and their luminosities, agree between the model and observations. In this paper, we therefore concentrate on the global statistics and the colours of dwarf galaxies. We restrict ourselves to the nearby Virgo, Coma, Fornax and Perseus cluster for two reasons. First, it is only in such nearby clusters that we can be confident of obtaining complete samples of faint cluster galaxies (or at least samples with very well known incompleteness). Second, those clusters have been studied extensively, and are often used as benchmarks to draw conclusions about dwarf galaxy formation and evolution in general. It is thus important to know whether or not it is safe to directly compare those clusters to similar mass clusters in the SAM, whether some of them are atypical, and whether the model fails to reproduce some of their properties in general.
In fact, it has been shown that several previous SAMs (e.g. Croton et al. 2006; Bower et al. 2006; Kang et al. 2005) overpredicted the satellite content of groups and clusters (Weinmann et al. 2006b; Liu et al. 2010). It has been argued that this problem is due to the lack of (both partial and full) tidal disruption of satellites in SAMs. This conclusion is supported by additional evidence from the presence of intracluster light (e.g. Zibetti et al. 2004), the need to reconcile the halo occupation statistics with halo merger rates (e.g. Conroy, Ho & White 2007; Yang, Mo & van den Bosch 2009) and the high metallicity of observed satellite galaxies (Pasquali et al. 2010). Satellite disruption has therefore been included in several recent SAMs in various ways (e.g. Benson et al. 2002; Kang & van den Bosch 2008; Kim et al. 2009; Henriquez & Thomas 2010). In the G11 SAM, only full disruption is included, and occurs when the average baryon density in the galaxy falls below that of the surrounding dark matter (see sec. 2.3.1). Possibly as a result of this, the number density profile of relatively massive galaxies in clusters in G11 has been shown to agree well with observations. In this work, we focus on faint galaxies in massive clusters, for which no comparison has been made yet. We find that the match is reasonable, but that the SAM overpredicts the ratio between faint and bright cluster galaxies, which indicates that tidal disruption of low mass galaxies may still be underestimated.
The colours of satellite galaxies, on the other hand, can give us insights into how environment affect star formation in groups and clusters. For satellites more massive than log=9.5, there are strong indications that the main mechanism that is responsible for the quenching of star formation is “starvation”(Larson, Tinsley & Caldwell 1980), which is the gradual removal of the hot gas halo around galaxies (e.g. Weinmann et al. 2006a, 2009; Font et al. 2008; van den Bosch et al. 2008; van der Wel et al. 2010; von der Linden et al. 2010). The previous generation of SAMs mimicked this process by simply removing the entire extended gas reservoir from a galaxy when it became a satellite. This led to too high red fractions in satellite galaxies compared to observations (Weinmann et al. 2006b; Wang et al. 2007, Gilbank & Balogh 2008; Kimm et al. 2009). This issue has been addressed by several more recent SAM in slightly different ways (e.g. Kang & van den Bosch 2008; Font et al. 2008; Weinmann et al. 2010; Kimm et al. 2011). G11 use a gradual stripping of the hot gas by ram-pressure and tidal effects, which is physically well motivated by SPH simulations (e.g. McCarthy et al. 2008). It is thus useful to redo the comparison between model and observations with the current state-of-the-art SAM, and to extend it to fainter galaxies than previously done. We find indications that environmental effects may still be overefficient in G11.
This paper is organised as follows. In section 2, we describe the observational galaxy samples and the SAM. In section 3, we present the results of the comparison between SAM and observations. In section 4 and 5, we discuss and summarize our results. We assume a WMAP1 cosmology (Spergel et al. 2003), following G11, and assume =0.73 for all masses, distances and absolute magnitudes throughout the paper. We note that this cosmology differs from the most recent results from WMAP7 by Komatsu et al. (2011). As discussed in more detail in G11, this affects the abundance of high mass clusters in the model, which probably causes the overprediction of small-scale clustering of low mass galaxies in the SAM. G11 claim that the difference in cosmology does not seem to affect the distribution of galaxies within haloes much.
In all of what follows “central galaxies” are defined as galaxies that are the most massive galaxy in their group, while “satellite galaxies” are all other group galaxies. Isolated galaxies which do not have detected satellites are also called “centrals”.
2 Method
2.1 Observations of Nearby Clusters
In the following subsections we outline our observational galaxy samples for the Virgo, Fornax, Coma and Perseus cluster. We also discuss cluster mass estimates, as they are important for the comparison to the SAM. A more detailed description of the sample selection and the photometry is given in Appendix A. All magnitudes are corrected for Galactic extinction (Schlegel et al. 1998), but generally not k-corrected. Our samples probe the dwarf galaxy regime at luminosities above L⊙.
2.1.1 The Virgo cluster
Our Virgo sample is based on the Virgo Cluster Catalog (VCC, Binggeli et al. 1985; Binggeli et al. 1993), with membership updated by one of us (T.L.) in May 2008 through new velocities given by the NASA/IPAC Extragalactic Database (NED), many of which were provided by the Sloan Digital Sky Survey (SDSS, Adelman-McCarthy et al. 2007). Galaxies with km/s were excluded; the remaining galaxies have velocities of km/s.
Total -band magnitudes and colours from -bands were measured by Lisker et al. (2003), Janz & Lisker (2009), and Meyer et al. (in prep.) on SDSS data release 5 images (Adelman-McCarthy et al. 2007). For a small fraction of the sample, -magnitudes were obtained from the VCC -magnitudes through a type-dependent transformation. We use a distance modulus of mag (Mei et al. 2007; Blakeslee et al. 2009) for all galaxies, corresponding to Mpc, with an uncertainty of 1.4 Mpc, i.e. 0.15 mag (Blakeslee et al. 2009). Our final working sample only includes galaxies with mag, since our sample can be considered complete in down to this value (see Appendix). Only galaxies out to a projected clustercentric distance (calculated from the central galaxy M 87) of 1.5 Mpc, the spatial completeness of the VCC, are included. Due to this limitation, we omit the southern subcluster around M 49.
McLaughlin et al. (1999) estimate a virial radius of 1.5 Mpc for the Virgo cluster (adapted to WMAP1 cosmology), corresponding to a mass of . Together with the finding of Schindler et al. (1999) that the M 87 subcluster is times more massive than the M 49 subcluster, this would yield a mass of for the M 87 subcluster (neglecting the M 86 subcluster contribution), which is the relevant mass for our study. Schindler et al. (1999) estimate a mass of within 1.2 Mpc for the M 87 subcluster, and Urban et al. (2011) estimate a virial mass of . All of these estimates are in agreement with Böhringer et al. (1994), who quote a mass range of for the M 87 subcluster within a radius of 1.5 Mpc (values scaled to our cosmology). We thus estimate the Virgo mass relevant here to be –.
2.1.2 The Fornax cluster
Our Fornax sample is based on the Fornax Cluster Catalog (FCC, Ferguson 1989). By applying the type-dependent transformations derived from the Virgo galaxies to the FCC -magnitudes, we obtain -magnitude estimates.
We use a distance modulus of mag (Blakeslee et al. 2009) for all galaxies, corresponding to Mpc, with an uncertainy of 1.6 Mpc, i.e. 0.17 mag. Our final working sample only includes galaxies down to the completeness limit of mag (see Appendix). The Fornax cluster has two main components, with one subcluster that seems to be infalling for the first time (Drinkwater et al. 2001). In our analysis, only galaxies out to a projected clustercentric distance (calculated from the central galaxy NGC 1399) of 0.9 Mpc are included, which means that we omit the Southwest subcluster. Drinkwater et al. derive a mass of from integrating the velocity amplitude profile, and of from the projected mass virial estimator for the main cluster.
2.1.3 The Coma cluster
We use two different observational samples for the Coma cluster, which we find to be consistent in their region of overlap. The first sample (named “Coma” hereafter) is given by Michard & Andreon (2008), based on spectroscopic and morphological membership criteria and covering the area within 0.5 Mpc of the cluster center. The second sample (“ComaB”) is constructed from SDSS data and, in addition to spectroscopic member galaxies, involves a statistical correction for the number of contaminating background galaxies. Where SDSS redshifts are available, only galaxies with km/s are considered.
Total -band magnitudes and colours from -bands are provided through Petrosian magnitudes of SDSS data release 7 (Abazajian et al 2009). We use a distance modulus of mag (Carter et al. 2008) for all galaxies, corresponding to Mpc. From the table of Carter et al. (2008), we estimate the uncertainty in absolute magnitude to be 0.2 mag. We have checked that this uncertainty (which is the same for Perseus) has virtually no impact on our results. The “Coma” sample is considered complete down to mag (see Appendix) and out to a projected clustercentric distance of Mpc, with the cluster center being defined as midway between the two massive central ellipticals NGC 4874 and NGC 4889. The “ComaB” sample includes, by construction, all galaxies down to mag and out to Mpc.
The best-fit Navarro, Frenk & White (1997, hereafter NFW) profile of Łokas & Mamon (2003) gives a virial radius of 2.8 Mpc for the Coma cluster, enclosing a mass of (using WMAP1 cosmology). This is compatible with the values of Briel et al. (1992), who find a mass of within 3.4 Mpc. It also appears in agreement with Kenn & Gunn (1982), who find a mass of within the much larger radius of 5 Mpc (all values scaled to our cosmology).222 In their introduction, Carlberg et al. (1997) quote a much larger mass value from Kent & Gunn (1982), but they mistakenly multiplied their value with instead of dividing by it.
2.1.4 The Perseus cluster
Our Perseus sample is constructed from the SDSS in a similar way as the ComaB sample, involving a statistical correction for the number of contaminating background galaxies. No SDSS spectra are available in this region. We use a distance modulus of mag, corresponding to Mpc (Struble & Rood 1999, using NED). From the velocity distribution of Perseus galaxies shown in Fig. 1 of Kent & Sargent (1983), it is obvious that the systemic cluster velocity cannot differ by more than 500 km/s from the Struble & Rood (1999) value used by NED to compute the cluster distance. This corresponds to an uncertainty of 0.2 mag in the absolute magnitudes. The sample includes, by construction, all galaxies down to mag. The spatial coverage in the cluster outskirts is incomplete, requiring a statistical completeness correction in the following analysis. Galaxies are considered out to a projected clustercentric distance (calculated from the central galaxy NGC 1275) of Mpc.
The most up-to-date mass estimate for the Perseus cluster is given by Simionescu et al. (2011) as . A larger mass was found by Kent & Sargent (1983), exceeding , yet Eyles et al. (1991) remarked that this mass, inferred from the galaxy distribution, is clearly too high as compared to the mass derived from X-ray data. Eyles et al. (1991) report a mass of within 0.9 Mpc, which is the extent of their data. If we extrapolate the mass profiles for the dark matter333Since only their X-ray profile is given explicitly, but not their dark matter profile, we approximate the latter by , with . This agrees with the profile shown in Eyles et al. (1991) to within few percent outside of the cluster core. and the X-ray gas component as given in Eyles et al. (1991, their Fig. 7) until the total enclosed mass and volume correspond to 200 times the critical density, we obtain a mass of .
2.2 The Yang et al. group catalogue
We use the publicly available SDSS DR4 group catalogue of Yang et al. (2007)444The Yang et al. group catalogue can be downloaded from http://www.astro.umass.edu/xhyang/Group.html for Fig. 7 in this paper, where we compare the colours of low mass/faint satellite and central galaxies in the SAM and the SDSS. This group catalogue has been constructed by applying the halo-based group finder of Yang et al. (2005) to the New York University Value-Added Galaxy Catalogue (NYU-VAGC; see Blanton et al. 2005a). From this catalogue, Yang et al. (2007) selected all galaxies in the main galaxy sample with an extinction-corrected apparent magnitude brighter than and a redshift in the range , with a redshift completeness . We refer the reader to Yang et al. (2007) for a more detailed description.
2.3 The Semi-Analytic Model
Semi-analytic models apply simple analytical recipes to dark matter merger trees generated analytically or from N-body simulations, in order to model the formation and evolution of galaxies over time (e.g. Kauffmann et al. 1993; Cole et al. 2000). Here, we use the SAM by G11, applied to the subhalo merger trees of the MS-II simulation.
The MS-II simulation is a dark matter-only simulation, which was carried out in a periodic box of side 137 Mpc, with a particle mass of . This corresponds to a mass resolution 125 times higher than the Millennium Simulation (Springel et al. 2005), onto which many of the recent SAMs have been built (e.g. Bower et al. 2006, Croton et al. 2006, De Lucia & Blaizot 2007, Font et al. 2009, Neistein & Weinmann 2010). G11 based their model on De Lucia & Blaizot (2007), but modified it in several aspects. In particular, the efficiency of SN feedback for low mass galaxies was increased considerably in order to fit the low mass end of the stellar mass function. Also, the prescriptions used to calculate galaxy sizes and environmental effects have been modified, and the efficiency of AGN feedback was increased. As the prescriptions for environmental effects are most important for this work, we describe them in more detail below.
2.3.1 Environmental effects
In the MS-II simulation, Friend-of-Friend (fof hereafter) haloes are defined by linking particles with separation less than 0.2 of the mean value (Davies et al. 1985). Within these fof haloes, subhaloes are identified using the subfind algorithm (Springel et al. 2001). This means that galaxies within groups and clusters are associated with a dark matter subhalo and follow its orbit, until the subhalo mass falls below the mass of the galaxy, where an analytical prescription for the orbit takes over (see G11).
The treatment of environmental effects in G11 differs notably from most previous SAMs, like De Lucia & Blaizot (2007). We refer the interested reader to G11 for more details, and briefly summarize the most important changes with respect to De Lucia & Blaizot (2007) below. First of all, the definition of a “satellite” galaxy – which is here a galaxy being affected by environment – has changed. In De Lucia & Blaizot (2007), all galaxies belonging to a fof group were considered satellites, while in G11, this is only the case for galaxies which reside inside 555G11 define as the radius of the largest sphere with the potential minimum of the FoF group as its center, and a mean overdensity exceeding 200 times the critical value.. This reduced the total number of satellites at in G11 by a factor of two. Second, going back to Kauffmann et al. (1993), the standard approach in most SAMs has been to immediately strip the extended gas halo when a galaxy became a satellite. In G11, this has been changed. The stripping of the hot gas halo is calculated based on an estimate on the tidal and ram-pressure forces experienced by the satellite, given its orbit within the fof halo, and is thus slower. The prescription is comparable to the one used in Kimm et al. (2011), and more detailed than the ones used in Font et al. (2008) and Weinmann et al. (2010). Finally, no prescription for satellite disruption had been included in most previous SAMs like De Lucia & Blaizot (2007). In G11, it is assumed that “orphan” galaxies (i.e. galaxies without a remaining dark matter subhalo) are disrupted entirely as soon as the host halo density at pericenter exceeds the average baryon density in the satellite. The stars of the disrupted galaxy are then added to the intracluster medium. Partial disruption is not accounted for, and also tidal heating is neglected. The latter leads to an expansion of the system, which would facilitate tidal stripping.
2.3.2 SAM subsamples
Below, we describe the samples of SAM clusters we use to compare with observations. Samples V, F, C, P are used to compare with the Virgo, Fornax, Coma and Perseus cluster respectively. All results are obtained for averaging between 3 sightlines (along the , , and axis of the simulation box). The cluster center is defined as the location of the central galaxy in the fof group, which is placed at the potential minimum of the fof group by the SAM. For sample C, P and V, we consider a galaxy to be a cluster member if it is within +/- 2000 km/s line-of-sight velocity from the cluster center. This is lower than the observational cuts for the Coma sample, and also appears relatively narrow as compared to the velocity dispersion of galaxies in the center of Perseus when not corrected for possible velocity anisotropies, which is km/s (Kent & Sargent 1983). However, we have checked that using 3000 km/s instead for sample C and P makes no difference to any of our results, as extremely few galaxies lie between 2000 and 3000 km/s in the SAM. Note that our selection roughly mimics the method used to select cluster members for Virgo and for the central Coma sample. It specifically includes interlopers which do not belong to the actual fof group, with an interloper fraction of below 5 % in the cluster center, reaching 20 % at 1 Mpc. For all other samples, the observational selection is more complex and cannot be easily mimicked in the SAM. It is possible that completeness and contamination of our SAM samples is slightly different from the observational samples, which we have to bear in mind in what follows.
An outer radial limit of 1 Mpc or 1.5 Mpc in projected cluster-centric distance has been applied in part of the following analysis, as indicated there. We use absolute magnitudes from the SAM, which are computed using the Bruzual & Charlot (2003) stellar evolutionary synthesis models and assuming a model for dust obscuration, as described in G11.
-
•
Cluster Sample V
Sample V encompasses 12 SAM clusters with masses - , with a median mass of . -
•
Cluster Sample F
Sample F contains 37 SAM clusters with masses between and , with a median mass of . A galaxy is assumed to be a F cluster galaxy if it is within +/- 1000 km/s line-of-sight velocity from the cluster center. -
•
Cluster sample C
The cluster sample C only includes the most massive cluster in the model, with a virial mass of . -
•
Cluster Sample P
The cluster sample P includes the three most massive clusters in this model, with virial masses of , and .
The general properties of the SAM clusters are compared to the observed clusters in Fig. 1.
3 Results
3.1 Radial number densities and abundances


In Fig. 1 we show the galaxy abundances and velocity dispersions within 1 Mpc (0.9 Mpc for Fornax and sample F) of the observed clusters and the corresponding clusters in the four SAM comparison samples, for both bright () and faint () galaxies. The velocity dispersion for Perseus is taken from Fadda et al. (1996), where no split according to luminosity is made. Note that this velocity dispersion has been obtained taking into account possible velocity anisotropies, which was not done in the SAM. If no such modelling is included, like in Kent & Sargent (1983), the Perseus velocity dispersion is much higher, at 1300 km/s, in potential disagreement with the SAM. For Fornax, we take the velocity dispersion from Drinkwater et al. (2001) for their entire sample (including the southwestern subcluster) with a division between bright and faint at =-16. The velocity dispersions from Coma and Virgo are estimated from the rms of the available velocities, without clipping. The properties of the observed clusters are in good agreement with the SAM clusters. This is encouraging: Fornax and Virgo do not seem to be atypical compared to simulated clusters, despite indications for a relatively unrelaxed state (e.g. Aguerri et al. 2005; Drinkwater et al. 2001). Fornax has a relatively low number of faint member galaxies compared to the SAM, but is within the scatter of similar mass SAM clusters. Both observed and SAM clusters are in reasonable agreement with estimates of the 1-dimensional velocity dispersion of dark matter particles as measured from simulations by Evrard et al. (2008, grey line in the bottom two panels) and with the same quantity measured in MS-II for our cluster sample (grey crosses in the third panel from top). We thus do not find any indication for a significant velocity bias between dark matter and galaxies here. The only clear systematic difference between SAM and observations is that the ratio between faint and bright galaxies is too high in the SAM.
We highlight this result in Fig. 2, where we show the ratio of faint to bright galaxies (“dwarf-to-giant” ratio) within 1 Mpc from the cluster center (0.9 for Fornax and sample F). All observed clusters (filled coloured triangles) have strikingly similar dwarf-to-giant ratios of 1.5, while SAM clusters (black crosses) have a median dwarf-to-giant ratio of 2.5 for samples V, C and P and of 2.2 for sample F. This corresponds to about 50-70 % too many faint galaxies per bright galaxy. We show the dwarf-to-giant ratio within 0.5 Mpc of the cluster center for the observed clusters as empty coloured triangles. They are again all very similar, and slightly lower than for the more extended region in all clusters. This is in agreement with the decrease of the dwarf-to-giant ratio towards the centers of other clusters (e.g. Sanchez-Janssen et al. 2008). No similar decrease is found for the SAM samples (not shown here), where the median dwarf-to-giant ratio within 0.5 Mpc from the center is 2.1 for sample F, and 2.7 for samples V, C, P, and has a very similar scatter as within 1 Mpc.
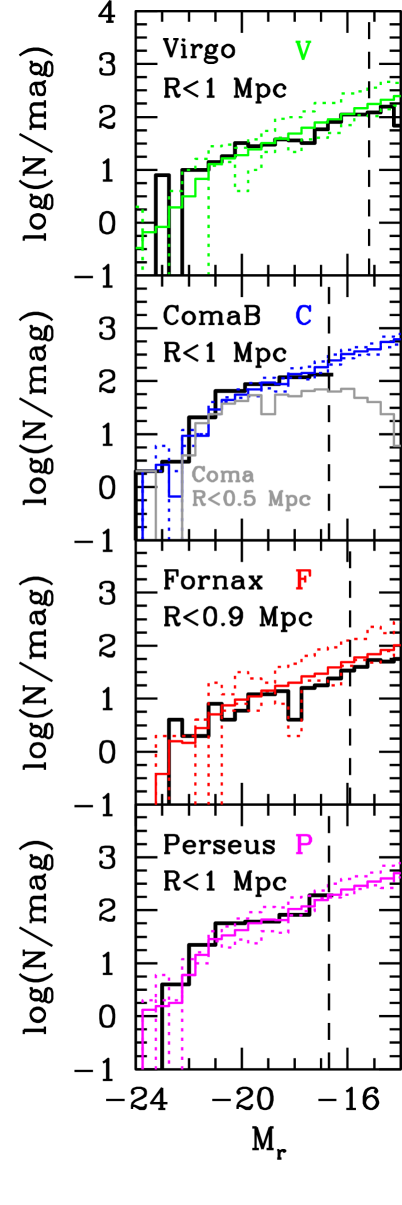
In Fig. 3, we show the LF of Virgo, ComaB, Fornax and Perseus within a projected distance 1 Mpc (0.9 for Fornax) compared to the average LF in the SAM samples with the same radial cut (coloured lines). For Perseus and ComaB, each magnitude bin has been background-corrected separately, as described in the Appendix. In grey, we show the LF of the central region of Coma. Dotted coloured lines denote the LF in the respective SAM samples with the minimum and maximum number of galaxies brighter than the observational limit. Dashed vertical lines indicate the observational completeness limit.
The shape of the LF is different in the SAM and in observations. While the SAM LF has a single slope from to faint magnitudes, the LF of Virgo, Fornax and the central region of Coma show a dip at intermediate luminosities (at for Virgo, for Fornax and for Coma), giving it the appearance of a double-Schechter function. This is in qualitative agreement with previous observational results for the LF in clusters (e.g. Godwin & Peach 1977 for Coma; Binggeli et al. 1988 and McDonald et al. 2009 for Virgo; Popesso et al. 2005; Rines & Geller 2008; Lu et al. 2009). The dip is however not discernible in the background-corrected samples for ComaB and Perseus, perhaps due to the large magnitude bin size we are forced to use there. We check whether a dip occurs in the luminosity function of individual SAM clusters, and indeed find that a dip with a similar magnitude like for Virgo occurs in 1/3 of SAM clusters, at different absolute magnitudes. This may indicate that the dip is not physically significant, but due to chance fluctuations. For all clusters, the ratio between faint and bright galaxies is lower in the observations than in the model, as mentioned above. The decrease of the ratio towards the cluster center can again nicely be seen for the central region of Coma, where the faint end of the LF is flattened. We also find again that Fornax has a low number of faint members, in agreement only with the poorest cluster in sample F.
We note that the median cluster mass of samples C, F, P is somewhat lower (7, 30 and 40 %) than the cluster masses adopted in Fig. 1 and 2 for Coma, Fornax and Perseus respectively. Since this offset lies well within the uncertainties in the mass of the observed clusters, and due to the considerable scatter in the mass-richness relation, we do not scale the galaxy content in the SAM samples to the corresponding observed cluster masses. We have however checked the impact of such a correction on the LFs. We find that the change is minor for sample F. For sample C and P, the scaled version is similar to the LF of the richest clusters (upper dotted line) and is thus in slightly improved agreement for bright galaxies, but in worse agreement at the faint end.
In Fig. 4, we show radial number density profiles for the Virgo, Coma, Fornax and Perseus cluster, compared to the average profiles from samples V, C, F and P respectively. Note that the observational sample has a different absolute magnitude limit for different clusters (see Sect. 2.1). As dotted lines, we show the maximum and minimum data points for each bin in sample V, C, F and P, including all three projections. For Coma, we show the results for both Coma and ComaB (black and red points with errorbars, respectively), which are in excellent agreement.
We find that the SAM successfully reproduces the number density profile of nearby clusters, with the exception of the central regions of the Virgo cluster, where even the minimum SAM profile is substantially higher than the observations. This is also the case if we define the Virgo center as in between the M84 and the M87 galaxy, instead of as the M87 galaxy. Indications for a similar deviation may be present in the Fornax cluster. Again, correcting the profiles for the offset in the cluster mass leads to slightly worse agreement for Perseus and Coma, where the corrected profiles are similar to the maximum profile (upper dotted line).

3.2 Red dwarf galaxies in the Virgo cluster
After having verified that the SAM reproduces the global properties of dwarfs in clusters well, we now examine the red fraction of dwarfs in clusters. For this, we concentrate on the Virgo, Coma and Perseus cluster, as no colour information is available for the Fornax cluster. For Coma and Perseus, we k-correct colours according to the cluster distance as given in 2.1, since we do not have redshifts for all individual member galaxies, using the approximation of Chilingarian et al. (2010).
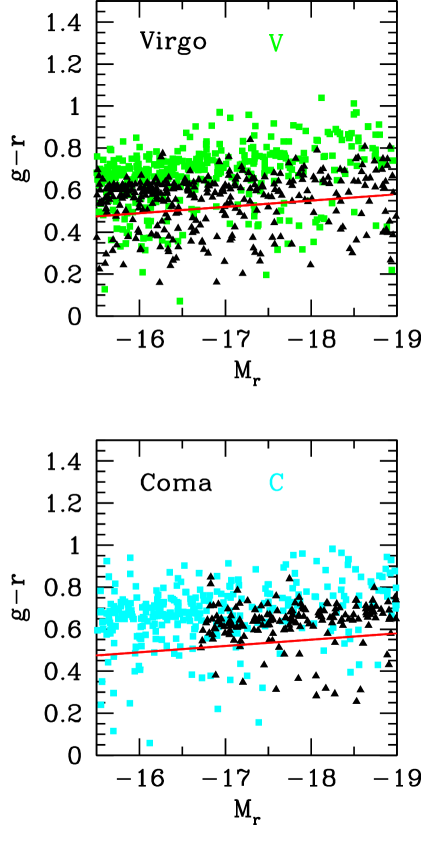
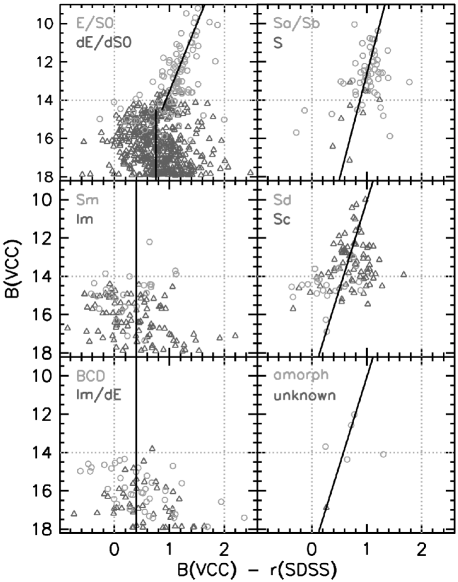
In Fig. 5, we show the colour-magnitude relation for the Virgo sample (top panel) and the Coma sample (bottom panel; note that this only includes the central part of Coma, see sec. 2.1.3), compared to samples V and C. Galaxies in the SAM clearly reach redder colours than in both Coma and Virgo, extending up to 1 at all absolute magnitudes. We find that the very red model galaxies are strongly dust-attenuated, indicating an overestimate of dust in the SAM for some galaxies. But also the bulk of the red sequence is clearly redder in the SAM compared to both clusters. It is unclear why this is the case. Galaxy colours can depend on the details of the stellar population models (e.g. Maraston et al. 2009), but Conroy et al. (2009) find no difference in colours for evolved populations between Maraston (2006) and Bruzual & Charlot (2003). Also, Conroy et al. (2009) find that variations in the initial stellar mass function (IMF) do not affect colours significantly (except in the near-IR). The offset thus may be due to an offset in age or metallicity. We find that the majority of G11 SAM cluster dwarfs have mean stellar ages in excess of 9 Gyr, clearly higher than the observed median stellar ages of Gyr for low mass cluster satellites (Pasquali et al. 2009), but in rough agreement with the observations of Virgo dwarf ellipticals by Roediger et al. (2011).
We split galaxies into red and blue according to
| (1) |
(red line in Fig. 5). This cut is chosen at a relatively blue colour, so that Virgo still has a well-populated red sequence. To compute red fractions for the ComaB and Perseus sample as a function of absolute magnitude and cluster-centric distance, we background-correct the total and red sample separately, as described in the Appendix. For the red fractions as a function of velocity, we only use galaxies in sample ComaB with measured velocities. No velocities are available for the Perseus sample.
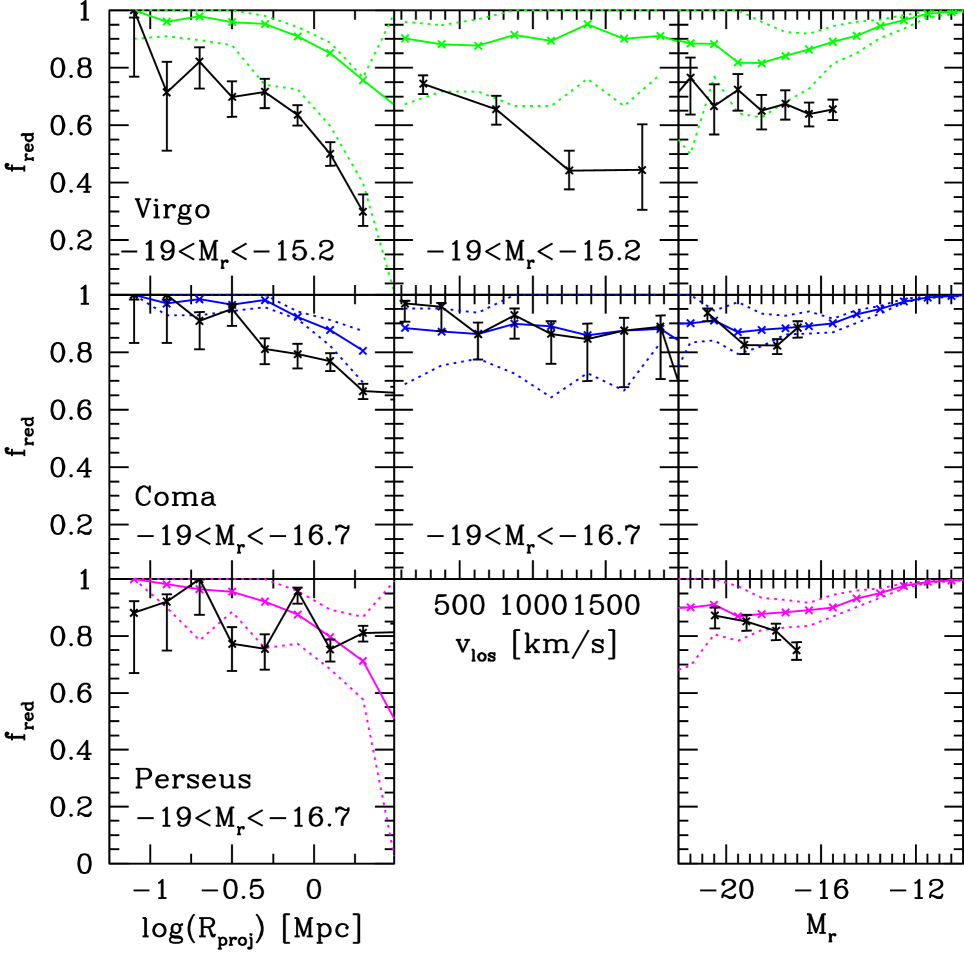
In Fig. 6, we show the fraction of red galaxies as a function of projected cluster-centric radius (left-hand panels, only for faint galaxies, as indicated), the line-of-sight velocity with respect to the cluster center (middle panels, only for faint galaxies as indicated) and the absolute magnitude (right hand panels) for Virgo, ComaB and Perseus and their corresponding SAM samples. Again, dotted lines denote the absolute minimum and maximum of the red fraction in each bins for all SAM clusters considered, in all three projections.
We find that the fraction of red galaxies in the SAM is too high compared to Virgo. The offset seems to be roughly independent of cluster-centric radius, but is strongly increasing with increasing line-of-sight velocity and also increasing towards fainter absolute magnitudes. On the other hand, the red fractions of Coma and Perseus are in good agreement with the model, with some indication that the faintest Perseus galaxies and the galaxies at the outskirts of Coma have a low red fraction compared to the model.
4 Discussion
The high-resolution MS-II simulation provides us with the detailed formation and merger history of small mass haloes, and is thus a useful tool for studying the evolution of dwarf galaxies in clusters. If subhaloes, as well as orphan galaxies (without remaining subhaloes), can be mapped to dwarf galaxies of a given luminosity, then these model galaxies can be compared to the observed dwarf galaxy subpopulations (like BCDs, dEs with and without disk components) through their kinematic and spatial distribution. In this way, one may gain new insight in the origin of those subpopulations. To be able to do this, one needs a technique to populate the MS-II dark matter subhaloes with realistic galaxies. The G11 SAM is an obvious choice, as it is the first SAM applied to the MS-II simulation. However, this model suffers from some limitations. While G11 reproduce the stellar mass function measured in the SDSS by Li & White (2009) to within 30 - 40 % down to and to within 20 % at , the colour distribution of galaxies with is not matched well, with the model displaying a clear red peak that is not observed in the SDSS. G11 explain this with low mass galaxies forming too early in the model and being too passive today in general. This is similar to the claim of Fontanot et al. (2009), who find that several current SAMs have a fundamental problem, in that galaxies with masses form too early and have too little star formation today.
Given that the stellar mass function is reproduced reasonably well, it is not surprising that G11 predict a stellar mass to halo mass relation for central galaxies in agreement with predictions from abundance matching by Guo et al. (2010) to within 0.2 dex down to . However, the match for cluster satellites may be less good due to the potential problems with the early history of low mass galaxies, and the fact that satellites in massive clusters tend to form at higher redshift than field galaxies (e.g. Tully et al. 2002; Neistein et al. 2011). It is therefore necessary to compare the general properties of cluster galaxies in the SAM and in observations before more detailed studies are undertaken. We discuss below the results we have obtained in our comparison.
4.1 Abundances and number density profiles of dwarf galaxies
4.1.1 Success in reproducing general properties
It has been found in previous studies (e.g. Weinmann et al. 2006b; Liu et al. 2010) that SAMs like Croton et al. (2006) or Bower et al. (2006) strongly overpredicted the number of satellites in groups and clusters. G11 claim that their improved model reproduces the number density profiles of galaxies with masses above in massive clusters. In this study, we find that also the number density profile of faint galaxies (in a fixed absolute magnitude range) in massive clusters is well reproduced by G11. The agreement can partially be fortuitous, as the too red colours of SAM dwarfs indicate that they will be too faint at given stellar mass, and there might still be an overproduction of dwarfs at given stellar mass. We do not use stellar mass estimates in our current study as (i) published SDSS stellar masses for low mass members of Virgo are unreliable due to the problems with sky subtraction (see Appendix) and (ii) no SDSS data are available for the Fornax cluster.
The improvement with respect to previous comparisons regarding the abundance of cluster satellites is mainly due to the changes in the SAM, probably the inclusion of satellite disruption, or the more efficient stellar feedback. We have checked this by comparing the conditional stellar mass functions in groups (see Liu et al. 2010), in G11 and De Lucia & Blaizot (2007), and found that they are lower in G11 and thus closer to the observational results by Liu et al. (2010) than has been the case for the model of De Lucia & Blaizot (2007).
The flattening in the number density profile towards the center of Virgo (and perhaps also Fornax) is interesting, since no comparable mass SAM cluster shows a similar feature. The most obvious explanation may be that Virgo is a dynamically young cluster. However, it is then curious that no cluster with a similar profile shows up in the MS-II simulation box, as about 1/3 of observed clusters are found to fall into the same class as Virgo according to several cluster classification schemes (Rood & Sastry 1971; Bahcall 1977). However, of course it is possible that Virgo is still a special case within this class.
In all, the deviations in the general properties of cluster dwarf galaxies between the SAM and observations are relatively small, which shows that the SAM can be used to predict in which subhaloes [or on which orphan trajectories] galaxies of a given absolute magnitude should reside. However, some puzzling differences remain.
4.1.2 The dwarf-to-giant ratio: An indication for insufficient tidal disruption?
We find that the dwarf-to-giant ratio in all SAM clusters is high compared to observations (Fig. 2). This problem seems confined to clusters, as the dwarf-to-giant ratio seen in the general -band LF is, if anything, too low in the SAM (see Fig. 8 of G11). Also, there is a small, but consistent decrease in the dwarf-to-giant ratios towards the center of all clusters which is not found in the SAM. This seems to be in agreement with the decrease in the dwarf-to-giant ratio towards the centers of other clusters (Pracy et al. 2004; Sanchez-Janssen et al. 2008; Barkhouse et al. 2009), and the higher velocity dispersion of dwarfs compared to giants in Fornax (Drinkwater et al. 2001) and Virgo (Conselice et al. 2001).
It is clear that the dwarf-to-giant ratio in the SAM could be decreased by either increasing the disruption efficiency for faint galaxies (possibly especially for slow galaxies in the cluster core), or by not forming them in the first place. Decreasing galaxy formation efficiency for low mass haloes at high redshift would be an attractive solution, since it would also decrease stellar ages, and make colours bluer. However, it is not clear what could be the physical cause for such a decreased efficiency (e.g. Fontanot et al. 2009). Enhanced tidal disruption may be easier to justify. Diemand et al. (2004) point out that tidal disruption should be especially efficient for slow subhaloes. This would explain the broader spatial and velocity distribution for dark matter subhaloes compared to the dark matter particles (e.g. Ghigna et al. 2000; Gao et al. 2004; Diemand et al. 2004). Therefore, strong tidal disruption for faint galaxies would not only lead to a lower dwarf-to-giant ratio, but also a broader spatial and velocity distribution of the affected population, leading to a decrease of the dwarf-to-giant ratio towards the cluster center. We note that alternative explanations have been suggested for a low central concentration and high velocity dispersion of dwarfs in clusters. Drinkwater et al. (2001) and Conselice et al. (2001) suggest that dwarf galaxies in Virgo and Fornax are an infalling population, while White (1976) predict the same effect from energy equipartition between high and low mass galaxies for a relaxed population.
Assuming that insufficient tidal disruption is the main cause of the discrepancies mentioned above, it is useful to check the importance of this effect in G11. We find that disruption in this model is insignificant at lower redshift, where of cluster galaxies are disrupted per Gyr. It is more important at higher redshift, with a disruption efficiency of 0.6 % per Gyr at z=2, and 1.2 % per Gyr at z=4 in the most massive clusters at these times. The increase of tidal stripping with redshift is in qualitative agreement with some earlier results (Giocoli et al. 2008; Tinker & Wetzel 2010; Weinmann et al. 2010, De Lucia et al. 2010, but see also Murante et al. 2007). Interestingly, we find in our checks that the disruption efficiency in the SAM is roughly independent of the stellar mass of the galaxy – a similar fraction of massive and dwarf galaxies in clusters is disrupted, in agreement with the result of Weinmann et al. (2010) for subhaloes. This may be the result of two competing effects: On the one hand, at a fixed orbital radius, the tidal radius goes roughly as with the satellite mass and the host halo mass (Binney & Tremaine 1987). At fixed cluster mass, lower mass galaxies will thus be stripped more. On the other hand, the dynamical friction times are shorter for high mass satellites at a given cluster mass, and thus these galaxies reach the region where stripping is efficient earlier. Some SAMs (e.g. Kim et al. 2009) ignore the second effect, and assume that the tidal stripping efficiency for satellites is proportional to . While this may help with the problems outlined above, since it will destroy relatively more dwarf galaxies compared to massive galaxies, a detailed physical justification for such a scaling has yet to be established. Other models assume the opposite dependence, with the tidal stripping efficiency scaling as (Wetzel & White 2010), with some indirect support from observational results (Yang et al. 2009).
We have checked whether a simple increase in the disruption efficiency in the SAM can solve the problem, by assuming that all orphan galaxies (i.e. galaxies which have lost their associated dark matter halo) are completely disrupted, following Henriques et al. (2008). This is the most extreme case for the current implementation of disruption in G11 since only orphan galaxies are eligible for disruption in the first place. We find that this does not change the average dwarf-to-giant ratio in SAM clusters significantly. It seems therefore that the solution would have to involve a different parametrization for disruption than the one used in G11, which prefers disruption of low mass galaxies, like suggested by Kim et al. (2009). Maybe taking into account tidal heating, which leads to the expansion of affected systems, and make them more vulnerable to tidal stripping, or the inclusion of partial tidal disruption, would help.
We note that increasing the fraction of tidally disrupted dwarfs in the SAM will not lead to disagreement with predictions for the intracluster light. Even if all dwarf galaxies in massive clusters were additionally completely disrupted, this would only change the stellar mass in the intracluster stars by compared to G11. This is a clear improvement compared to earlier SAMs, where disrupting all the surplus galaxies would have led to an overprediction of the intracluster light (Liu et al. 2010). This is due to the fact that the number of massive cluster galaxies are better reproduced by G11 than by earlier models.
Clearly, more work is needed to understand this issue better, and in particular to disentangle the effects of low mass galaxy formation on one hand, and disruption and gas stripping in clusters on the other hand. To this aim, it would perhaps be helpful to study the evolution of the dwarf-to-giant ratio (defined according to mass) with redshift both in the field and in clusters, and compare with the SAM. Previous results suggest a significant evolution in the red dwarf-to-giant ratio in clusters (De Lucia et al. 2007, Gilbank & Balogh 2008, Lu et al. 2010), but this does not have to hold for the total dwarf-to-giant ratio.
4.2 Red fractions
The red fractions for model clusters are in good agreement with Coma and Perseus, but clearly higher than what is observed in the Virgo cluster (Fig. 6). This could have at least four different reasons:
-
1.
The red fraction of cluster galaxies in the SAM are correct. Virgo is an extreme case of a very unevolved cluster, which is so rare that it does not show up in the MS-II simulation box. Indeed, Virgo is probably dynamically young, given its clumpy X-ray distribution and inhomogeneous intracluster light (e.g. Binggeli et al. 1987 and Aguerri et al. 2005). However, as mentioned before, according to Bahcall (1977), about 1/3 of all clusters should probably be similarly unrelaxed.
-
2.
The problem is mainly due to too high red fractions in the population of central (“field”) dwarf galaxies in the SAM, coming from a too early formation of those galaxies. The efficiency of star formation quenching due to environment in the SAM is correct. This corresponds to the interpretation given in G11 where they say that the principal reason for too red satellites in the model is that central galaxies are too passive.
-
3.
The problem is mainly due to overefficient quenching of star formation in satellite galaxies. Its severity depends on the formation history of the cluster. If most galaxies have been satellites for a long time, as might be the case in Coma, the problem is hidden. If there is a significant population of galaxies which have fallen in relatively recently, as in Virgo, the problem becomes apparent, since such galaxies are already red in the SAM and still blue in the observational data.
-
4.
The solution is to remove the reddest of dwarf galaxies in clusters. This would bring both abundances and red fractions into better agreement: It would bring the 80 % red galaxies at =-15.5 in the bluest SAM cluster down to 60 %, in agreement with Virgo. This might be achieved by increasing tidal disruption for low mass galaxies, as discussed in section 4.1.2, or by inhibiting the formation of those galaxies at high redshift in the first place (see also Liu et al. 2010).
Another explanation could be an extremely high interloper fraction in Virgo. We however consider this to be unlikely, as the total number of member galaxies, and their velocity dispersion, seems in good agreement with what is expected for the Virgo mass, calculated from the X-ray properties of the gas, e.g. by Schindler et al. (1999). Also, there is a clear discrepancy between the red fraction in the SAM and in Virgo already in the central part of the cluster, where the interloper fraction should be lowest.
4.2.1 Comparison between the SAM and the Yang et al. group catalogue
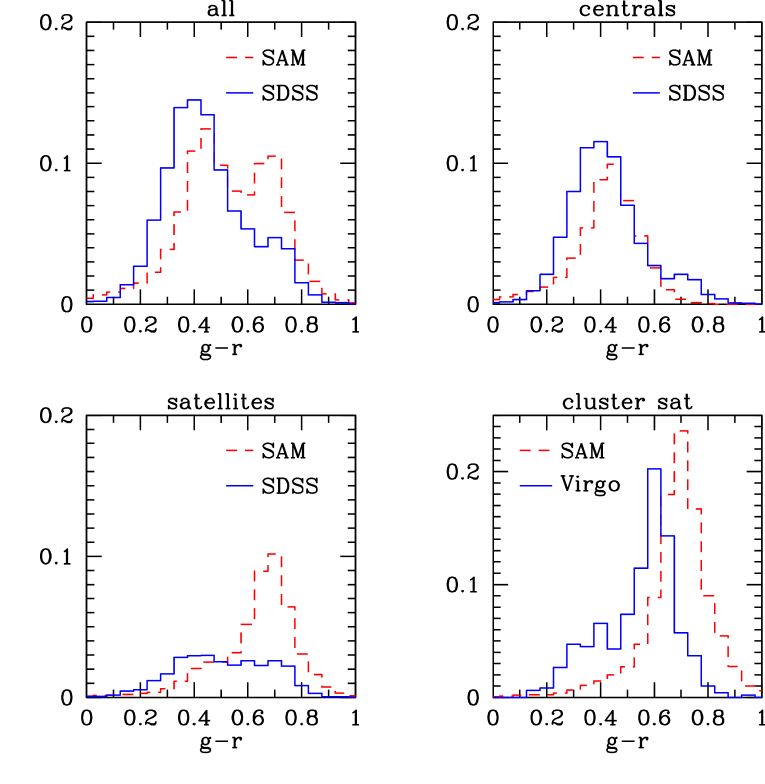
To find out which of the above scenarios is most likely, we make a comparison of colours of central and satellite galaxies in the SAM and the Yang et al. (2007) group catalogue based on the SDSS. About 70 % of all satellites in this catalogue reside in groups with masses , making it complementary to the cluster sample we have used above. In the observations, the number of galaxies is weighted according to the inverse of the maximum volume out to which they can be observed given their absolute magnitude. Colours are k-corrected to z=0.0. Results are shown in Fig. 7 for galaxies with .
By splitting the population into centrals and satellites both in the observations and in the model, we see where the discrepancy between the SAM and the observations comes from. Clearly, the main problem are the satellite galaxies, which are much redder and more abundant than in the observations (bottom left panel of Fig. 7), and practically solely responsible for the red peak in the model. This indicates that explanations (i) and (ii) probably do not apply – the problem is not only confined to the Virgo cluster, but also appears in lower mass groups, and the problem does not seem to originate from the colours of central galaxies, which are roughly correct. We have also checked the colour distribution in the stellar mass bin =8-8.5 both in the SAM and in the SDSS, and found similar results, with a pronounced red peak in the SAM mainly originating from the satellite population that is missing in the SDSS.
4.2.2 Too red colours of satellites galaxies
The too red colours of satellite galaxies indicate that either environmental effects are still overefficient in G11 (option iii) or that red satellites need to be destroyed or their formation needs to be hindered (option iv). Both options seem viable. It is well possible that the prescription for environmental effects used by G11 is incorrect for groups, as ram-pressure stripping in those environments is likely overestimated due to an overestimate in the hot gas content of groups (Bower et al. 2008; Weinmann et al. 2010). A potential indication for overefficient ram-pressure stripping is that the deviation between red fractions in SAM and Virgo is strongest at high line-of-sight velocities and for faint galaxies (Fig. 6), where ram-pressure stripping is likely most efficient. It is also possible that tidal disruption is significantly stronger than assumed in G11. As mentioned before, there is no consensus in the models whether the tidal stripping efficiency for a satellite with mass newly infalling into a group with mass scales roughly with (Kim et al. 2009), with (Wetzel & White 2010), or is approximately independent of the ratio (Weinmann et al. 2010). If it scales with , tidal disruption of faint galaxies will be important for low mass groups and can thus help to remove red galaxies in these environments (see also below). On the other hand, it will then naturally be less significant in massive clusters, where it may be needed to resolve the issues discussed in Sec. 4.1.2. Overefficient early galaxy formation, on the other hand, seems a less likely explanation, as its impact should be smallest in low mass groups (that form latest), which is inconsistent with our results.
4.2.3 Discrepancy in the fraction of satellites
Another discrepancy concerns the fraction of satellites in the model and the observations. At , there are only 27 % satellites in the Yang et al. catalogue (including volume-weighting), but in the SAM if satellites outside of are counted, and if those are not counted. This means that either (a) there are too many satellite galaxies in the SAM, or that (b) a significant fraction of SDSS satellites is not detected, or (c) a significant fraction of SDSS satellites is misclassified as centrals. It is possible that there is a contribution from effect (b), as the SDSS spectroscopic sample is incomplete due to fiber collisions, and this problem becomes more severe in dense regions dominated by satellite galaxies (with the incompleteness reaching around 60 % close to cluster centers according to G11). Point (c) seems not significant, as tests indicate that there are more centrals wrongly classified as satellites than the other way around (Weinmann et al. 2009). But if the satellite galaxies that are missed in the SDSS have a similar colour distribution as the ones that are detected, incompleteness will not solve the discrepancy in the colour distribution between SDSS and SAM. Removal of low mass satellites by tidal disruption would of course help resolving the problem of overabundant faint satellites. Also, note that using a cosmology with a lower (like WMAP7) will reduce the fraction of satellites compared to WMAP1 slightly (e.g. van den Bosch et al. 2007).
4.2.4 The colours of central galaxies
The deviation between model and observations for the central galaxies is quite small, with an offset in the blue peak of central galaxies of around 0.05 for , and a somewhat too low fraction of galaxies with 0.4 in the SAM (see Fig. 7, top right panel). This is surprising, as several recent studies have claimed that there is a serious problem at the low mass end in SAMs, in that low mass galaxies form too early and are too passive and red today (e.g Fontanot et al. 2009, G11). It has been argued that the same problem manifests itself in the missing evolution of the low mass end of the stellar mass function in the SAM (G11) and in an overproduction of star forming galaxies at (Lo Faro et al. 2009). Similar problems have been found in hydrodynamical simulations, where the specific star formation rate (sSFR hereafter) of low mass galaxies are too low by an order of magnitude (Avila-Reese et al. 2011; Davé et al. 2011). We find here that faint central galaxies are mostly blue and star forming, with a passive fraction (defined as -11) of only 25 %, which may be explained with an intermittent phase in a bursty star formation history. We have checked that the sSFR–stellar mass relation in G11 is similar to that in De Lucia & Blaizot (2007), as shown in Fontanot et al. (2009). At low masses of , sSFR are thus lower by about 0.5 dex than those estimated by Salim et al. (2007), but similar to those measured by Gilbank et al. (2011). Colours are however maybe the better indicator to use for low mass galaxies with possibly stochastic SF histories, as they measure star formation on longer timescales that the usual SF indicators, and can be observed directly. Fontanot et al. (2009) have pointed out that the mismatch in the properties of low mass galaxies could indicate a fundamental problem in our understanding of high redshift baryonic physics. The good match in the colours of central galaxies found here challenges this interpretation, and indicates that the issue has to be investigated in more detail.
5 Summary
We compare the properties of dwarf galaxies in the nearby clusters Virgo, Coma, Fornax and Perseus to the G11 SAM and find that their abundances, velocity dispersions and number density profiles are reproduced well by the model. This is encouraging for future studies, in which the spatial and dynamical distribution of different subpopulations of dwarf galaxies within a given environment may be matched to SAM cluster galaxies to investigate their origin.
We find that Coma and Perseus resemble a typical SAM cluster in several important aspects, including the red fraction of galaxies. On the other hand, no SAM cluster with comparable mass displays red fractions of faint galaxies as low as the Virgo cluster. By comparing the colours of central and satellite galaxies in the SAM to the Yang et al. (2007) group catalogue, we show that the too high red fraction in the SAM clusters compared to Virgo is likely mainly due to an overestimate of environmental effects in the model, possibly related to overefficient ram-pressure stripping of the extended gas reservoir of group galaxies. This problem may be excerbarated by insufficient tidal disruption of low mass galaxies in the SAM, which lets too many old, red dwarf galaxies survive. The colours of satellite galaxies are also the origin of the mismatch in the general colour distribution of low mass galaxies between the SAM and the SDSS. This interpretation differs from the one given in G11, where it was argued that a too early formation of dwarf galaxies in general is the main reason for this.
Furthermore, we find that the dwarf-to-giant ratio in SAM clusters is high compared to observations. We argue that the most likely explanation for this difference is that the SAM underestimates tidal disruption for faint galaxies. In addition, we point out that the low number of faint galaxies in the center of Virgo is not reproduced in the SAM.
Acknowledgments
We thank the anonymous referee for useful comments which helped to improve the manuscript. We also thank Frank van den Bosch, Simon White, Ben Moore, Michael Balogh and Gabriella De Lucia for helpful comments and suggestions, and Cheng Li, Marijn Franx, Joop Schaye, Stefania Giodini, Marcel Haas and Alexander Hansson for useful discussion.
T.L. and J.J. are supported within the framework of the Excellence Initiative by the German Research Foundation (DFG) through the Heidelberg Graduate School of Fundamental Physics (grant number GSC 129/1). H.T.M. is supported by the DFG through grant LI 1801/2-1. J.J. acknowledges support by the Gottlieb Daimler and Karl Benz Foundation.
SQL databases containing the full galaxy data for the SAM of G11 at all redshifts and for both the Millennium and Millennium-II simulations are publicly released at http://www.mpa-garching.mpg.de/millennium. The Millennium site was created as part of the activities of the German Astrophysical Virtual Observatory.
Funding for the SDSS and SDSS-II has been provided by the Alfred P. Sloan Foundation, the Participating Institutions, the National Science Foundation, the U.S. Department of Energy, the National Aeronautics and Space Administration, the Japanese Monbukagakusho, the Max Planck Society, and the Higher Education Funding Council for England. The SDSS Web Site is http://www.sdss.org/. The SDSS is managed by the Astrophysical Research Consortium for the Participating Institutions. The Participating Institutions are the American Museum of Natural History, Astrophysical Institute Potsdam, University of Basel, University of Cambridge, Case Western Reserve University, University of Chicago, Drexel University, Fermilab, the Institute for Advanced Study, the Japan Participation Group, Johns Hopkins University, the Joint Institute for Nuclear Astrophysics, the Kavli Institute for Particle Astrophysics and Cosmology, the Korean Scientist Group, the Chinese Academy of Sciences (LAMOST), Los Alamos National Laboratory, the Max-Planck-Institute for Astronomy (MPIA), the Max-Planck-Institute for Astrophysics (MPA), New Mexico State University, Ohio State University, University of Pittsburgh, University of Portsmouth, Princeton University, the United States Naval Observatory, and the University of Washington.
This research has made use of the VizieR catalogue access tool, CDS, Strasbourg, France, of NASA’s Astrophysics Data System Bibliographic Services, of the NASA/IPAC Extragalactic Database (NED) which is operated by the Jet Propulsion Laboratory, California Institute of Technology, under contract with the National Aeronautics and Space Administration, and of the “K-corrections calculator” service available at http://kcor.sai.msu.ru/.
References
- [\citeauthoryearAbazajian, Adelman-McCarthy, Agüeros, Allam, Allende Prieto, An, Anderson, Anderson, Annis, Bahcall, Bailer-Jones & BarentineAbazajian et al.2009] Abazajian K. N., et. al. 2009, ApJS, 182, 543
- [Adelman-McCarthy et al.(2007)Adelman-McCarthy, Agüeros, Allam, Anderson, Anderson, Annis, Bahcall, Bailer-Jones, Baldry, Barentine, Beers, Belokurov, Berlind, Bernardi, Blanton, Bochanski, Boroski, Bramich, Brewington, Brinchmann, Brinkmann, Brunner, Budavári, Carey, Carliles, Carr, Castander, Connolly, Cool, Cunha, Csabai, Dalcanton, Doi, Eisenstein, Evans, Evans, Fan, Finkbeiner, Friedman, Frieman, Fukugita, Gillespie, Gilmore, Glazebrook, Gray, Grebel, Gunn, de Haas, Hall, Harvanek, Hawley, Hayes, Heckman, Hendry, Hennessy, Hindsley, Hirata, Hogan, Hogg, Holtzman, Ichikawa, Ichikawa, Ivezić, Jester, Johnston, Jorgensen, Jurić, Kauffmann, Kent, Kleinman, Knapp, Kniazev, Kron, Krzesinski, Kuropatkin, Lamb, Lampeitl, Lee, Leger, Lima, Lin, Long, Loveday, Lupton, Mandelbaum, Margon, Martínez-Delgado, Matsubara, McGehee, McKay, Meiksin, Munn, Nakajima, Nash, Neilsen, Newberg, Nichol, Nieto-Santisteban, Nitta, Oyaizu, Okamura, Ostriker, Padmanabhan, Park, Peoples, Pier, Pope, Pourbaix, Quinn, Raddick, Re Fiorentin, Richards, Richmond, Rix, Rockosi, Schlegel, Schneider, Scranton, Seljak, Sheldon, Shimasaku, Silvestri, Smith, Smolčić, Snedden, Stebbins, Stoughton, Strauss, SubbaRao, Suto, Szalay, Szapudi, Szkody, Tegmark, Thakar, Tremonti, Tucker, Uomoto, Vanden Berk, Vandenberg, Vidrih, Vogeley, Voges, Vogt, Weinberg, West, White, Wilhite, Yanny, Yocum, York, Zehavi, Zibetti, & Zucker] Adelman-McCarthy, J. K., et. al. 2007, ApJS, 172, 634
- [] Aguerri, J. A. L., Gerhard, O. E., Arnaboldi, M., Napolitano, N. R., Castro-Rodriguez, N., Freeman, K. C., 2005, AJ, 129, 2585
- [] Avila-Reese V., Colín P, González-Samaniego A., Valenzuela O., Firmani C., Veláquez H., Ceverino D., 2011, preprint, arXiv:1103.4422
- [] Bahcall N.A., 1977, Ann. Rev. Astrophysics, 15:505-40
- [] Barkhouse W.A., Yee H.K.C., López-Cruz O., 2009, ApJ, 703
- [] Benson A.J., Lacey C.G., Baugh C.M., Cole S., Frenk C.S., 2002, MNRAS, 333, 156
- [] Benson A.J., Frenk C.S., Baugh C.M., Cole S., Lacey C.G., 2003, MNRAS, 343, 679
- [] Bernardi, M. , Alonso, M. V., da Costa, L. N., Willmer, C. N. A., Wegner, G., Pellegrini, P. S., Rité, C., Maia, M. A. G., 2002, AJ, 123, 2990
- [] Bettoni D., Galletta G., 1994, A&A, 281, 1
- [] Binggeli B., Popescu C. C., Tammann G. A., 1993, A&AS, 98, 275
- [] Binggeli, B., Sandage, A., Tammann, G. A., 1988, ARA&A, 26, 509
- [] Binggeli, B., Tammann, G. A., & Sandage, A. 1987, AJ, 94, 251
- [] Binggeli, B., Sandage, A., & Tammann, G. A. 1985, AJ, 90, 1681
- [] Binney J., Tremaine S., 1987, Galactic Dynamics. Princeton Univ. Press, Princeton, NJ
- [] Blakeslee J. P., Jordán A., Mei S., Côté P., Ferrarese L., Infante L., Peng E. W., Tonry J. L., West M. J., 2009, ApJ, 694, 556
- [] Blanton M.R., Eisenstein D., Hogg D.W., Schlegel D.J., Brinkmann J., 2005a, AJ, 629, 143
- [] Blanton M.R., Lupton R.H., Schlegel D.J., Strauss M.A., Brinkmann J., Fukugita M., Loveday J., 2005b, ApJ, 631, 208
- [] Böhringer H., Briel U. G., Schwarz R. A., Voges W., Hartner G., Trümper J., 1994, Nature, 368, 828
- [] Boylan-Kolchin M., Springel V., White S.D.M., Jenkins A., Lemson G., 2009, MNRAS, 398, 1150
- [] Bower R.G., Benson A.J., Malbon R., Helly J.C., Frank C.S., Baugh C.M., Cole S., Lacey C.G., 2006, MNRAS, 370, 645
- [] Bower R.G., McCarthy I.G., Benson A.J., 2008, MNRAS, 390, 1399
- [] Briel U. G., Henry J. P., Boehringer H., 1992, A&A, 259, L31
- [] Cameron E., 2010, preprint, arXiv:1012.0566
- [] Carlberg R. G., Yee H. K. C., Ellingson E., 1997, ApJ, 478, 462
- [] Carter D. et al., 2008, ApJ, 176, 424
- [] Chiboucas K., Tully R. B., Marzke R. O., Trentham N., Ferguson H. C., Hammer D., Carter D., Khosroshahi H., 2010, ApJ, 723, 251
- [] Chilingarian, I. V., Prugniel, P., Sil’Chenko, O. K., Afanasiev, V. L., 2007, MNRAS, 376, 1033
- [] Chilingarian, I., Melchior, A.-L., Zolotukhin, I. 2010, preprint, arXiv:1002.2360
- [] Cole S., Lacey C.G., Baugh C.M., Frenk C.S., 2000, MNRAS, 319, 168
- [] Conroy C., Ho S., White S.D.M., 2007, MNRAS, 379, 1491
- [] Conselice C.J., Gallagher J.S. III, Wyse R.F.G., 2001, ApJ, 559, 791
- [] Conselice C. J., Gallagher III J. S., Wyse R. F. G., 2002, AJ, 123, 2246
- [] Cortese, L., Gavazzi, G., Iglesias-Paramo, J., Boselli, A., Carrasco, L., 2003, A&A, 401, 471
- [] Croton D.J. et al., 2006, MNRAS, 365, 11
- [] Davé R., Oppenheimer B.D., Finlator K., 2011, preprint, arXiv:1103.3528
- [] De Lucia G., Boylan-Kolchin M., Benson A.J., Fontanot F., Monaco P., 2010, MNRAS, 406, 1533
- [] De Lucia G., Blaizot J., 2007, MNRAS, 375, 2
- [] De Lucia G. et al., 2007, MNRAS, 374, 809
- [] Denicoló, G., Terlevich, R., Terlevich, E., Forbes, D. A., Terlevich, A., Carrasco, L., 2005, MNRAS, 356, 1440
- [] de Vaucouleurs, G., de Vaucouleurs, A., Corwin, Jr., H. G., Buta, R. J., Paturel, G., Fouque, P., 1991, Third Reference Catalogue of Bright Galaxies, Volume 1-3
- [] Diemand J., Moore B., Stadel J., Kazantzidis S., 2004, MNRAS, 348, 977
- [] di Nella H., Garcia A.M., Garnier R., Paturel G., 1995, A&A, 113, 151
- [] Drinkwater, M. J., Currie, M. J., Young, C. K., Hardy, E., Yearsley, J. M., 1996, MNRAS, 279, 595
- [] Drinkwater M. J., Gregg M. D., Colless M., 2001, ApJ, 548, L139
- [] Evrard A.E. et al., 2008, ApJ, 672, 122
- [] Evstigneeva, E. A., Gregg, M. D., Drinkwater, M. J., Hilker, M., 2007, AJ, 133, 1722
- [] Eyles C. J., Watt M. P., Bertram D., Church M. J., Ponman T. J., Skinner G. K., Willmore A. P., 1991, ApJ, 376, 23
- [] Fadda D., Girardi M., Guiricin G., Mardirossian F., Mezzetti M., 1996, apj, 473, 670
- [] Falco, E. E., Kurtz, M. J., Geller, M. J., Huchra, J. P., Peters, J., Berlind, P., Mink, D. J., Tokarz, S. P., Elwell, B., 1999, PASP, 111, 438
- [] Ferguson H. C., 1989, AJ, 98, 367
- [] Fisher, K. B., Huchra, J. P., Strauss, M. A., Davis, M., Yahil, A., Schlegel, D., 1995, ApJ, 100, 69
- [] Font A.S., et al., 2008, MNRAS, 389, 1619
- [] Font A.S., et al., 2011, preprint, arXiv:1103.0024
- [] Fontanot F., De Lucia G., Monaco P., Somerville R.S., Santini P., 2009
- [] Gao L., De Lucia G., White S.D.M., Jenkins A., 2004, MNRAS, 352, 1
- [] Gavazzi, G., Boselli, A., Scodeggio, M., Pierini, D., Belsole, E., 1999, MNRAS, 304, 595
- [] Gavazzi, G., Bonfanti, C., Pedotti, P., Boselli, A., Carrasco, L., 2000, A&A, 146, 259
- [] Gavazzi, G., Zaccardo, A., Sanvito, G., Boselli, A., Bonfanti, C., 2004, A&A, 417, 499
- [] Gavazzi, G., O’Neil, K. Boselli, A. van Driel, W., 2006, A&A, 449, 929
- [] Ghigna S., Moore B., Governato F., Lake G., Quinn T., Stadel J., 2000, ApJ, 614, 17
- [] Gilbank D.G., Balogh M.L., 2008, MNRAS, 385, 116
- [] Gilbank D.G. et al., 2011, preprint, arXiv:1101.3780
- [] Giovanelli, R., Avera, E., Karachentsev, I. D., 1997, 114, 122
- [] Giovanelli R. et al., 2007, AJ, 133, 2569
- [] Giocoli C., Tormen G., van den Bosch F.C., 2008, MNRAS, 386, 2135
- [] Godwin J.G., Peach J.V., 1977, MNRAS, 181, 323
- [] Godwin J. G., Metcalfe N., Peach J. V., 1983, MNRAS, 202, 113
- [] Graham A. W., Driver S. P., Petrosian V., Conselice C. J., Bershady M. A., Crawford S. M., Goto T., 2005, AJ, 130, 1535
- [] Grogin, N. A., Geller, M. J., Huchra, J. P, 1998, ApJ, 199, 277
- [] Guo Q., Whtie S., Li C., Boylan-Kolchin M., 2010, MNRAS, 404, 1111
- [] Guo Q. et al, 2011, preprint, arXiv:1006.0106 (G11)
- [] Henriques B.M., Bertone S., Thomas P.A., 2008, MNRAS, 383, 1649
- [] Henriques B.M.B., Thomas P.A., 2010, MNRAS, 403, 768
- [] Janz J., Lisker T., 2008, ApJ, 689, 25
- [] Janz J., Lisker T., 2009, ApJ, 696, L102
- [] Kang X., Jing Y.P., Mo H.J., Börner G., 2005, ApJ, 631, 21
- [] Kang X., van den Bosch F.C., 2008, ApJ, 676, 101
- [] Kauffmann G., White S.D.M., Guideroni B., 1993, MNRAS, 264, 201
- [] Kent S. M., Gunn J. E., 1982, AJ, 87, 945
- [] Kent S. M., Sargent W. L. W., 1983, AJ, 88, 697
- [] Kim H.-S., Baugh C.M., Cole S., Frenk C.S., Benson A.J., 2009, MNRAS, 400, 1527
- [] Kimm T. et al., 2009, MNRAS, 394, 1131
- [] Kimm T., Sukyoung K, Khochfar S., 2011, ApJ, 729, 11
- [] Komatsu E. et al., 2011, ApJ, 192, 18
- [] Larson R.B., Tinsley B.M., Caldwell C.N., 1980, ApJ, 237, 692
- [] Li C., White S.D.M., 2009, MNRAS, 398, 2177
- [] Li Y.-S., De Lucia G., Helmi A., 2010, MNRAS, 401, 2036
- [] Lisker T., Grebel E.K., Binggeli B., 2006, ApJ, 132, 497
- [] Lisker, T., Grebel, E. K., Binggeli, B., & Glatt, K. 2007, ApJ, 660, 1186
- [] Lisker T., Grebel E.K., Binggeli B., 2008, AJ, 135, 380
- [] Lisker T. et al., 2009, ApJ, 706, 124
- [] Liu L., Yang X., Mo H.J., van den Bosch F.C., Springel V., 2010, ApJ, 712, 734
- [] Lo Faro B., Monaco P, Vanzella E., Fontanot F., Silva L., Cristiani S., 2009, MNRAS, 399, 827
- [] Łokas E. L., Mamon G. A., 2003, MNRAS, 343, 401
- [] Lu N.Y., Hoffman G.L., Groff T., Roos T., Lamphier C., 1993, ApJ, 88, 383
- [] Lu T., Gilbank D.G., Balogh M.L., Bognat A., 2009, MNRAS, 399, 1858
- [] Kenney, J. D. P., Rubin, V. C., Planesas, P., Young, J. S., 1995, AJ, 109, 2444
- [] Macciò A.V., Kang X., Fontanot F., Somerville R., Koposov S., Monaco P., 2010, MNRAS, 402, 1995
- [] Makarov, D. I., Karachentsev, I. D., Burenkov, A. N., A & a, 2003, 405, 951
- [] Makarov D., Karachentsev I., 2010, preprint, arXiv:1011.6277
- [] Maraston C., Strömbäck G., Thomas D., Wake D.A., Nichol R.C., 2009, MNRAS, 394, 107
- [] McCarthy I.G. et al., 2008, MNRAS, 383, 593
- [] McDonald M., Courteau S., Tully R.B., 2009, MNRAS, 394, 2022
- [\citeauthoryearMcLaughlinMcLaughlin1999] McLaughlin D. E., 1999, ApJ, 512, L9
- [] Mei S., Blakeslee J. P., Côté P., Tonry J. L., West M. J., Ferrarese L., Jordán A., Peng E. W., Anthony A., Merritt D., 2007, ApJ, 655, 144
- [] Michard R., Andreon S., 2008, A&A, 490, 923
- [] Mould J. R., et. al. 2000, ApJ, 529, 786
- [] Murante G., Giovalli M., Gerhard O., Argnaboldi M., Borgani S., Dolag K., 2007, MNRAS, 377, 2
- [] Navarro J.F., Frenk C.S., White S.D.M, 1997, ApJ, 490
- [] Nagashima M., Yoshii Y., 2004, ApJ, 610, 23
- [] Neistein E., Weinmann S.M., 2010, MNRAS, 405, 2717
- [] Neistein E., Weinmann S.M., Li C., Boylan-Kolchin M., 2011, preprint, arXiv:1011.2492
- [] Osterloo T., Shostak S., 1993, A&A, 99, 370
- [] Pasquali A., Gallazzi A., Fontanot F., van den Bosch F.C., De Lucia G., Mo H.J., Yang X., 2010, MNRAS, 407, 937
- [] Paturel, G., Theureau, G., Bottinelli, L., Gouguenheim, L., Coudreau-Durand, N., Hallet, N., Petit, C., 2003, A & A, 412, 57
- [] Paudel S., Lisker T., Kuntschner H., Grebel E.K., Glatt K., 2010, MNRAS, 405, 800
- [] Petrosian V., 1976, ApJ, 209, L1
- [] Popessso P., Böringer H., Romaniello M., Voges W., 2005, A&A, 433, 415
- [] Pracy M.B., De Propris R., Driver S.P., Couch W.J., Nulsen P.E.J., 2004, MNRAS, 352, 1135
- [] Rand R.J., 1995, AJ, 109, 2444
- [] Rines K., Geller M.J., 2008, ApJ, 135, 1837
- [] Roediger J.C., Courteau S., McDonald M., MacArthur L, 2011, preprint, arXiv:1105.0006
- [] Salim S., 2007, ApJ, 173, 267
- [] Sánchez-Janssen R., Aguerri J.A.L., Muñoz-Tuñón C., 2008, ApJ, 679, 77
- [] Sandage A., Binggeli B., 1984, AJ, 89, 919
- [] Sanders J. S., Fabian A. C., 2007, MNRAS, 381, 1381
- [] Sastry G.N., Rood H.J., 1971, ApJ, 23, 371
- [] Schindler S., Binggeli B., Böhringer H., 1999, A&A, 343, 420
- [] Schlegel D. J., Finkbeiner D. P., Davis M., 1998, ApJ, 500, 525
- [] Schneider S.E., Thuan T.X, Magri C., Wadiak J.E., 1990, ApJ, 72, 245
- [] Sérsic, J. L. 1963, Boletin de la Asociacion Argentina de Astronomia La Plata Argentina, 6, 41
- [] Simien, F., Prugniel, P., 1997, A&A, 126, 15
- [] Simionescu A. et al., 2011, preprint, arXiv:1102.2429
- [] Smith, R. J., Lucey, J. R., Hudson, M. J., Schlegel, D. J., Davies, R. L., 2000, MNRAS, 313, 469
- [] Smith J. A., et. al. 2002, AJ, 123, 2121
- [] Spergel D.N. et al., 2003, ApJ, 148, 175
- [] Springel V., White S.D.M., Tormen G., Kauffmann G., 2001, MNRAS, 328, 726
- [] Springel V. et al., 2005, Nature, 435, 629
- [] Strauss, M. A., Huchra, J. P., Davis, M., Yahil, A., Fisher, K. B., Tonry, J., 1992, ApJ, 83, 29
- [] Struble M. F., Rood H. J., 1999, ApJS, 125, 35
- [] Tinker J.L., Wetzel A., 2010, ApJ, 719, 88
- [] Toloba E., 2009, ApJ, 707, 17
- [] Tonry J.L, Blakeslee J.P., Ajhar E.A., Dressler A., 2000, ApJ, 530, 625
- [] Trager, S. C., Faber, S. M., Worthey, G., González, J. J., 2000, AJ, 199, 1645
- [] Tully R.B. Somerville R.S., Trentham N., Verheijen M.A.W., 2002, ApJ, 569, 573
- [] Urban O., Werner N., Simionescu A., Allen S.W., Böhringer H., 2011, preprint, arXiv:1102.2430
- [] van den Bosch F.C., et al., 2007, MNRAS, 376, 841
- [] van den Bosch F.C., Aquino D., Yang X., Mo H.J., Pasquali A., McIntosh D.H., Weinmann S.M., Kang X., 2008, MNRAS, 387, 79
- [] van Driel, W., Ragaigne, D., Boselli, A., Donas, J., Gavazzi, G., 2000, A&A, 144, 463
- [] van der Wel A., Bell E.F., Holden B.P., Skibba R.A., Rix H.-W., 2010, ApJ, 714, 1779
- [] von der Linden A., Wild V., Kauffmann G., White S.D.M., Weinmann S.M., 2010, MNRAS, 404, 1231
- [] Wang L., Li C., Kauffmann G., De Lucia G., 2007, MNRAS, 377, 1419
- [] Wegner, G., Bernardi, M., Willmer, C. N. A., da Costa, L. N., Alonso, M. V., Pellegrini, P. S., Maia, M. A. G., Chaves, O. L., Rité, C., 2003, AJ, 126, 2268
- [] Weinmann S.M., van den Bosch F.C., Yang X., Mo H.J., 2006a, MNRAS, 366, 2
- [] Weinmann S.M., van den Bosch F.C., Yang X., Mo H.J., Croton D.J., Moore B. 2006b, MNRAS, 372, 1161
- [] Weinmann S.M., Kauffmann G., van den Bosch F.C., Pasquali A., McIntosh D.H., Mo H.J., Yang X., Guo Y., 2009, MNRAS, 394, 1213
- [] Weinmann S.M., Kauffmann G., von der Linden A., De Lucia G., 2010, MNRAS, 406, 2249
- [] Wetzel A.R., White M., 2010, MNRAS, 403, 1072
- [] White S.D.M., 1976, MNRAS, 177, 717
- [] Yang X., Mo H.J., van den Bosch F.C., Pasquali A., Li C., Barden M., 2007, ApJ, 671, 153
- [] Yang X., Mo H.J., van den Bosch F.C., 2009, ApJ, 693, 830
- [] Young C.K., Currie M., 1995, MNRAS, 273, 1141
- [] Zabludoff A.I., Geller M.J., Huchra J.P., Vogeley M.S., 1993, AJ, 106, 1273
- [] Zibetti S., White S.D.M., Brinkmann J., 2004, MNRAS, 347, 556
Appendix A Observational galaxy samples of nearby clusters
A.1 The Virgo cluster
Our initial Virgo cluster sample contains all galaxies of the Virgo Cluster Catalog (VCC, Binggeli et al. 1986) that have -magnitudes (completeness limit of the VCC) and are either certain or possible cluster members. This membership, initially based largely on morphology, was updated by Binggeli et al. (1993) and by one of us (T.L.) in May 2008 through velocities given by NED (Schneider et al. 1990, de Vaucouleurs et al. 1991, Strauss et al. 1992, Lu et al. 1993, Oosterloo et al. 1993, Zabludoff et al. 1993, Bettoni & Galletta 1994, di Nella et al. 1995, Fisher et al. 1995, Kenney et al. 1995, Rand 1995, Young & Currie 1995, Drinkwater et al. 1996, Giovanelli et al. 1997, 2007, Simien & Prugniel 1997, 2002, Grogin et al. 1998, Falco et al. 1999, Gavazzi et al. 1999, 2000, 2004, 2006, Smith et al. 2000, Trager et al. 2000, van Driel et al. 2000, Conselice et al. 2001, Bernardi et al. 2002, Caldwell et al. 2003, Cortese et al. 2003, Geha et al. 2003, Makarov et al. 2003, Paturel et al. 2003, Wegner et al. 2003, Denicolo et al. 2005, Adelman-McCarthy et al. 2007, Chilingarian et al. 2007, Evstigneeva et al. 2007). Galaxy classification for early-type dwarfs was updated following Lisker et al. (2007), and a number of uncertain, “amorphous” or ambiguous objects were reclassified by one of us (T.L.) based on SDSS images. Galaxies with km/s were excluded; the remaining galaxies have velocities of km/s 666Galaxies classified as background galaxies by Binggeli et al. (1985, 1993) were not included in our sample even when their newly available velocities fall in the given range. This concerns three objects that would otherwise be included in our final working sample.. With the systemic velocity of the cluster at km/s, this corresponds to a velocity range of km/s. We include also the possible members of the VCC, since many of these belong to substructure (e.g. “clouds”, see Binggeli et al. 1987) located in front or behind the main cluster, which would mostly also be included in the SAM due to the fact that we simply apply a lower and upper velocity limit there. 1030 galaxies now remain in our sample, of which 748 are spectroscopically confirmed members.
Total -band magnitudes and colours from -bands were measured by Lisker et al. (2007), Janz & Lisker (2009), and Meyer et al. (in prep.) on SDSS data release 5 images (Adelman-McCarthy et al. 2007), using a proper sky subtraction method (described in Lisker et al. 2007) that avoids the serious overestimation of the sky by the SDSS pipeline for nearby galaxies of large apparent size. All values are corrected for Galactic extinction (Schlegel et al. 1998). We adopt elliptical apertures corresponding to two Petrosian semimajor axes (Petrosian 1976) for our total magnitudes, and correct early-type galaxies at bright and intermediate luminosities for the flux that is missing due to this approach when their Sérsic index (Sérsic 1963) is larger than 1 (Graham et al. 2005; Janz & Lisker 2008). Colours were measured within an elliptical aperture corresponding to two half-light semimajor axes for the early-type galaxies, and to one Petrosian semimajor axis for the late types. These apertures are roughly similar for an exponential radial profile.
For 84 galaxies, SDSS images were not or not successfully analyzed by the named studies. For these, we obtained an estimate for their total -magnitude by applying a type-dependent transformation that was found empirically from the 946 galaxies that were successfully analyzed with SDSS data (Fig. 8). The VCC -magnitudes were corrected for Galactic extinction (Schlegel et al. 1998) before deriving the transformations.
We use a Virgo cluster distance modulus of mag (Mei et al. 2007; Blakeslee et al. 2009) for all galaxies, corresponding to Mpc. With the adopted WMAP1 cosmology, this leads to a spatial scale of or . To translate the -band completeness limit of mag into an -band completeness limit, we need to consider the following three aspects: (i) the errors in the and -magnitudes, (ii) the differences of total and magnitudes, (iii) the empirical transformation adopted for 84 galaxies (see above). These issues are not independent of each other – e.g. the errors in affect the distribution of values – which we need to take into account as well. For aspect (i), we adopt a -uncertainty of 0.4 mag for the fainter VCC galaxies (Binggeli et al. 1985), and assume that the -uncertainty is negligible compared to that (cf. Lisker et al. 2007). This uncertainty causes an additional, non-negligible scatter in the values (Fig. A1). Considering this fact, we assume for aspect (ii) that the actual values reach up to 1.5 mag. Finally, while aspect (iii) introduces an additional uncertainty with respect to the sample completeness in , the percentage of galaxies to which the empirical transformation was applied is small, and only a fraction of them would erroneously be moved above or below the completeness limit. We therefore assume that this has an effect of less than 0.2 mag on the completeness limit. Taken together, this leads to an -band completeness of mag (). We note that with deep imaging of the Virgo cluster core region, Lieder et al. (2011, in prep.) find no galaxies brighter than mag that have not yet been identified by the VCC, confirming that our completeness limit is reliable and probably rather conservative. Due to the sky coverage of the VCC, our sample is spatially complete out to a projected clustercentric distance (calculated from the central galaxy M 87) of 1.5 Mpc. Note that, due to this limitation, we omit the southern subcluster around M 49. We adopt these limits for our final working sample, which contains 511 galaxies.
A.2 The Fornax cluster
The Fornax Cluster Catalog (FCC, Ferguson 1998), based on data with the same instrument and similar quality as the VCC, provides us with an initial Fornax cluster sample. It includes all 340 galaxies that are certain and likely cluster members (Table II of Ferguson 1998), based mainly on morphology, and lie within the completeness limit of .
No SDSS data are available for the Fornax cluster. In order to obtain estimated -magnitudes, we apply the type-dependent transformation that was found empirically for the Virgo cluster galaxies (Fig. 8). We rely on the fact that galaxy classification was performed in a very similar manner in the VCC and FCC, and we assume that galaxy colours are distributed similar in both clusters for a given galaxy type. The FCC -magnitudes were corrected for Galactic extinction (Schlegel et al. 1998) before applying the transformations.
We use a Fornax cluster distance modulus of mag (Blakeslee et al. 2009) for all galaxies, corresponding to Mpc. With the adopted WMAP1 cosmology, this leads to a spatial scale of or . To estimate an -band completeness limit from the -band completeness ( mag), the same three aspects apply as outlined in Sect. A1 for Virgo, with a slightly smaller -uncertainty of 0.3 mag (Ferguson 1989). However, since for Fornax all -magnitudes are derived through the empirical transformations, aspect (iii) from above now becomes significant: the uncertainties in the adopted transformations can be as large as mag for the bulk of data points (Fig. A1). This leads to an -band completeness of mag (). Due to the sky coverage of the FCC, our sample is spatially complete out to a projected clustercentric distance (calculated from the central galaxy NGC 1399) of 0.9 Mpc. We adopt these limits for our final working sample, which contains 76 galaxies.
A.3 The Coma cluster
We use two different observational samples for the Coma cluster, which we find to be in good agreement. The first sample (named “Coma” hereafter) is given by Michard & Andreon (2008), based on spectroscopic and morphological membership criteria and covering the central area of the cluster. The second sample (“ComaB”) is constructed from SDSS data and, in addition to spectroscopic member galaxies, involves a statistical correction for the number of contaminating background galaxies.
Michard & Andreon (2008) provide a list of 473 Coma member galaxies, initially based on the Godwin et al. (1983) catalog. We unambiguously identified all but 7 galaxies in the SDSS data release 7 (Abazajian et al. 2009). Using SDSS spectroscopy, we apply a redshift limit of km/s (cf. Kent & Gunn 1982 and Chiboucas et al. 2010), within the given redshift errors and using only redshifts with a confidence of 95% or higher. These limits remove 4 galaxies from the sample.
As total -magnitudes, we adopt the SDSS photometric pipeline Petrosian magnitudes, which are also used for -colours. We checked that the above-mentioned overestimation of the sky background that occurs for Virgo cluster galaxies does not have significant effect for Coma, which simply is due to the much smaller apparent size of the galaxies. Still, the luminosity of the two massive central ellipticals NGC 4874 and NGC 4889 is clearly underestimated in the SDSS. For them, as well as for the 7 galaxies not identified in the SDSS, we obtain estimated -magnitudes by applying the transformation of Smith et al. (2002) to the Godwin et al. (1983) and -magnitudes as given by Michard & Andreon (2008). All values are corrected for Galactic extinction (Schlegel et al. 1998).
We use a Coma cluster distance modulus of mag (Carter et al. 2008) for all galaxies, corresponding to Mpc. With the adopted WMAP1 cosmology, this leads to a spatial scale of or . With the Godwin et al. (1983) magnitude completeness of mag (Michard & Andreon 2008), the -uncertainty of 0.2 mag (Godwin et al. 1983), and the values of up to 1.5 mag (see Sect. A1), completeness in the r-band is only guaranteed down to mag. We define the cluster center to be located midway between the two central ellipticals, at . This leads to a spatial completeness out to a projected clustercentric distance of 0.5 Mpc. These limits lead to a final “Coma” working sample of 226 galaxies.
For the “ComaB” sample, based purely on the SDSS, we first select all objects identified by the SDSS as galaxies within ( Mpc) from the cluster center as defined above, with Petrosian -magnitudes (corrected for Galactic extinction) corresponding to mag at the Coma distance. Where SDSS spectra are available, with a redshift confidence of 95% or higher, we apply the above redshift limits. We then visually inspect all objects and exclude them if they are, (i) stars, (ii) “pieces” of a galaxy instead of stand-alone objects, or (iii) small objects that are obviously too faint for our criteria, but whose magnitude was artificially increased by the halo of a bright star or the outer parts of a bright galaxy. A plot of magnitude versus surface brightness helped to identify, as clear outliers, the few objects that fulfill one of the above criteria but were overlooked during the first visual inspection. Finally, we exclude all objects redder than , since these are even redder than all of the massive cluster ellipticals, which should have the oldest and most metal-rich stellar populations among the cluster members. These red, mostly faint galaxies almost certainly are background contaminants at higher redshift. The final “ComaB” sample contains 2141 galaxies, of which 923 are spectroscopic members.
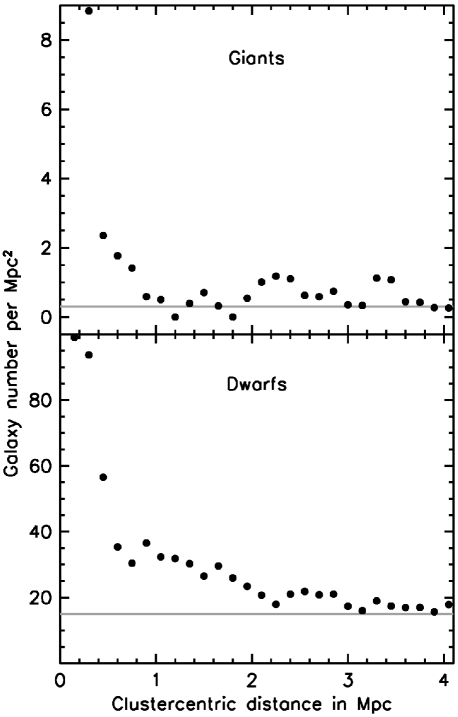
From a radial number density profile of those galaxies that are not spectroscopic members, we decide to adopt a statistical background galaxy number density of for dwarfs (mag), and for giants (mag; see Fig. 9). Therefore, in a statistical sense, 835 galaxies of the sample are background objects, and 383 are cluster members without an SDSS redshift. We remark that the SDSS spectroscopic coverage reaches only to mag.
To estimate the red fraction, we first k-correct the colours of all galaxies to z=0, assuming they are all at a redshift of z=0.023, which corresponds to the estimated distance to Coma. This is done using the approximation of Chilingarian et al. (2010). We then background-correct red galaxies, defined according to eq. 1, and galaxies in different absolute magnitude bins, separately. We use zero background correction for galaxies with , and , and for galaxies with , and respectively. For red galaxies, we use a background correction of for dwarfs, and of zero, , and for the four magnitude bins listed above.
For comparison, we also constructed an SDSS sample analogous to ComaB, but only for the area covered by (Michard & Andreon 2008). When assuming that Michard & Andreon 2008 correctly identified all cluster members, we would obtain a background contamination value of for dwarfs, i.e. a factor larger than our adopted value for the ComaB sample. However, there are two indications that this value might indeed be too large (aside from the general possibility of strong cosmic variance). First, if we would use for the ComaB sample, then all dwarfs without SDSS spectra and even 70 of those with spectroscopically confirmed membership would statistically have to be background contaminants. Second, Chiboucas et al. 2010 present spectroscopic membership for a number of faint Coma dwarfs also included in Michard & Andreon (2008), with magnitudes even fainter than their completeness limit, and find that Michard & Andreon (2008) erroneously assigned a substantial fraction of spectroscopic cluster members to the background population, based on their morphological criteria. While these criteria probably work better at the somewhat brighter magnitudes that we are concerned about, this seems at least consistent with our findings. It should be noted that, as far as the central cluster region is concerned, a small variation in the background correction does not have a significant effect on the number density profile (see Fig.4), since the vast majority of galaxies in that region are cluster members anyway.
A.4 The Perseus cluster
We construct a Perseus cluster sample from SDSS data release 7 (Abazajian et al. 2009) similar to the ComaB sample, except for the fact that there are no SDSS spectra available for this region, and that the spatial coverage in the cluster outskirts is incomplete. We first select all objects identified by the SDSS as galaxies within ( Mpc) from the cluster center, taken to be the central massive galaxy NGC 1275. As for Coma, we adopt a magnitude limit of mag at the Perseus distance (see below), already corrected for Galactic extinction and using SDSS Petrosian -magnitudes. Since Perseus is closer than Coma, adopting the same limit in absolute magnitude means a shallower limit in apparent magnitude, which is useful to keep the amount of background contaminants at a moderate level.
The spatial incompleteness of the SDSS can be characterized as follows. Coverage is complete out to ( Mpc) from the cluster center. For the sample galaxies beyond and out to ( Mpc), the average completeness correction factor is 1.50, with a standard deviation of 0.23. The SDSS thus still covers more than half of the cluster area in the outskirts, and should thus be well representative for the whole cluster. An additional small area has been excluded (around ), since a confirmed background cluster is located there.
As for the ComaB sample, we then visually inspect the Perseus sample and exclude, (i) stars, (ii) “pieces” of a galaxy instead of stand-alone objects, and (iii) small objects that are obviously too faint for our criteria, but whose magnitude was artificially increased by the halo of a bright star or the outer parts of a bright galaxy. However, in contrast to the ComaB selection process, we do not apply a redward colour cut here, since the Perseus cluster is located at low Galactic latitude () and thus there might be local extinction variations not taken into account in our adopted Schlegel et al. (1998) values, affecting galaxy colours. We are therefore left with 1853 galaxies in our working sample.
We use a Perseus cluster distance modulus of mag, corresponding to a ”Hubble flow distance” of Mpc. This is given by NED based on the heliocentric velocity of km/s (Struble & Rood 1999), on WMAP1 cosmology, and on considering the influence of the Virgo cluster, the Great Attractor, and the Shapley Supercluster through the local velocity field model of Mould et al. (2000). This leads to a spatial scale of or , similar to what previous studies used (Conselice et al. 2002; Sanders & Fabian 2007).
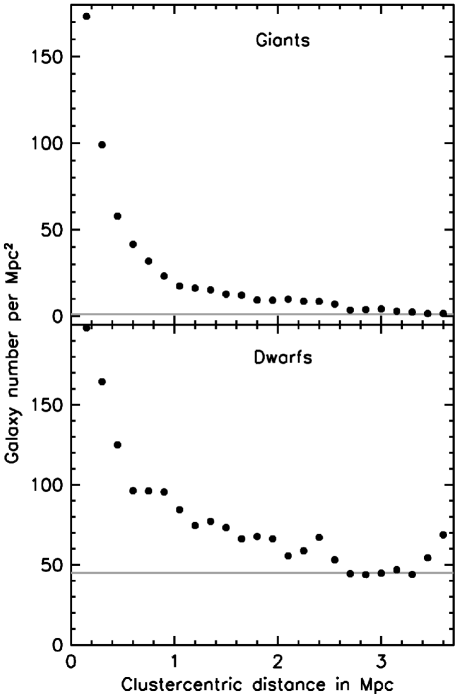
From a radial number density profile, we find a statistical background galaxy number density of for dwarfs (mag) and for giants (mag; see Fig. 10). While these values cannot be determined to high accuracy, their uncertainty has little effect on the number densities in the inner cluster regions. To estimate the red fraction, we also background-correct red galaxies, defined according to eq. 1, and galaxies in different absolute magnitude bins, separately. We k-correct Perseus galaxies to z=0 using the approximation of Chilingarian et al. (2010), assuming they are all at a fixed redshift z=0.017. We use zero background correction for galaxies with , and , and for galaxies with , and respectively. For red galaxies, we use a background correction of for dwarfs, and of zero, , and for the four magnitude bins listed above.
A.5 Completeness for compact objects
While published magnitude completeness limits (e.g. VCC, FCC) primarily relate to losing galaxies with very low surface brightness on the diffuse side, the completeness on the compact side needs to be considered as well. Very compact galaxies might be confused with stars when they are barely resolved, or be confused with background galaxies due to their small radius and comparably high surface brightness. The compilation of Misgeld et al. (2011, their Fig. 1) shows that the smallest known galaxies down to our completeness limits can have effective radii as small as 100 pc. Note that the so-called ultra-compact dwarf (UCD) galaxies are fainter than our limits.
We can reasonably assume that such objects can be seen on their respective imaging data (VCC, FCC, SDSS, Michard & Andreon 2008) at least out to two effective radii, i.e. have a visible diameter of at least 400 pc. This corresponds to 5 arcseconds at the Virgo cluster distance, and 4 arcseconds at the Fornax cluster distance. Clearly, all such galaxies would be recognized as extended objects in Virgo and Fornax. For the larger distances of the Coma and Perseus clusters, the situation changes: the named galaxies would have visible diameters of only 0.9 and 1.1 arcseconds, respectively, or between 2 and 3 SDSS pixels. However, the fraction of galaxies with effective radii below 400 pc (i.e. a visible diameter below 1.6 kpc) is at most a few percent (Janz & Lisker 2008), too small to affect any of our conclusions.