Detecting quark matter in the early universe
by gravitational waves
Abstract
For large baryochemical potential strongly interacting matter might undergo a first order phase transition at temperatures MeV. Within standard cosmology, however, is assumed to be very small leading to a crossover. We discuss implications of a first order QCD transition at high being consistent with current observations. In this contribution we concentrate on effects on the gravitational wave spectrum. There are other interesting cosmological signals as a modification of the power spectrum of dark matter, the production of stellar black holes, and the seeds for the extragalactic magnetic fields which we briefly address also.
keywords:
Cosmological QCD phase transition; gravitational waves.1 Introduction
In the standard scenario of the hot big bang a period of inflation is assumed to have taken place in the very early universe. During inflation metric perturbations are created of which the tensorial part forms a spectrum of primordial gravitational waves (GWs) presumably propagating through spacetime until today. Not interacting with the medium they can retain information about the very early stages of the cosmos. Nevertheless, the evolution of the universe can leave imprints in the primordial GW signal because the GW spectrum depends on the behavior of the Hubble parameter given by the Friedmann equation
The proportionality holds for a radiative medium with effective relativistic degrees of freedom. A GW starts to decay when the wavelength becomes smaller than the Hubble radius , i.e. at horizon entry. depends on and whereas, by contrast, grows proportional to the scale factor —independently of the properties of the medium. Thus, a drop in the relativistic degrees of freedom, as expected during the QCD phase transition, can modify the spectrum. In this contribution we present our results for the primordial GW spectrum after different types of QCD phase transitions including one at high featuring a short period of inflation [3, 2]. The little inflation also modifies the power spectrum of large-scale structure up to an enclosed dark matter mass of and dilutes the cold dark matter density up to a factor of . This requires a reduced WIMP annihilation cross section or a larger WIMP mass which could be probed at the LHC. During a first order transition collisions of charged bubbles can generate magnetic fields which could be the seed fields for the galactic and extragalactic magnetic fields observed today. We point out that the concept of a short inflationary period during the QCD phase transition has also been introduced earlier by Kämpfer et al. [4, 5] and Borghini et al. [6]
2 QCD Phase Transition with a Little Inflation
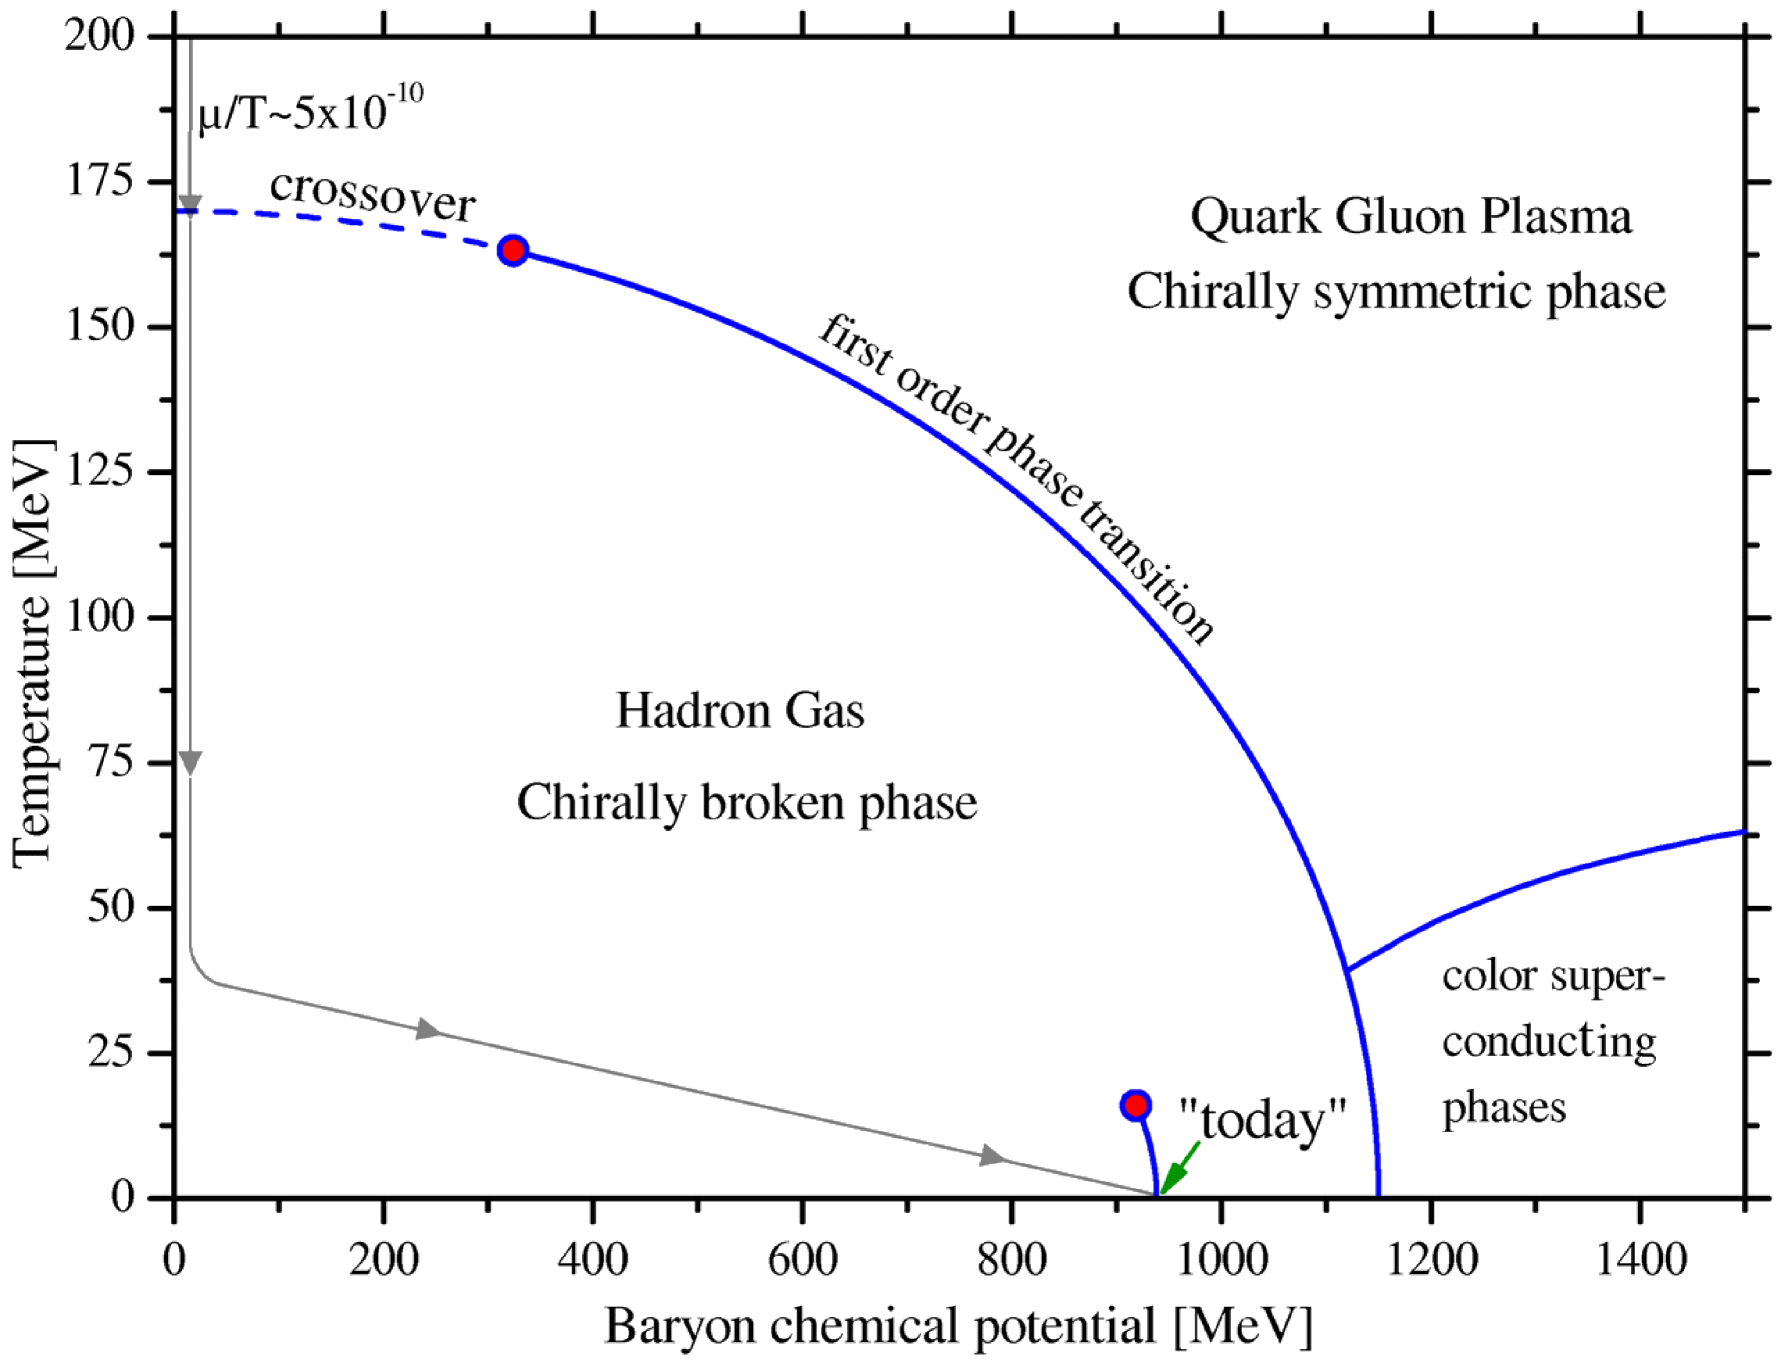
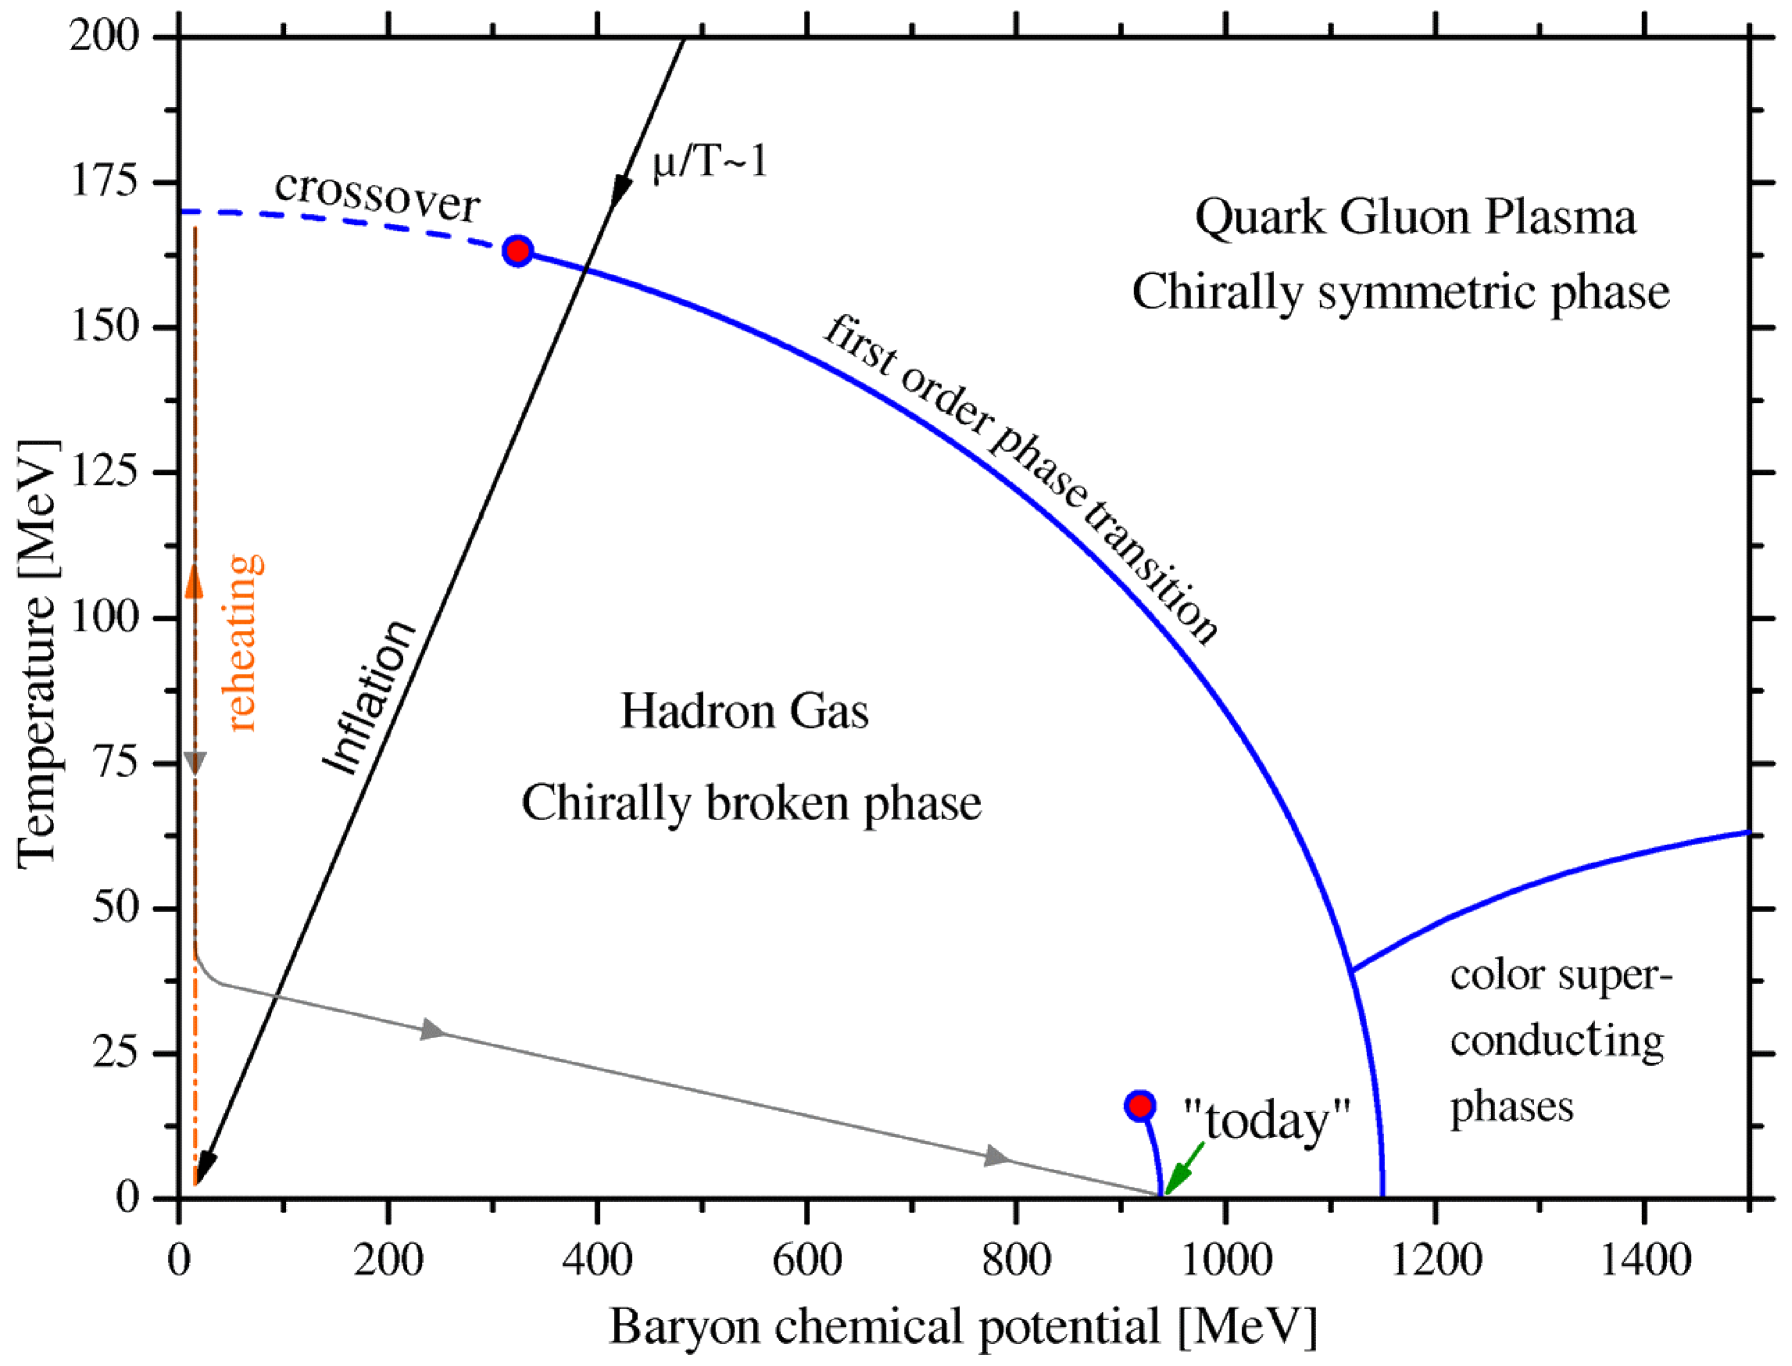
From lattice calculations we know that for small baryochemical potential strongly interacting matter undergoes a crossover from the hadronic phase to the quark-gluon plasma. As observations of the cosmic microwave background and measurements of the abundances of light elements suggest, the baryon to photon ratio in the early universe and equivalently the baryochemical potential are well within the crossover region of the QCD phase diagram: , see \freffigQCDPhaseDiagram. This ratio is conserved except at baryogenesis and during a first order phase transition with release of latent heat. At there are no reliable data from lattice QCD, and a first order phase transition is not excluded. As will be discussed in the following, in this case there may be observable signals from the transition. But how do we circumvent the bounds on set by big bang nucleosynthesis (BBN) data? A possible scenario is the following (see also \freffigInflQCDPhaseDiagram): Before QCD time a strong baryon asymmetry is produced, e.g. by an Affleck-Dine baryogenesis. This can lead to and therefore allows for a first order transition during which the universe is trapped in a false metastable vacuum. The energy density is then dominated by the potential of this state. Since the latter is constant in time, it leads to an exponential growth of the scale factor and thus to an additional period of (de Sitter) inflation:
After the inflationary period
the baryochemical potential should be at the value needed for BBN to produce the right amount of light elements. Tagging quantities before the inflation with a subscript i and those afterwards with f we can write down
Hence, to provide the necessary dilution of only e-folds are sufficient. This is few in comparison to the corresponding value in standard inflation. Nevertheless, the production of hadronic bubbles within the supercooled quark-gluon plasma must be suppressed in order to delay the phase transition. The corresponding nucleation rate depends on the difference in the free energy of the two phases and on the surface tension [7]. For high densities this is discussed in Refs. \refcitePalhares10, Mintz10. The attenuation of the fraction is accompanied by a strong supercooling which passes into a period of reheating after the little inflation. Thereby the transition temperature is reached again and the evolution of the universe returns to its conventional path.
Finally we should mention that the scenario described above is only one possibility for a first order QCD phase transition in agreement with observation. Another one includes a large lepton asymmetry and is discussed in Ref. \refciteSchwarz09.
3 Tensor perturbations and the QCD trace anomaly
In the future, observation of gravitational waves may allow for distinction between different types of QCD transitions. To see this we need the (gauge invariant) equation of motion for the tensor perturbation amplitude in Fourier space. Making use of conformal time and denoting the corresponding derivatives with primes we get
where
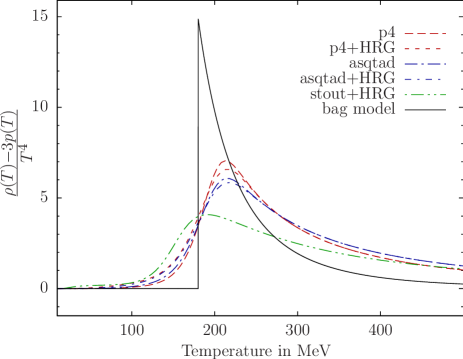
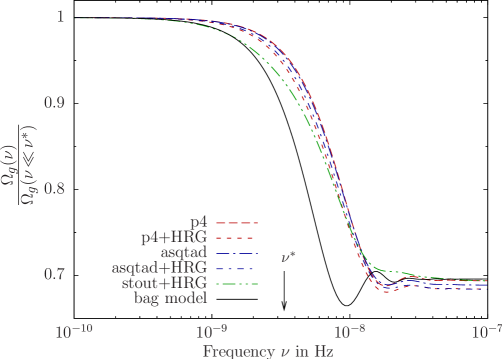
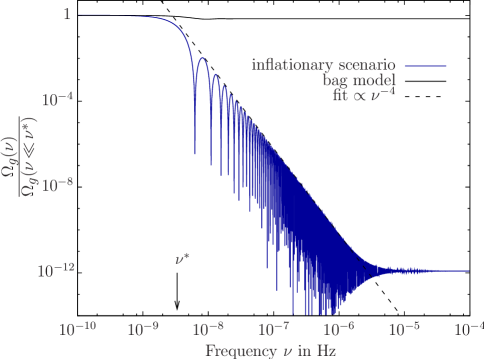
The last expression is proportional to the trace anomaly to which GWs are sensitive. In order to calculate the evolution of the primordial GW spectrum around QCD time we use parameterizations corresponding to several lattice calculations, see \freffig:TraceLattice. The lattice results were obtained with improved staggered fermion actions (asqtad, p4, and stout) with and without including a hadron resonance gas (HRG) [11, 12, 13]. The resulting GW spectra show a step-like structure at a critical frequency which corresponds to the mode that enters the Hubble horizon at the end of the phase transition. In \freffig:SpectrumLattice the resulting energy density in GWs per logarithmic frequency interval is shown:
The spectra in \freffig:SpectrumLattice are rather insensitive to details of the phase transition. This is because entropy is conserved during a phase transition described by the bag model or lattice data at vanishing . Entropy conservation in turn leads to
if we choose the typical values and as in Ref. \refciteSchwarz98. However, in case of large entropy release, as it is expected at the end of an inflationary period, the resulting spectrum differs drastically: Because during inflation the successive entrance of modes into the horizon is reversed to a successive horizon exit, the high frequency modes in \freffig:SpectrumInfl are strongly suppressed with respect to the ones with low frequency. In addition to the consequential drop we observe strong oscillations within the spectrum. They emerge because each mode is at a different phase at horizon exit during inflation.
4 Observations of gravitational waves
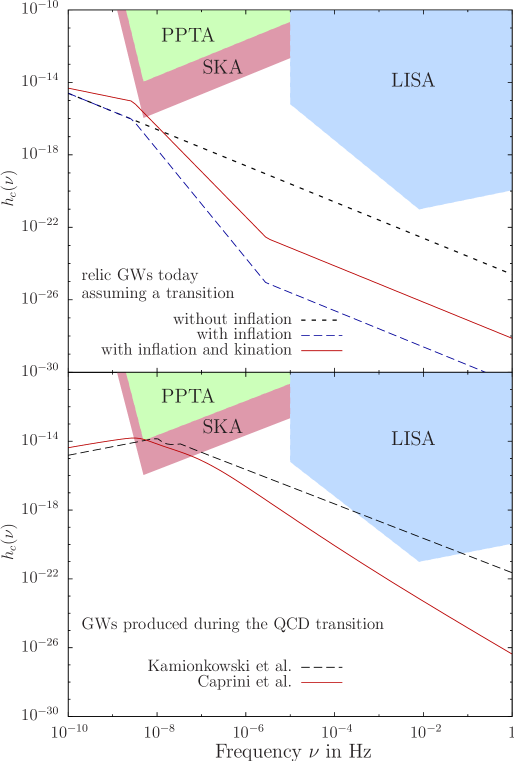
In \freffigDetectors different possible GW spectra after the QCD phase transition are displayed. In the upper panel the strain amplitude of the primordial GWs after a conventional QCD transition is compared with a spectrum resulting from the inflationary scenario (omitting the oscillations). The step frequency in the amplitude is close to the highest sensitivity of pulsar timing methods. We also display a spectrum which is expected after a phase transition which additionally includes a long period of domination of kinetic energy of a scalar field (kination). Kination can occur during the process of reheating after inflation and here serves as an example of how future measurements of the GW spectrum could shed light on the time evolution of the equation of state in the early universe. The lower panel shows possible spectra of GWs emanating from bubble collisions and turbulences during a first order QCD transition. They most strikingly differ at high frequencies: In this regime the slopes of the spectra deviate because in Ref. \refciteKamionkowski94 multi-bubble collisions are included. Note that these analytic estimates were done for a general first order transition at QCD time and do not include a short period of inflation. For both we chose the maximal strength still being consistent with PPTA measurements. Recent analyses of data measured by the European Pulsar Timing Array EPTA [16] pose similar constraints on the spectra displayed in the lower panel. The Square Kilometre Array SKA is expected to push these limits further down. By contrast, a detection of the primordial GW spectrum seems impossible in the foreseeable future. However, comparison of Planck [17] measurements at Hz with those of the proposed Big Bang Observer BBO [18] at Hz will potentially allow for a discrimination between an inflationary transition and the standard one.
5 Summary
We have presented an alternative scenario for the cosmological QCD phase transition which includes a short period of inflation. The scenario depends on a strong baryogenesis before the QCD scale allowing the universe to intersect the first order transition line which is suggested by effective models of QCD. The system needs to be trapped in a metastable vacuum state such that the corresponding vacuum energy leads to an inflationary phase. Such a first order phase transition would generate signals which can potentially be observed: In this contribution we discussed the strong suppression of GWs with frequencies above Hz and the production of GWs in bubble collisions and turbulences during the phase transition. We also mentioned effects on the dark matter power spectrum, different requirements on the WIMP annihilation cross section, and the production of primordial magnetic fields.
Acknowledgements
One of us (JSB) is indebted to Walter Greiner for his continuing and stimulating interest in this work. This work is supported by BMBF under grant FKZ 06HD9127, by DFG within the framework of the excellence initiative through the Heidelberg Graduate School of Fundamental Physics, the International Max Planck Research School for Precision Tests of Fundamental Symmetries (IMPRS-PTFS), the Gesellschaft für Schwerionenforschung GSI Darmstadt, the Helmholtz Graduate School for Heavy-Ion Research (HGS-HIRe), the Graduate Program for Hadron and Ion Research (GP-HIR), and the Helmholtz Alliance Program of the Helmholtz Association contract HA-216 “Extremes of Density and Temperature: Cosmic Matter in the Laboratory”.
References
- [1] M. J. Fromerth and J. Rafelski, arXiv:astro-ph/0211346 (2002).
- [2] S. Schettler, T. Boeckel and J. Schaffner-Bielich, Phys. Rev. D83, 064030 (2011).
- [3] T. Boeckel and J. Schaffner-Bielich, Phys. Rev. Lett. 105, 041301 (2010).
- [4] V. G. Boyko, L. L. Jenkovszky, B. Kämpfer and V. M. Sysoev, Astron. Nachr. 311, 265 (1990).
- [5] L. L. Jenkovszky, V. M. Sysoev and B. Kämpfer, Z. Phys. C 48, 147 (1990).
- [6] N. Borghini, W. N. Cottingham and R. V. Mau, J. Phys. G 26, 771 (2000).
- [7] L. P. Csernai and J. I. Kapusta, Phys. Rev. D 46, 1379 (1992).
- [8] L. F. Palhares and E. S. Fraga, Phys. Rev. D 82, 125018 (2010).
- [9] B. W. Mintz, E. S. Fraga, G. Pagliara and J. Schaffner-Bielich, Phys. Rev. D 81, 123012 (2010).
- [10] D. J. Schwarz and M. Stuke, J. Cosmol. Astropart. Phys. 0911, 25 (2009).
- [11] A. Bazavov et al., Phys. Rev. D 80, 014504 (2009).
- [12] S. Borsányi, Z. Fodor, C. Hoelbling, S. D. Katz, S. Krieg, C. Ratti and K. K. Szabó, J. High Energy Phys. 9, 73 (2010).
- [13] S. Borsányi, G. Endrődi, Z. Fodor, A. Jakovác, S. D. Katz, S. Krieg, C. Ratti and K. K. Szabó, J. High Energy Phys. 11, 77 (2010).
- [14] D. J. Schwarz, Mod. Phys. Lett. A 13, 2771 (1998).
- [15] M. Kamionkowski, A. Kosowsky and M. S. Turner, Phys. Rev. D 49, 2837 (1994).
- [16] R. van Haasteren et al., arXiv:1103.0576 (2011).
- [17] The Planck Collaboration, arXiv:astro-ph/0604069 (2006).
- [18] V. Corbin and N. J. Cornish, Class. Quant. Grav. 23, 2435 (2006).
- [19] C. Caprini, R. Durrer and X. Siemens, Phys. Rev. D 82, 063511 (2010).
- [20] S. J. Huber and T. Konstandin, J. Cosmol. Astropart. Phys. 9, 22 (2008).
- [21] M. Kramer, D. C. Backer, J. M. Cordes, T. J. W. Lazio, B. W. Stappers and S. Johnston, New Astron. Rev. 48, 993 (2004).
- [22] T. Kahniashvili, A. Kosowsky, G. Gogoberidze and Y. Maravin, Phys. Rev. D 78, 043003 (2008).
- [23] B. Allen, The Stochastic Gravity-Wave Background: Sources and Detection, in Some Topics on General Relativity and Gravitational Radiation, ed. J. A. Miralles, J. A. Morales, & D. Saez (Cambridge University Press, 1997).