[3.5cm]UT-Komaba/11-1v3
Deciphering the Measured Ratios of Iodine-131 to
Cesium-137
at the Fukushima Reactors
Abstract
We calculate the relative abundance of the radioactive isotopes Iodine-131 and Cesium-137 produced by nuclear fission in reactors and compare it with data taken at the troubled Fukushima Dai-ichi nuclear power plant. The ratio of radioactivities of these two isotopes can be used to obtain information about when the nuclear reactions terminated.
1. Introduction The current state of the troubled Fukushima Dai-ichi nuclear power plant is of considerable concern. The plant, on the east shore of Fukushima prefecture was first hit, at 14:46 pm local time on March 11, 2011, by the magnitude 9.0 earthquake on the Richter scale about 150 km east of Honshu, the main island of Japan, and then hit by a giant tsunami, exceeding 14 m high, about one hour after the earthquake. Although three reactors (Units 1, 2, 3), which had been on operation at the plant, were automatically shut down immediately after the earthquake, the emergent electric power generators, working after the loss of external power supply, for cooling the reactor system were knocked out by the tsunami. Uncontrolled decay heat from the fuel rods has caused serious trouble in containing the radioactive materials which had been accumulated in the reactors and in the spent-fuel rods in the cooling pools. Explosions of hydrogen gas, created by the reaction of the heated Zirconium fuel cladding with water vapor, took place at the buildings of the Units 1, 3, and 4 reactors, severely damaging those buildings.
At the moment, only very limited information is available about the interior conditions of the reactor complex owing to the highly radioactive environment, with intense gamma rays from radioactive materials that apparently escaped from the reactors preventing direct human access for inspections. However, certain information has been released by the Tokyo Electric Power Company (TEPCO) [1] on measurements of the radioactivity at several monitoring posts near the troubled reactors and from a water sample taken from the spent-fuel cooling pool of the Unit-4 reactor building.[2]
We call attention here to the significance of the relative strength of the reported radioactivities of different radioactive isotopes. In particular, we focus on the two radioactive isotopes abundantly produced by fission, the Iodine isotope I-131 and the Cesium isotope Cs-137; the former has the half-life of 8 days while for the latter it is 30 years. The ratio should decrease on the time scale of days after the termination of nuclear fission processes and hence may be used for measuring the age of the fission products, similar to the carbon dating method using the ratio of C-14 to C-12 in the remains of ancient life[3].
One crucial difference between the proposed iodine-cesium dating and carbon dating is that while the initial condition of the latter is essentially fixed by the equilibrium C-14/C-12 ratio in atmosphere with respect to cosmic ray interactions, the initial condition of the former depends on the prehistory of controlled nuclear reactions in the reactor. Another potential problem, which does not exist for carbon dating, is the effect of the different chemical properties of iodine and cesium111This problem can be avoided by using Cs-134 and Cs-137. However, Cs-134 has a half-life of 2 years which is too long to see observable effects in the currently available data. possibly reflected in the change of their relative abundance depending on the environment in which they are found, for example in the water (fresh or sea), in the air, or in aerosols[4].
With these caveats in mind, we make a simple estimate of time-dependent numbers of
I-131 and Cs-137 nuclei produced from a uranium burning nuclear reactor and then examine
the data of the water samples released by TEPCO taken at several monitoring posts near
the troubled Fukushima nuclear reactor plant, including sea water at the Southern Discharge
Channel, Unit-4 cooling pool, Sub-drain (under ground) water, and sea water taken
at the Intake Canal. Some of these data show anomalously high iodine-cesium ratios
compared to the values expected for the nuclear fuels in the reactors if the nuclear fission
has indeed terminated before the outbreak of the accident. We draw tentative conclusions
from these analyses of the data at the end.
2. Iodine-cesium ratios in nuclear reactors We assume that in an operating nuclear reactor, where criticality is sustained for chain nuclear fission reactions, these isotopes are produced with a constant production rate, while the produced isotopes decay exponentially with a constant decay rate. The number of I-131 isotopes created by a nuclear reactor which had been in operation from time to is then given at later time by222This result may be obtained by integration of the equation, , where for and otherwise, with the initial condition .
| (1) |
where is the number of fissions per unit time, is the fraction of the I-131 produced per fission, and the decay rate is given in terms of the half-life by 8 days. The integration gives
| (2) | |||||
where we have assumed that the working time of the reactor is much longer than the half-life of I-131, . The abundance of I-131 saturates on a time scale and remains constant during the operation of the reactor.
A similar estimate can be made for Cs-137. In this case, however, the decay of Cs-137 is very slow, with a long half-life 30 years; hence and we obtain
| (3) | |||||
where is the time interval that the reactor has been in operation. The Cs-137 accumulates during the operation of the reactor due to its long lifetime, and hence becomes proportional to .
The radioactivity of each of these elements measured in becquerel (Bq) is given by the decay rates
| (4) |
and
| (5) |
so that the ratio becomes
| (6) |
where we have again used the condition . This formula gives the average ratio of the radioactivities of I-131 and Cs-137 contained in the fuel rods after the termination of the nuclear reaction at .
The fractions of each fission product are , for the cumulative thermal fission yields of U-235, taken from the IAEA data base[5]. For the three Fukushima Dai-ichi nuclear reactors in operation at the time of the earthquake, the ratio at was
| (7) |
where is measured in months. If we choose months
then .
On April 12, this ratio would be reduced by factor to 2.1 (1.3).
3. Deciphering the Fukushima nuclear accident data We now examine the data released by TEPCO for the Fukushima nuclear accident in the light of our theoretical estimates of the ratios of the Iodine-131 and Cesium-137 accumulated in the nuclear reactors and attempt to read their implications.
(i) Sea water at the Southern Discharge Channel: In Fig. 1, we show a semi-log plot of the ratio (6) against the number of days past X-day (March 11, 2011) with two different values for ; the upper line corresponds to months and the lower line to year. Note that the slopes of these lines are fixed by the half-life of I-131; only the normalization changes with a change of . The larger the value of , the lower the position of the line. The blue dots are the data of the sea water samples taken at the South Discharge Channel, a monitoring post located 330 m south of the Discharge Channel of the Unit-1 – 4 reactor sites.[6] The data are better fit by the lower line with year, but the slope is a little steeper for the data taken for the first 50 days. As mentioned, the slope of the decay line is essentially fixed by the half-life of I-131, so this may at first look puzzling. The change of the slope may, however, well have been caused by the mixture of 9000 tons of old low level contaminated water which had been discharged from the Central Radioactive Waste Disposal Facility from April 4 to 10[7]. In these wastes I-131 had been completely depleted and only long half-life isotopes like Cs-137 were present. The slope tends to decrease slightly later. This change may be caused by the leakage of contaminated water with large iodine-cesium ratio from Unit-2 reactor site, as we shall see later.
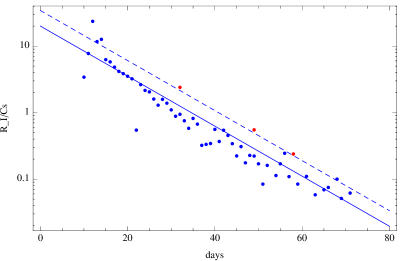
Although we have ignored the effects caused by the chemical or physical differences of iodine and cesium in compound formation, ionization, diffusion, etc., the overall fit of the sea water data with the present theoretical calculation is very encouraging.
(ii) Unit-4 cooling pool: We now turn our attention to the spent-fuel rods in the Unit-4 cooling pool. Note that the Unit-4 reactor was not in operation at the time of the earthquake. The same ratio for the fission products contained in the spent-fuel rods in the Unit-4 cooling pool should be smaller by an extra attenuation factor
| (8) |
if all these fuel rods were intact since they had been removed from the Unit-4 reactor three months earlier (December 2010). Since some of the fuel could be older, this ratio may be even smaller[8]. The calculated ratio is not, however, consistent with what has been reported. According to the TEPCO press release on April 14[2], the radioactivities of 220 Bq/cc of I-131 and 93 Bq/cc of Cs-137 have been detected from the water sample taken on April 12 from the Unit-4 cooling pool, where more than 1500 spent-fuel rods were stored. The data were analyzed on April 13. The ratio 2.4 is closer to the values of the ratio of the radioactivities from the other reactors, as shown by the red dot in Fig. 1. [9]
If the data are correct, they would imply that at least some of the radioactive fission products found in the Unit-4 cooling pool have been produced by nuclear reactions that took place at around time or later.333 We have tacitly assumed that the solubility of iodine or cesium in water is not changed considerably by boric acid, which has been added to the water to suppress chain nuclear reactions. One possible explanation could be contamination by fallout of the fission products created in the neighboring reactors.444 Actually, the hydrogen explosions of the Unit-4 reactor building took place on March 15 after the explosion of the Unit-3 reactor building on March 14. However, the explosion on March 15 may have sent fallout from the hydrogen explosion of the Unit-3 building on the roof of the Unit-4 reactor building into the pool. The author thanks Professor Ichimura for calling his attention to these subtle points. The iodine-cesium ratio of the water sample taken from the Unit-3 cooling pool and measured on May 8, however, has turned out to be 0.079[10]; this value is about factor 3 smaller than the same ratio 0.24 for the water of Unit-4 cooling pool measured on the same day[11], but instead fits to the decay line of the sea water data, suggesting that the radioactivity of the sea water has been caused by the fall-out of the radioactive material released by the hydrogen explosions. Although the difference of the ratios in Unit-3 and Unit-4 cooling pools may be caused by fluctuations of the distribution of the fallout, we may take this difference more seriously and seek other explanation for the origin of high iodine-cesium ratio found in the Unit-4 cooling pool. Another possible explanation could be that a nuclear chain reaction was reignited in the melted used fuel in the Unit-4 cooling pool for a certain period.
We now explore whether criticality had been re-established only briefly, in a period from time to . For simplicity in the following analysis, we assume days. This would be reasonable since the heat produced by a nuclear reaction in a chunk of the melted fuel would cause rapid disintegration of the chunk, terminating criticality. In this case, the number of newly produced I-131 nuclei increases in proportion to :
| (9) |
where is the average number of nuclear fissions per unit time taking place during this brief time period. Similarly the number of newly produced Cs-137 nuclei is
| (10) |
so that the ratio of the radioactivities of the newly produced I-131 and Cs-137 would be
| (11) |
This result with the replacement also gives an upper bound on the radioactivity ratio for the fission products created in the reactor under normal conditions before X-day for short .
The radioactivity measured in the sample water taken from the Unit-4 cooling pool could perhaps be from a mixture of the newly created radioactive fission products and the remnant of old fission products which is mostly composed of Cs-137, since I-131 has been depleted considerably, leading to the ratio 2.4 accidentally coincident with the ratio from the other reactors. In any event, the amount of new fission products may be small since the absolute value of the measured radioactivity in the sample is not significant.555 The total amount of the radioactivity by I-131 contained in the water of Unit-4 cooling pool, which normally contains about 1500 tons of water, may be estimated as Bq (on April 13) which is small compared to the radioactivity of fresh fission products contained in the nuclear reactor, which is the order of Bq (on X-day). If we assume that these I-131 isotopes detected in the Unit-4 cooling pool were produced by nuclear fissions reignited inside the pool after X-day, the upper bound of the total number of fissions occurred may be estimated as , which would have produced an extra heat J. This extra heat produced is equivalent to a latent heat absorbed by about 2 tons of boiling water, which is not significant if one compares it to the decay heat produced daily during the period by the used fuel rods in the cooling pool and therefore may have been easily unnoticed. This, however, may not exclude a possibility that nuclear reaction had reignited on a larger scale and some extra fission products had escaped from the pool together with violently boiling water by sudden release of large amount of heat.
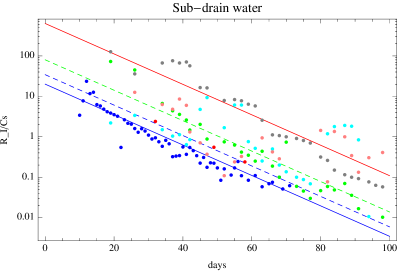
(iii) Sub-drain water: The data from water samples taken from four sub-drains near the reactor buildings show even more puzzling features, as shown in Fig. 2.[12] In particular, the water samples from the sub-drain near the Unit-2 reactor building show an anomalously high radioactivity ratio666 The author thanks Gordon Baym for calling his attention to this point. even greater than the upper bound given by (11) if the nuclear fission ends on X-day as indicated by the red solid line in the figure. If there is no strong chemical filtering effect in draining contaminated water from the reactor buildings, it would be difficult to understand the observed anomaly near the Unit-2 reactor without assuming that a significant amount of fission products were produced at least 10 – 15 days after X-day. We note that several step-wise sequential characteristic changes have been observed in the Unit-2 sub-drain data with largest change on May 11 (60 days from X-day). The causes of these changes are still unknown to the author, but it is tempting to speculate that they were caused by the mixing of the new fission products with the old ones released three times later from the remaining fuel rods in the Unit-2 reactor or from the water from other reactor site, as we shall see later.
The data from the Unit-3 sub-drain before April 23 sit close to the decay line which fits the sea water data, hence they may be understood as due to radiation from fission products produced before the X-day. However, the data of the Unit-1 sub-drain and Unit-4 sub-drain give a high radioactivity ratio, even larger than that of the samples from the Unit-4 cooling pool and from the Unit-3 sub-drain. The data therefore cannot be explained by the contamination of the old fission products which had existed in the spent-fuel rods in the Unit-4 cooling pool. The data occasionally show very different characteristics which are difficult to be understood unless there was considerable mixing of waters belonging to different sub-drains due to in-flow and out-flow of water through underground water channels. We note that the anomalously large iodine-cesium ratios were observed also in the sub-drain water in Unit-3 and Unit-4 reactor sites in June, and I-131 has been detected in the sub-drain water at Unit-1 and Unit-3 reactor sites briefly even as late as August 31, July 28, respectively. It is difficult, however, to judge the significance of these data since there were considerably large fluctuations.
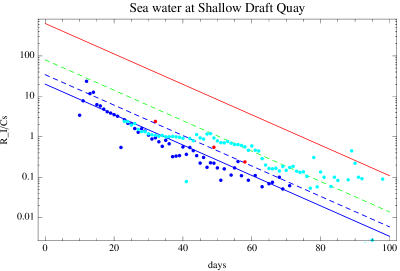
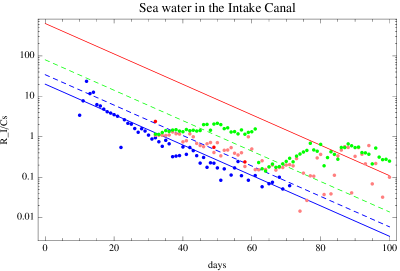
(iv) Intake Canal water: We show a few more plots of the data available for sea water samples taken near the Intake Canal of the Unit-1 – 4 reactor sites that may fill the gap between the previous sea water data (Fig. 1) and the sub-drain water data (Fig. 2).777 The author thanks Ryogo Hayano for calling his attention to the Intake Canal data. We note that a leakage of contaminated water from the water-intake of Unit-2 reactor had been reported on April 2nd, and this prompted to monitor the radioactive isotopes contained in the contaminated water near the intake of Unit-2 reactor.[13] The left panel of Fig. 3 corresponds to the sea water at the Shallow Draft Quay, located just outside of the canal, while the right panel is for the samples taken at the north (green) and south (pink) sides of the Intake Canal: the north monitoring post is located near the Unit-1 reactor intake, while the south post is near the Unit-4 reactor intake. Although the available data is limited, all these ratios seem to have stayed very close to the values of the sea water data taken at the southern monitoring post 330 m away from the canal until April 10 (30 days from X-day) and then started to deviate; the deviation becomes bigger at the north monitoring post than at the south, indicating that it is caused by the change of character of the sea water due to mixing with new contaminated water leaking out from the Unit-2 reactor. A sudden drop of the ratio has been observed on May 10 (60 days after X day) in these plots. This change may be caused by the leakage of contaminated water found in the pit of Unit-3 reactor sites; the iodine-cesium ratio may have been small in the water leaking out from the Unit-3 reactor and hence considerably diluted the ratio of pre-existing water in the canal with large iodine-cesium ratio.[14] After May 11 when the leakage from the intake of Unit-3 reactor was stopped, the ratios started to increase again and the Intake Canal data exceed the upper bound (red line) allowable, had the nuclear reaction terminated on the X day. We would also like to note that the iodine-cesium ratio in the contaminated water leaked from the Unit-3 reactor site is very close to the ratio found in the southern monitoring post 330 m south of these troubled reactors. This may not be just a coincidence.
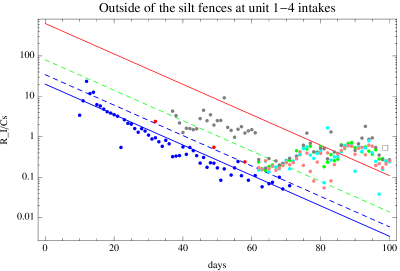
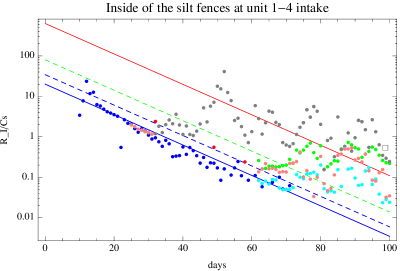
To locate the origin of the increase of the ratios, we plot in Fig. 4 the data taken at the bar screens of the
individual water intakes for Unit-1 – 4 reactors:
the left (right) panel is a plot of the data taken outside (inside) of the silt fences which have been
installed at the bar screen of the intake of the Unit-2 reactor site since April 18,
and at the bar screens of the other three reactor sites since May 12.
The radioactivity ratios of iodine-131 and Cs-137 for the water outside of the fences show very
similar behavior, with striking similarity to the north Intake Canal data (the green dots in the
right panel of Fig. 3).
On the other hand, the water sample taken inside the silt fences shows clear difference of
characteristics from the water coming from individual reactor sites: the water coming from the pit of
the Unit-2 reactor site has in particular an anomalously large iodine-cesium ratio.
This is qualitatively similar to what we have observed for the sub-drain water, while the ratio
fluctuates more rapidly in the water leaking out of the pit of Unit-2 reactor site.
It is apparent that the contaminated water leaking out of the Unit-2 reactor site is responsible for
the over-all changes of the iodine-cesium ratios of the other parts of the water in the Intake Canal.
It is interesting to note that the air sample taken from a very humid (99.9%) air inside the Unit-2
reactor building has a very high iodine-cesium ratio of 0.51 even 99 days after X day,
close to the value measured for the water coming out of the Unit-2 pit. [15]
4. Conclusions: In these notes we have estimated the radioactivity ratios of iodine isotope I-131 and cesium isotope Cs-137 accumulated in the nuclear reactor and compared the results with the data of the Fukushima nuclear reactor accidents released by TEPCO for the first 100 days after the outbreak of the accident. Although there are still many uncertainties in connecting our estimates of the ratio in the nuclear reactor to the ratios measured in the water sampled outside of of the reactors, as mentioned in the very beginning of these notes, the results are rather provocative.
The ratio of the measured radioactivity of I-131 and Cs-137 may be used to extract useful information about when these fission products were produced in the nuclear reactor complex of the Fukushima Dai-ichi plant. The sea water data taken at southern monitoring post are consistent with the expected radioactivity by the fission products which had been produced before the earthquake and perhaps released by the hydrogen explosions of Unit-1 and -3 reactor buildings. The data of the water samples from the Unit-4 cooling pool and from areas near the Unit-2 reactor, however, show an anomaly which may indicate, if the data are correct, that some of these fission products were produced by chain nuclear reactions reignited after the earthquake.
Some of these results may well be affected by chemical, thermodynamic and/or transport effects which are not taken into account in the present analysis. Estimates of these effects are rather difficult problems which would require detailed knowledge of the course of the accident in addition to various engineering problems related to the reactor design. Hopefully, more direct information concerning the interior conditions of the troubled reactors and the used fuel rods in the cooling pool will eventually become available and will clarify what actually had happened at the Fukushima Dai-Ichi reactor complex.
The author thanks Professors Gordon Baym, Munetake Ichimura and Koichi Yazaki for their interest in this work and for helpful communications. In particular, he is grateful to Professor Ichimura for patiently elucidating some of the data released by TEPCO and to Professor Baym for carefully reading these notes. He is grateful to Professor Ryogo Hayano for sharing his insights on many related aspects of the data for the Fukushima nuclear accident and for calling the author’s attention to the intake canal data, and to Professor Mamoru Shimoi for information regarding the water-solubility of iodine and cesium elements.
References
- [1] http://www.tepco.co.jp/en/index-e.html
- [2] http://www.tepco.co.jp/en/press/corp-com/release/11041412-e.html
-
[3]
W. F. Libby, E. C. Anderson and J. R. Arnold, Science 109 (1949), 227.
See also E. Fermi, Nuclear Physics (Univ. Chicago Press, 1949), p. 220. - [4] It is known that most of Iodine isotopes are released into the coolant water in the form of CsI salt which then dissolve into the water by forming Cs+ and I- ions. However the amount of cesium isotopes release into the water is an order of magnitude greater than that of the iodine isotopes. See E. C. Beahm, C. F. Weber, T. S. Kress, Iodine Forms in LWR Severe Accidents, NUREG/TM-11861, Oak Ridge National Laboratory (1991). We note that most of cesium isotopes would react with water strongly by the chemical reaction: 2 Cs + 2 H2O 2 CsOH + H2 where the produced cesium hydroxide (CsOH) would melt into the water forming Cs+ and OH-ions.
- [5] INDC International Nuclear Data Committee, Handbook of nuclear data for safeguards: Database extensions, August 2008 , INDC(NDS)-534.
- [6] The sea water data taken at the Southern Monitoring Post is available since March 21 (http://www.tepco.co.jp/en/press/corp-com/release/11032208-e.html) until May 21 (http://www.tepco.co.jp/en/press/corp-com/release/11052207-e.html). We plot the ratios of the I-131 and Cs-137 estimated from the raw data which do not contain information on possible errors in the detections. The data is not available after May 22, due to decrease of the I-131 density in the sea water below detectable level.
- [7] http://www.tepco.co.jp/en/press/corp-com/release/11041507-e.html
-
[8]
The data taken from the Unit-2 skimmer surge tank near the cooling
pool shows a very small I/Cs ratio of 0.0256 which may reflect mostly
the value in the used fuel rods with perhaps with contamination by
fresher fission products from the Unit-2 reactor.
http://www.tepco.co.jp/en/press/corp-com/release/betu11_e/images/110418e4.pdf -
[9]
In Fig. 1, new data of the unit4 cooling pool, released on April 29
(http://www.tepco.co.jp/en/press/corp-com/release/11042909-e.html) and May 9 (http://www.tepco.co.jp/en/press/corp-com/release/11050905-e.html) are also shown. They sit close to the same decay line confirming the previous data. This also implies that there has been no nuclear reaction ignited at least since April 14 in the Unit-4 cooling pool. - [10] http://www.tepco.co.jp/en/press/corp-com/release/11051009-e.html
- [11] http://www.tepco.co.jp/en/press/corp-com/release/11050905-e.html
-
[12]
The first sub-drain data was uploaded at
http://www.tepco.co.jp/en/press/corp-com/release/betu11_e/images/110331e18.pdf,
which has been updated since then. -
[13]
Leakage of the contaminated water from Unit-2 intake screen has been reported in
http://www.tepco.co.jp/en/press/corp-com/release/11040203-e.html,
http://www.tepco.co.jp/en/press/corp-com/release/11040506-e.html,
http://www.tepco.co.jp/en/press/corp-com/release/11040601-e.html.
See also the Japanese Government Report to IAEA released on June 7:
http://www.kantei.go.jp/foreign/kan/topics/201106/iaea_houkokusho_e.html - [14] The leakage of contaminated water in the pit of Unit-3 reactor site has been reported on May 11 in http://www.tepco.co.jp/en/press/corp-com/release/11051112-e.html
-
[15]
These data are contained in the attachment released by TEPCO on June 19
on the environment inside the Unit-2 reactor building:
http://www.tepco.co.jp/en/press/corp-com/release/11061903-e.html