Spectral Variability of LBV star V 532 (Romano’s star)
Abstract
We present the results of studying the spectral and photometric variability of the luminous blue variable star V 532 in M 33. The photometric variations are traced from 1960 to 2010, spectral variations—from 1992 to 2009. The star has revealed an absolute maximum of visual brightness (1992–1994, high/cold state) and an absolute minimum (2007–2008, low/hot state) with a brightness difference of B . The temperature estimates in the absolute maximum and absolute minimum were found to be K and K, respectively. The variability of the spectrum of V 532 is fully consistent with the temperature variations in its photosphere, while both permitted and forbidden lines are formed in an extended stellar atmosphere. Broad components of the brightest lines were found, the broadening of these components is due to electron scattering in the wind parts closest to the photosphere. We measured the wind velocity as a difference between the emission and absorption peaks in the P Cyg type profiles. The wind velocity clearly depends on the size of the stellar photosphere or on the visual brightness, when brightness declines, the wind velocity increases. In the absolute minimum a kinematic profile of the V 532 atmosphere was detected. The wind velocity increases and its temperature declines with distance from the star. In the low/hot state, the spectral type of the star corresponds to WN8.5h, in the high/cold state—to WN11. We studied the evolution of V 532 along with the evolution of AG Car and the massive WR binary HD 5980 in SMC. During their visual minima, all the three stars perfectly fit with the WNL star sequence by Crowther and Smith (1997). However, when visual brightness increases, all the three stars form a separate sequence. It is possible that this reflects a new property of LBV stars, namely, in the high/cold states they do not pertain to the bona fide WNL stars.
1 INTRODUCTION
Luminous blue variables (LBVs) represent one of the least understood stages in the evolution of massive stars. Difficulties in the understanding of these objects are dictated both by the paucity of well-known LBV stars, their diversity, strong spectral and photometric variability Humphreys & Davidson (1994); van Genderen (2001), as well as by our inaccurate knowledge of their fundamental parameters. Evidently, a massive star can manifest itself as an LBV after the O star stage in the Main Sequence, and before the late nitrogen WR star (WNL). However, a more accurate position of LBV stars in the transition is yet unclear Smith & Conti (2008). It is very likely that the LBV stage and the wind instabilities, corresponding to this stage are determined by the hydrogen abundance in the stellar atmosphere. However, it is not an easy matter to both measure the hydrogen abundance, and to precisely determine the luminosity and temperature of the star. Measurement of fundamental parameters of massive stars in nearby galaxies, such as the M 33 galaxy, rich in massive stars, may prove to be more confident than in our Galaxy, since the distances to galaxies are measured with sufficient accuracy.
LBV stars reveal strong spectral and brightness variations at a roughly constant bolometric luminosity. Characteristic times of such a global variability amount to months and years. When visual brightness of an LBV star increases, the temperature of the photosphere drops to K, the size of the stellar photosphere increases, and the star enters its high/cold state. From here on, when we mention the photosphere, we refer to the ‘‘pseoudophotosphere’’, i.e. the place in stellar wind, where the observed continuum radiation is formed. With a decrease in visual brightness the temperature notably increases up to 35000 K or higher Humphreys & Davidson (1994); Szeifert (1996); Clark, Larionov, & Arkharov (2005), the size of the star decreases, it enters its low/hot state. In the hot state the LBV spectra are very similar to the spectra of WNL stars. However, the bona fide WN7/8/9-type stars differ from the LBVs in the low/hot state by a number of spectral features Smith & Conti (2008); Smith, Crowther, & Prinja (1994) and low hydrogen abundance. The so-called transitional (or ‘‘slash’’) stars of the Ofpe/WN9-type, isolated in a separate class by Walborn Walborn (1977) are similar to LBV stars in the low/hot state. Ofpe/WN9 stars are characterized by a mixed spectrum with emission lines, typical of the Of and WNL stars. Taking an example of two galactic LBV-type stars AG Car and He 3–519, which in the low/hot states correspond the Ofpe/WN9-type, Smith, Crowther & Prinja Smith, Crowther, & Prinja (1994) proposed the extension of the WNL classification up to WN10 and WN11.
Nevertheless, the question whether the bona fide LBV stars in the low/hot states differ from the latest WN9/10/11 stars is still open. In other words, is it possible that all the latest WNL-type stars are in fact LBVs, which did not show any strong brightness variability over the time of their observations (only a few dozens of years). Such stars, which may be suspected to belong to the LBV type, are commonly called dormant LBVs. Note that dormant LBV stars can be found not only among the WNL stars. Two classical LBV stars, Car and P Cyg now have a spectrum of OB-hypergiants, their brightness variability is low. However, a few hundred years ago they had giant eruptions Humphreys & Davidson (1994). If it were not for these giant brightenings of Car and P Cyg and the famous nebula around Car, we would not be able to suspect them in belonging to the LBV class.
There are two LBV objects known that revealed -type transitions in recent years. This is an LBV star AG Car in our Galaxy (see, for example, Groh et al. (2009)) and an LBV star V 532 in M 33, to which we devote this paper. A reverse transition is as well known, , this is a massive WR binary HD 5980 in SMC (e.g., Koenigsberger et al. (2010)). The study of such stars is particularly important. Obviously, the parameters of these stars can be determined more accurately, since during the drastic variations in their spectra neither the chemical composition, nor the value of interstellar absorption (in some approximation, the bolometric luminosity as well) would vary. The study of LBV stars during such transitions might give us a chance to conclude about the relation between the bona fide LBVs and WNL stars.
In this paper, we study the star V 532 in the M 33 galaxy from the spectra obtained from 1992 to 2009. During this period it revealed its highest/cold (1992) and lowest/hot (1997–1998) states, registered from the observations carried out since 1960. The visual brightness difference between these two extreme states amounted to .
The star V 532 (Artyukhina et al. (1995)111in the catalog its designation is M33 V0532, GCVS II/205, http://cdsarc.u-strasbg.fr/viz-bin/Cat?II/205; http://cdsarc.u-strasbg.fr/viz-bin/Cat?B/gcvs (GCVS B/gcvs)., other names—Romano’s Star, GR 290) was discovered by G. Romano in 1978 Romano (1978). He assumed that this blue star belongs to the Hubble-Sandage-type variables. However, without spectral data no definite conclusions could be done. Furthermore, this star was studied photometrically in Sharov (1990); Kurtev et al. (2000, 2001); Sholukhova et al. (2002); Zharova et al. (2011). Photometric behavior of this star is quite typical for LBVs, it is very similar to the observed brightness variation in AG Car Stahl et al. (2001). Even the total amplitude of visual brightness variation of these two stars is equal, it amounts to .
The first spectrum of V 532 was apparently obtained by T. Szeifert in 1992, and published in 1996 Szeifert (1996). In his paper, this star was classified as an LBV candidate. The second spectrum was obtained in 1994 Sholukhova et al. (1997) in a spectral survey of LBV candidate stars in M 33. The spectrum did not have a very good quality, however, the authors suggested that this is a WN-type star. Until 2000, V 532 remained an LBV candidate, in a well-known survey by Humphreys Humphreys & Davidson (1994) it is also described as a candidate. Explicit spectral variability of V 532 was found from the spectra, obtained from 1992 to 1999 Fabrika (2000). Photometric variability, followed by spectral variability, did not leave any doubt that V 532 is an LBV Fabrika (2000).
Later, V 532 has been spectrally studied as an LBV star in Polcaro et al. (2003); Fabrika et al. (2005); Viotti et al. (2006, 2007); Valeev, Sholukhova, & Fabrika (2009); Polcaro et al. (2010), where new evidences of spectral variability were presented. From the 1998-2001 spectra, when the star had an intermediate brightness, Fabrika et al. Fabrika et al. (2005) found that its spectrum corresponds to the Ofpe/WN9-type. Using quantitative spectral criteria introduced in Crowther & Smith (1997), they classified the star as WN10-11. In the same paper Fabrika et al. (2005) a nebula of low surface brightness was found around V 532. The stellar parameters were found in Valeev, Sholukhova, & Fabrika (2009) from the spectral energy distribution (SED), constructed based on the optical observations Massey et al. (Massey2006), performed between autumn 2000 and autumn 2001, when the star was in its intermediate brightness state (spectral class WN10-11 Fabrika et al. (2005)). The temperature of its photosphere was estimated in Valeev, Sholukhova, & Fabrika (2009) as K, luminosity , and the value of interstellar absorption . Since 2006 the apparent brightness of V 532 has heavily dropped, hence, the temperature of the photosphere has increased. In this brightness minimum the spectrum of the star was classified as WN8-9 Polcaro et al. (2010).
In this paper, we present the longest series of spectral and photometric observations of V 532, based on which we trace the variations in the stellar spectrum.
2 OBSERVATIONS
2.1 Photometric Observations
For the photometric estimates of the V 532 we used the initial data by Romano Romano (1978). These brightness estimates were obtained based on 104 photographic plates by the 67-cm Schmidt telescope of the Asiago Observatory in 1960–1977. We as well used the photo materials from the Sternberg Astronomical Institute (SAI) of Moscow State University, represented by 678 records, obtained on the 50-cm Maksutov telescope (AZT-5) in 1973–2005. Photographic observations were carried out in a system, similar to the Johnson B filter. The SAI photographic materials and the method of data reduction are described in Sharov et al. (2000); Sholukhova et al. (2002). All the photographic estimates were reduced to the B system. The accuracy of these estimates is approximately , but it decreases and the error reaches when the star gets weaker, near a plate edge the error can reach . A more detailed description of all the photographic data is presented in Zharova et al. (2011).
In 2001 we started the CCD observations of V 532. They were carried out on the 1-m Zeiss telescope of the Special Astrophysical Observatory (SAO) and the two telescopes of the Crimean Observatory of the SAI MSU—AZT-5 and 60-cm Zeiss-2 telescope. Errors of the CCD observations amount to , they are not worse than . New BVRc standards were obtained at the 1-m Zeiss telescope of the SAO RAS. They were also used for the photographic observations Zharova et al. (2011). Hence, we finally have 104 estimates by Romano Romano (1978), 645 estimates on the AZT-5, and multicolor CCD BVRc photometry (65 B, 79 V, 46 Rc) in 2001–2010. We also use several estimations by Viotti et al Viotti et al. (2006), and one by Humphreys Humphreys (1980). They are well consistent with our data.
2.2 Spectral Observations
The spectra of V 532 were obtained mainly with the 6-m BTA telescope using the UAGS, MPFS Fabrika et al. (2005) and SCORPIO Afanasiev & Moiseev (2005) instruments. We also use the spectrum of V 532, courtesy of T. Szeifert Szeifert (1996), obtained in October 1992 on the 3.5-m Calar Alto telescope with the TWIN spectrograph, and the spectrum obtained at our request by A. Knyazev on the 2.2-m Calar Alto telescope with the CAFOS spectrograph in June 1999. We also present here the spectrum we obtained on the SUBARU telescope with the FOCAS spectrograph. It has been taken within the SS 433 observational program Kubota et al. (2010) to make a comparison of spectra of these two objects. SS 433 spectrum (hot wind of the supercritical accretion disk) is very similar to the spectra of WN 10-11-type stars Fabrika (2004). The log of spectroscopic observations is given in the Table, which also presents the spectral ranges and resolution for each observation. All the spectra were processed by standard techniques, used for the corresponding spectrographs in the MIDAS and IDL environments.
0mm \onelinecaptionstrue
| JD 2400000 + | Date | Instrument / telescope | Range, Å | Resolution, Å |
|---|---|---|---|---|
| 48910 | 10.15.1992 | TWIN/Calar Alto | 4450-5000 | 2.2 |
| 48910 | 10.15.1992 | TWIN/ Calar Alto | 5800-6800 | 2.4 |
| 49366 | 01.13.1994 | MOFS/BTA | 5500-7600 | 8 |
| 51075 | 09.18.1998 | MPFS/BTA | 4450-5850 | 4.5 |
| 51222 | 02.12.1999 | UAGS/BTA | 3280-8000 | 8.3 |
| 51346 | 06.16.1999 | CAFOS 2.2 | 5170-7690 | 7.5 |
| 51347 | 06.17.1999 | CAFOS 2.2 | 3050-6050 | 7.5 |
| 51372 | 07.12.1999 | UAGS/BTA | 4330-5570 | 5.6 |
| 51372 | 07.12.1999 | UAGS/BTA | 5500-6740 | 5.6 |
| 51373 | 07.13.1999 | UAGS/BTA | 3410-8100 | 18 |
| 51408 | 08.17.1999 | UAGS/BTA | 4400-6860 | 7.5 |
| 51573 | 01.29.2000 | UAGS /BTA | 4350-6750 | 8.7 |
| 51821 | 10.03.2000 | UAGS/BTA | 4400-6820 | 8.3 |
| 51933 | 01.23.2001 | UAGS/BTA | 4310-6740 | 8.3 |
| 52150 | 08.28.2001 | UAGS/BTA | 4300-6730 | 9.4 |
| 52553 | 10.05.2002 | MPFS/BTA | 4000-7000 | 6 |
| 53322 | 11.13.2004 | MPFS/BTA | 4000-7000 | 6 |
| 53388 | 01.17.2005 | MPFS/BTA | 4000-7000 | 6 |
| 53408 | 02.06.2005 | SCORPIO/BTA | 3500-7200 | 10 |
| 53614 | 08.30.2005 | SCORPIO/BTA | 3500-7200 | 10 |
| 53683 | 11.08.2005 | SCORPIO/BTA | 3500-7200 | 10 |
| 53952 | 08.03.2006 | SCORPIO/BTA | 4000-5700 | 5 |
| 54323 | 08.10.2007 | SCORPIO/BTA | 4000-5700 | 5 |
| 54379 | 10.05.2007 | SCORPIO/BTA | 4000-5700 | 5 |
| 54382 | 10.08.2007 | FOCAS/SUBARU | 3750-5250 | 1.1 |
| 54475 | 01.08.2008 | SCORPIO/BTA | 5700-7500 | 5 |
| 54477 | 01.10.2008 | SCORPIO/BTA | 4000-5700 | 5 |
| 55097 | 08.18.2009 | SCORPIO/BTA | 3900-5700 | 5 |
| 55115 | 10.09.2009 | SCORPIO/BTA | 3100-7300 | 10 |
3 RESULTS
3.1 Photometric Variability
15mm
\onelinecaptionsfalse \captionstylenormal
Figure 1 presents all the photometric measurements of V 532 from 1960 to 2010 in the B-band. The arrows indicate the timings of the spectra. Over 50 years of observations the star revealed four strong brightness increases, one of which, occurring between 1990–1992, was the greatest. Consequently, there were some brightness minima as well, the deepest of which was in 2007–2008. The maximum brightness difference amounted to . Spectral observations cover both these extreme states of V 532. Such a brightness variability with an amplitude of in the time interval of years is typical for S Dor-type stars van Genderen (2001). The light curve of V 532 is very similar to that of AG Car Groh et al. (2009), which also revealed several brightness extrema over the past 30 years with a total amplitude of Groh et al. (2009); Stahl et al. (2001).
The scatter of the photometric estimates within one season of observations is about . It is determined not only by the measurement errors, but by real brightness variability as well. In the early photographic observations the error of one measurement amounted to , but later, in the photoelectric and CCD observations it was several times lower, still, the scatter of brightness estimates for one season is as great, about . Sholukhova et al. Sholukhova et al. (2002) studied the light curve of V 532 in the B-band. A number of quasi-periods were found with characteristic times of dozens of days both in the high and low states. Some of them were quite stable and were present in both states. The authors Sholukhova et al. (2002) suggested that periods in the range of days and shorter are linked with the stellar pulsations, and longer periods are related to the wind pulsations driven by the wind instabilities. In hydrodynamic simulations of nonlinear radial oscillations of hot LBV stars Fadeev Fadeyev (2010) has found that the periodic brightness variations in the range of days are largely of pulsational nature.
15mm
\onelinecaptionsfalse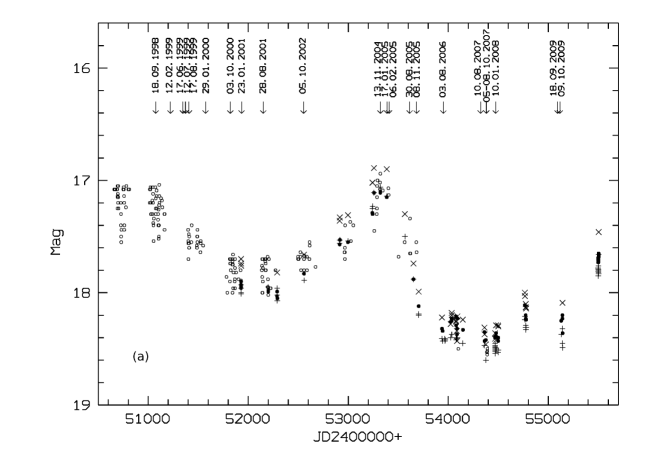
 \captionstylenormal
Figure 2a demonstrates a fragment of the light curve of V 532 in the B, V, R filters along with the photographic measurements. Spectral observations cover the local minimum of visual brightness observed in 2000–2002, the local maximum of 2004–2005, and the absolute minimum of 2007–2008 quite well. In the late 2009 (from November) the brightness of the star began to somewhat rise, and by November 2010 it increased by in the V-band. Consequently, the minimum of 2007–2008 was the deepest during the entire epoch of observations of V 532. The same figure shows the variation of BV color during the epoch of photoelectric and CCD observations. We can see that the color variations are typical of LBVs: when the star’s brightness decreases, it grows bluer, however, the variations reveal some irregularity.
Figure 3 demonstrates the BV color dependence on the B-band brightness variations. In the low state at B 17.9 the color–magnitude dependency is very irregular, the variation amplitude reaches . The B brightness of about is isolated for another reason as well, when the brightness is weaker, the color–magnitude diagram gets steeper. If we describe this dependence by a simple function without irregularities, we find:
We shall use this dependence further in the analysis of line flux variability. We adopt the value of stellar brightness in the deepest minimum as B , V with an uncertainty of about 0.05.
15mm
\onelinecaptionsfalse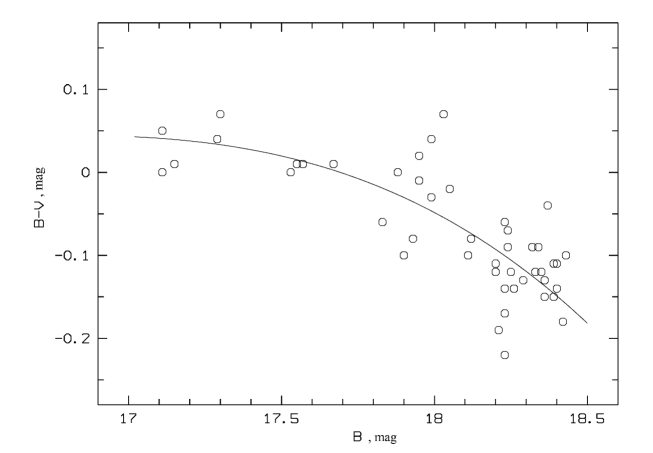 \captionstylenormal
3.2 Spectral Variability
Spectral observations cover the period from 1992 to 2009. Figures 4–7 demonstrate all the spectra we have in blue and red ranges. The identifications of key lines are shown. However, we will not dwell on the detailed identification of the spectrum of V 532 in this paper (see its description in Fabrika et al. (2005) and Polcaro et al. (2010)), rather, we will describe here the evolution of the spectrum and individual characteristic spectral lines.
Significant variations are seen in HeI line intensities, the appearance and disappearance of P Cyg type profiles, the evolution of the HeII line and the CIII/NIII Bowen blend, the appearance of forbidden lines [OIII] 4959, 5007, [FeIII] 4658, 4702, 5270, [ArIII] 7135 (the latter is not shown in the figure) and others. The HeII 5412 Å line (not shown) appears simultaneously with the strong HeII 4686 line, however, it always has a P Cyg type profile. The latter is explained quite well by a strong difference of optical depths in these lines, in the winds of WN-stars the 5412 Å line is formed close to the photosphere ( radii of the photosphere), while the 4686 Å line is formed at the distance of several tens of radii of the photosphere Hamann, Koesterke, & Wessolowski (1995).
5mm
\onelinecaptionsfalse
5mm \onelinecaptionstrue
5mm \onelinecaptionstrue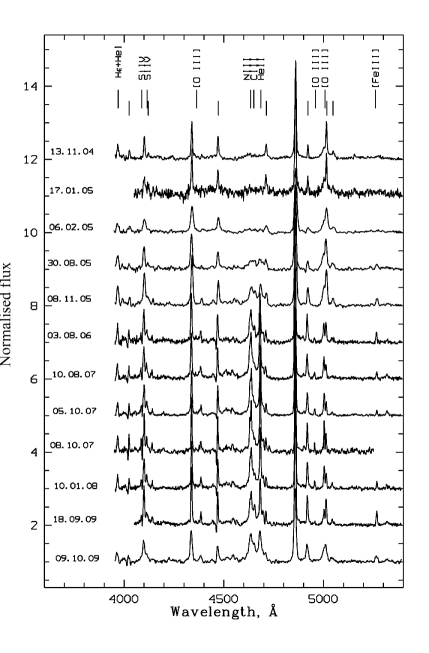
5mm \onelinecaptionstrue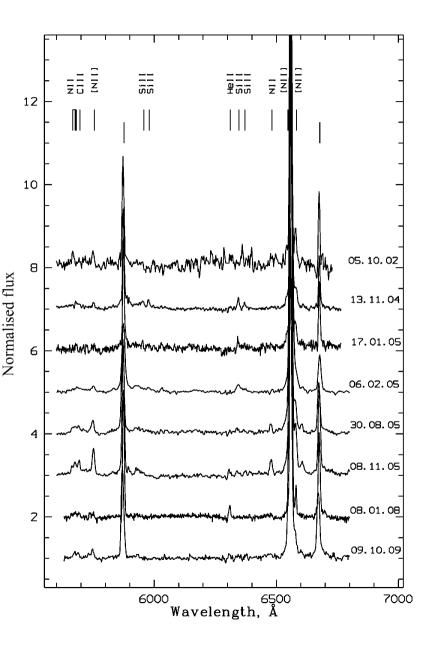
When V 532 goes through a transition from its high to low state, the spectral variations in the star are quite obvious (Fig. 4–7), the photosphere temperature increase is naturally followed by the appearance and strengthening of high-excitation lines. Spectroscopy covers two high states: one in 1990–1992 (the absolute maximum) and the other in 2004–2005, and two low states: one in 2000–2002 and the other occurring in late 2006–early 2008 (the absolute minimum). Apart from obvious variations in the spectrum, we would like to draw attention to the evolution of the broad components of most of the brightest hydrogen and helium lines. In the high state (1992 and ) there appears a broad component in the H line, which vanishes in the low state. In the intermediate high state there appears a broad component in the He I 5876 line (e.g., the 11.13.2004 spectrum), which is neither observed in the higher or low states. Similar broad wings in the He I 5876 line are found in AG Car Stahl et al. (2001) exactly in the same intermediate or close to the high brightness state. In the low state the broad wings of this line disappear Groh et al. (2009). When V 532 is in its low state, its spectrum reveals broad wings of the HeII 4686 line, but they are not observed in the HeII 5412 line. It follows from here that the broad components appear in the lines with maximal optical depth and only in the lines, for which the temperature of the photosphere is optimal to excite this transition. Consequently, broad components are in no way connected neither with the rotation of the star, nor with the Doppler broadening of the wind lines, as there are bright narrow components present in the same line profiles. The appearance of broad line wings is linked with broadening owing to the scattering of photons by free electrons in the most dense and closest to the photosphere parts of the wind.
If the appearance of broad line wings is due to the scattering of light by electrons, as usually happens with the hydrogen lines in hot supergiants, the width of the line wings is determined by a combination of optical depth in the given line and the electron temperature. In V 532, we measured the widths of the broad components, and after correcting for spectral resolution we found the following: FWHM(H, H km/s (spectrum of 10.15.92), FWHM(He I km/s (spectrum of 11.13.04). Other He I lines also reveal large pedestals in the profiles, but they are difficult to measure, FWHM(He II km/s (from the spectra of ).
We measured the radial velocity of V 532 from the spectrum, obtained by T. Szeifert on 10.15.92. From four Si II emission lines, the profiles of which are completely symmetric () the heliocentric radial velocity amounts to km/s. From the Si III absorption line the velocity is km/s (absorption lines may well have a blue shift due to the wind effects). From the forbidden line [NII] we obtained the velocity of km/s. This line most likely belongs to the extended nebula Fabrika et al. (2005), which was captured by the spectrograph slit and can not be fully subtracted. The hydrogen lines are distorted by absorption from the blue side, the He I lines are mainly in the absorption, they are very weak and may quite be distorted by emission. Hence, we did not make any velocity measurements from these lines.
We also measured radial velocities from the spectrum we took on the Subaru telescope on 10.08.2007. At this time the star was in its low/hot state. This spectrum has good quality, but almost all the major lines (He I) are distorted by the absorption from the blue side. The peak of the symmetrical H line revealed the velocity of km/s, two lines [OIII] and —the velocity of km/s. These [OIII] lines are very variable, their variation fully repeats the evolution of [FeIII] , [ArIII] 7135, [NII] 5755 and some permitted lines (see below). We believe that all these forbidden lines are formed in the outer extended stellar atmosphere, the asymmetry of which may lead to a distortion of radial velocities. Focusing on the good agreement between the radial velocities, measured from symmetrical Si II and H emission lines in the spectra, obtained with the time difference of 15 years with a better spectral resolution, we adopt the radial velocity of the star as km/s.
3.3 Spectral Classification
In the intermediate brightness state in (Fig. 2), Fabrika et al. Fabrika et al. (2005), using quantitative spectral criteria introduced by Crowther and Smith Crowther & Smith (1997) found that the spectral type of V 532 corresponds to WN10-11. Later, based on the 2008 spectra, when the star was in its lowest state, Polcaro et al. Polcaro et al. (2003) using the same criteria Crowther & Smith (1997) found that the spectral class of the star is close to WN8-9. It appears that depending on the value of visual brightness the spectral class of V 532 varies between WN11 and WN8-9.
Having the longest series of spectroscopic observations we can analyze the variability of V 532 in more detail. Figure 8 reproduces the basic diagrams from Crowther & Smith (1997), describing the classification (mainly temperature) sequences of late WN stars. In Crowther & Smith (1997) this diagram has been drawn up for the stars of the Galaxy and LMC. However, the authors have concluded that there is no fundamental difference between the stars of these two galaxies in the classification diagrams. The diagrams from Figs. 8a–8b show the relationship between the equivalent widths of He I and HeII 4686, and the relation between the equivalent width and the width of the HeII line. The widths of the HeII line (FWHM) in V 532 were corrected for instrumental resolution.
We plotted the stars WR 25 and Sk from Crowther & Smith (1997) to Fig. 8. In addition, we plotted there the stars AG Car Groh et al. (2009); Stahl et al. (2001) and HD 5980 Koenigsberger et al. (2010); Barba et al. (1995); Heydari-Malayeri et al. (1997); Foellmi et al. (2008), which are believed to have shown LBV transitions (see Introduction). The movements of these two stars in the diagrams reflect these transitions. For HD 5980 we only took the measurements that fall within the orbital phase of good visibility of the A component of the star Koenigsberger et al. (2010), which revealed the WN 11 spectrum during its famous outburst in October 1994. We can see in Fig. 8 that during this outbreak HD 5980 has indeed moved into the WN10–11 region in both diagrams. The LBV event in HD 5980 is clearly visible in the figure. Until this outbreak (one point in Fig. 8a for 1993 and two points in Fig. 8b for 1961 and 1993) the star was located in the WN6-7 region. The point following the flare (December 1994) in no way differs from all the subsequent WN6-7 state of the system () in Fig. 8b, but it differs by an increased brightness of the He I, and He II lines (WN8) in Fig. 8a.
The movements of AG Car are not so radical, however, they fully correspond to the modern ideas on LBV transitions. We marked in Fig. 8a the transition from the absolute minimum (1989, three points to the right) to the state of local minimum (2001 and 2002, points to the left), according to Groh et al. (2009). In the diagram in Fig. 8b Groh et al. (2009); Stahl et al. (2001) a group of topmost points marks the state of absolute minimum (1989–early 1990), the lowest point—one of the spectra of the absolute maximum (1995), the points in between mark an intermediate state of 1991 and a local minimum of 2001.
Hence, the movements of AG Car and HD 5980 along the WNL sequence are obvious. The star V 532 at the states of increased brightness fits well in the sequence between the low/cold state of the LBV AG Car and the LBV episode of HD 5980. In the low/hot state all the three stars are perfectly consistent with the WNL sequence Crowther & Smith (1997). However, in general, V 532 moves through the diagrams from Figs. 8a–8b in a complex manner.
15mm
\onelinecaptionsfalse
 \captionstylenormal
In Figs. 8a–8b the lowest point of V 532 (the spectrum from 10.15.1992 in the absolute brightness maximum) indicates the upper limit of the possible estimate of the equivalent width of HeII line, this line is absent. In Fig. 8b we adopted the line width equal to the spectral resolution in the spectrum. The HeI 5876 line is confidently measured. Despite the absence of HeII line in the spectrum of absolute maximum, the upper limit of its equivalent width, as well as the HeI line indicate that V 532 could pass from the states with smaller brightness to the state of absolute maximum through the region WN11, in which the star AG Car is located. On the other hand, in the absolute minimum ( and 2009) in Fig. 8a V 532 is located in the far-right position (region WN9), and in Fig. 8b—in the upper left corner, exactly halfway between WN8 and WN9 (WN8.5).
5mm \onelinecaptionsfalse \captionstylenormal
The evolution of the spectrum of V 532 is as follows. Immediately after the absolute maximum the star moves from the WN11 region (the LBV region) into the WN10-11 region in Fig. 8a, and also into the WN10-11 region in Fig. 8b (, the state before the local minimum), this transition is marked by the dotted line in Figs. 8a–8b. Further, in the local minimum of , the star moves to the WN9 region towards its position in the absolute minimum. Later, the behavior of V 532 becomes unusual in the transition to the local maximum of . At this time HeII line distinctly broadens. In Fig. 8b the star passes the region between two known objects WR 25 (HD 93162 WN6ha) and Sk (O3 If/WN6), it leaves the main sequence of WNL stars, and its spectral class (formally) becomes WN9–10, in Fig. 8a in this state the star becomes WN10.
The stars WR 25 and Sk possess very high luminosities and high hydrogen abundances in the atmospheres Crowther & Smith (1997). The temperatures of these stars are high enough, HeI lines are practically absent in their spectra (Fig 8a and Crowther & Smith (1997)). The movement of V 532 in the direction of WR 25 and Sk in Fig. 8b is not related to the decrease in the size of the photosphere and the corresponding increase of the escape velocity of the star (i.e., the wind velocity, as it likely occurs in the stars WR 25, and Sk ), but rather with the HeII line broadening as a result of Thomson scattering.
By contrast, in 2004–2005 the size of the photosphere of V 532 increased, as the stellar brightness grew in the visual region. Following simple logic, He II line should become narrower, since the escape velocity of the star has dropped, but in fact it broadened. This broadening has caused V 532 to move away from the general sequence. We associate the He II line broadening with the scattering of photons of this line, by the electrons. The most extreme point in this figure with FWHM(He II) Å is uncertain, since the line has noticeably weakened at the time. In addition, the He II line is located in a complex blend. Below, we describe the two-component profile of the He II line, however, in Figs. 8a–8b all the width measurements were made under the assumption of a single-component profile. The remaining measurements of the He II line width in this figure are quite reliable.
When the visual brightness increases, all the three stars, AG Car, V 532 and HD 5980 form a separate sequence, which is not consistent with the WNL sequence Crowther & Smith (1997) and goes beyond its limits. In times of visual brightness minima all the three stars perfectly fit into the sequence of WNL stars. This result is important. Perhaps the departure from the WNL sequence is related to the HeII line broadening due to the same Thomson scattering with increasing optical depth in this line. However, it is possible that this is a new property of LBV stars, in the high state they do not correspond to the latest bona fide WNL stars. We know only three examples of such transitions, and naturally, additional observations and new objects are required for more reliable conclusions.
From the spectral classification of WN stars Smith, Shara, & Moffat (1996) by several criteria we additionally found the spectral class of V 532. The ratio of HeII /HeI line intensities, defined as the peak/continuum ratio (the first line has a clear P Cyg type profile, hence the ratio of equivalent widths gives an inaccurate result and a large scatter) appears to be equal to , which means the WN8 type (possibly, WN8.5). It is interesting that this ratio is equal both in the absolute minimum, and in the local maximum of . In the spectra of the absolute minimum the ratio of lines N V/N III, what also indicates spectral type WN8-9 Smith, Shara, & Moffat (1996).
The ratio N IV /N III in the state of absolute minimum (specifically, from the Subaru spectrum of 10.08.2007) also yields WN8-9. The line CIV is not found in this minimum, it also suggests that the star has the WN8 class or later. The relative abundance H+/He++, calculated by the ratio of lines (H He) both from 4861 Å, and from 4340 Å to the geometric mean of their neighboring Pickering lines Smith, Shara, & Moffat (1996) appears to be equal to , which means a subclass ‘‘h’’, i.e. an explicit presence of hydrogen.
3.4 Temperature Variations in the Photosphere
and Wind
Figures 9 and 10 represent the variations in relative intensity of major lines from 1999 to 2009 with time. In this time interval, our observations allow us to trace the variations in the spectrum with the variations of apparent brightness of the star. Relative intensities are obtained from the equivalent line widths, which were corrected for brightness variations. We assumed that during the absolute minimum of (with the average brightness B , V ) the star V 532 is in its true state. All the equivalent widths are reduced to the state of this minimum brightness in the V or B-band. To this end, we used a photometric light curve, and in the spectral observations where there are no measurements in the V-band, we used the approximation obtained above,
(Fig. 3). The I(B) value in these figures is the intensity of stellar emission in the B-band, reduced to B , i.e., I(B , and the relative line intensities in Figs. 9, 10 and 12 are their equivalent widths multiplied by I(B).
Fig. 9 shows the evolution of He I lines and the He II line. The next figure shows the evolution of the forbidden lines [OIII] , [NII] , [FeIII] and permitted line NII . An estimated position of the center of local brightness maximum of is shown by the vertical dotted line.
10mm \onelinecaptionstrue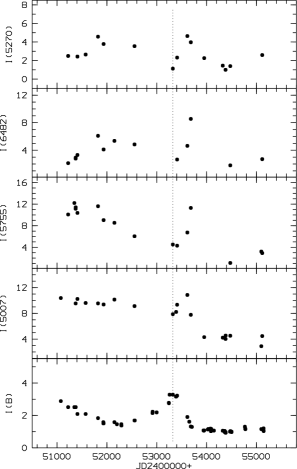 \captionstylenormal
The most notable feature of the line intensity variations is that all the lines behave roughly according to their ionization potentials (or excitation, if these are neutral atoms) and the temperature of the stellar photosphere. In the local maximum the temperature significantly decreases, and consequently, the intensity of He I lines increases while the intensity of He II lines drops. Further, when the temperature of the photosphere significantly increases during the absolute minimum, these lines vary inversely. The potential of the first ionization of the helium atom is 24.6 eV, (the second ionization—54.4 eV), hence, at the increasing temperature (Figs. 9 and 12) HeI decays into HeII. Ionization potentials of ions, shown in Fig. 10 amount to 30–55 eV, but to reach this ionization, 15–35 eV are required. Due to the rough closeness of their ionization potentials, the behavior of lines in this figure is similar, although the conditions of formation of the forbidden and permitted lines, as well as these three forbidden lines ([NII], [FeIII], [OIII]) between each other are different. Such a behavior of fundamentally different lines, demonstrated in Fig. 10, suggests that these lines are formed at about the same distance from the stellar photosphere, and their behavior is determined by the temperature variations in the photosphere.
The local maximum of 2004–2005 is fairly sharp, the transition to the state of absolute minimum is fast, as opposed to the slow brightness fading in . In the transition to the absolute minimum, there is a rapid temperature increase in the photosphere, the line intensity peak in Fig. 10 is delayed relative to the continuum intensity peak I(B). There comes a feeling as if the ‘‘stellar outburst’’ (the local maximum of ) leads to the brightening and excitation of distant parts of the gas envelope around V 532, which was ejected in the earlier stages of activity Polcaro et al. (2010). This interpretation seems to be very controversial, since at the time of local maximum the temperature of the photosphere did not increase, on the contrary, it dropped, and quite notably (see below). The values of ‘‘lags’’ themselves are very large, from 220 days for [OIII] and [FeIII] to 350 days for [NII] (Fig. 10). The physical dimensions of such an envelope would correspond to pc. At this distance, for a noticeable additional ionization of gas a more powerful flash of radiation is needed.
The delay of the peak line intensities in Fig. 10 is probably due to the rapid temperature increase in the photosphere of V 532 after the local maximum. Line intensities increase when the temperature of the photosphere becomes optimal for the given ion. Indeed, the difference in the lag values of [OIII], [FeIII], and [NII] roughly corresponds (see Fig. 12 below) to different photosphere temperatures at the times of maxima of these lines. The He I, and He II lines in Fig. 9 as well behave accordingly with the temperature of stellar photosphere at any given moment of time (despite the fact that Fig. 12 presents the temperature variations of V 532 with time, we would like to emphasize that we describe here the qualitative behavior of the temperature only, as the quantitative analysis requires far more detailed calculations). Consequently, the envelope surrounding the star, in which all these lines form is compact, it is in fact an extended atmosphere of the star (the wind). During the local maximum, He II line is very weak, but clearly broadened, as discussed above (Fig. 8b). In the state of absolute maximum this line is very bright and has an explicit broad component. For Fig. 9 we approximated it as a one-component line, since a two-component profile of He II can be reliably studied only from the spectra with the highest S/N ratio. Below, we discuss the broad component 4686 and its behavior.
15mm
\onelinecaptionsfalse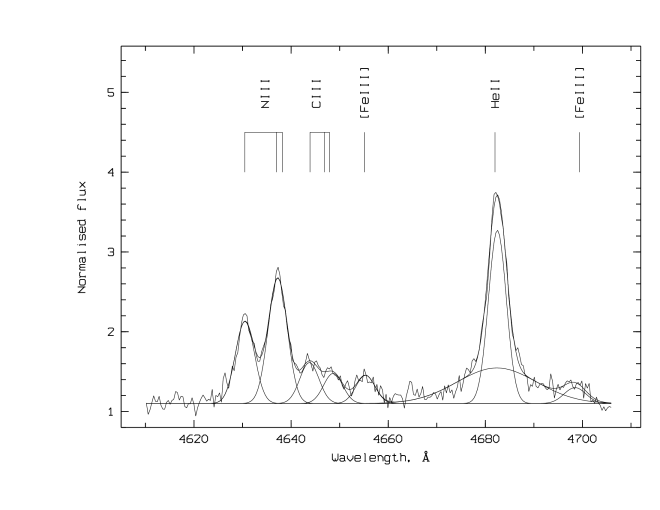 \captionstylenormal
Figure 11 presents a fragment of the spectrum of V 532 (Subaru, 10.08.07, the resolution in this spectrum is 1.1 Å ), which includes a Bowen blend and the He II line with an example of a two-component Gaussian line profile analysis of the latter line. The same line width was set for all seven lines, presented in the figure (the narrow component of He II is one of the seven lines), but for the He II line we added a broad component, the position of which coincides with the position of the narrow component. It was found that ‘‘narrow’’ lines have FWHM Å (taking into account the spectral resolution) or 270 km/s, while the broad component of this spectrum has FWHM Å or 1250 km/s. As noted above, the average width of the broad component of this He II line based on all spectra, in which it was possible to make the two-component Gaussian analysis, amounts to 1500 km/s.
The He II line has an absorption component from the blue side (a P Cyg type profile), however, the 4686 Å line did not reveal such a feature. In addition, the 5412 Å line is narrow. Even if we assume that the 5412 Å line is more narrow due to the absorption component, and try to construct the original He II profile, then the width of such a profile would not be over 10 Å (less than 550 km/s).
Above we explain the emergence of a broad component in the He II line by the broadening due to the scattering of photons by electrons. Broad components appear both in the hydrogen lines, and in the He I line in such states of the star, when the temperature of the photosphere is optimal for the formation of these lines. Which line shows a broad component is determined by the temperature of dense parts of the wind in the given state of the star. We explained the absence of a broad component in the 5412 Å line by a significantly smaller optical thickness of this line compared to the 4686 Å line, what is observed in the winds of WN stars Hamann, Koesterke, & Wessolowski (1995). The narrow profile of the 5412 Å line, as well as the presence of absorption in its blue wing is fully consistent with this explanation. It means that the 5412 Å line is formed substantially closer to the stellar photosphere than the 4686 Å line. A small width of the 5412 Å line indicates that the wind velocity close to photosphere of V 532 is relatively low and a broad component 4686 Å does appear due to the Thomson scattering.
5mm \onelinecaptionstrue \captionstylenormal
Figure 12 demonstrates intensity variations of the broad and narrow components of the He II line, intensity variation of the He II line and the Bowen blend (measured in the wavelength range of 4605–4665 Å). This figure is similar to Figs. 9 and 10, as before, the relative intensities I of the lines are derived from their equivalent widths as I EW I(B). We can see that the 5412 Å line does not behave exactly like the 4686 Å line in general (Fig. 9). Its intensity is maximal during the absolute minimum, as well as in line 4686 Å, but in the local maximum of 2004 its intensity is also high (the 4686 Å line is weak at that time). The broad component of 4686 Å notably increases during the absolute minimum, as it should if it is formed due to Thomson scattering. The narrow component of 4686 Å is to a large extent similar to the behavior of the 5412 Å line, it does not reveal such a strong maximum at the time when the temperature of the photosphere dramatically increases. This is also consistent with the idea of formation of broad component due to the light scattering by electrons, because then a part of energy in the 4686 Å line is pumped into its broad component. The behavior of the Bowen blend CIII/NIII is consistent with the behavior of the photosphere temperature. The optimum temperature for the formation of this blend ( K) is notably lower than the optimum temperature for the formation of the He II line (about 50000 K). Therefore, during the absolute minimum the intensity of the blend CIII/NIII increases not as much as the intensity of the He II line.
The B-band radiation at the photosphere temperature of about K (the radiation peak is within Å) falls into the Rayleigh-Jeans part of the spectrum. Hence, we can use the approximation I(B) , where is the radius of the stellar photosphere, and is the temperature of its photosphere. The variability of S Dor-type LBVs (not in giant eruptions that occurred in Car and P Cyg) fulfills the condition const in the first approximation. Thus, we can quite reliably estimate the temperature of an LBV from its optical brightness, for example, in the B-band, from the ratio I(B)-1/3, provided that the temperature was once found independently.
In Valeev, Sholukhova, & Fabrika (2009) the temperature of the photosphere of V 532 was estimated as K by fitting its SED from the optical observations Massey et al. (Massey2006), obtained from autumn 2000 to autumn 2001, when the star was in the intermediate brightness state (B 17.8). We plan to determine more accurately the basic parameters of V 532 in another paper. Nevertheless, the temperature variation with time (Fig. 12), obtained based on this estimate is consistent with the behavior of lines of different excitation and ionization potentials, demonstrated in Figs. 9, 10 and 12. The delay of peak intensities of lines, presented in Fig. 10 is perfectly consistent with the temperature variation in Fig. 12. To the time of maximal intensities of [OIII], [FeIII] and [NII] lines the temperature of the photosphere has increased from about 30000 K to 38000 K. Further, in the absolute minimum the temperature of the photosphere has increased even more, up to about 42000 K and all of these ions had to get to the next ionization stage. Consequently, the intensities of these lines have sharply weakened (Fig. 10).
3.5 Wind Velocity Variations, Acceleration of the Wind
In this section we estimate the wind velocity in V 532, and its variations depending on the state of the star, i.e. its brightness. Under the wind velocity we understand the velocity difference between the absorption line core and the emission peak , measured from the P Cyg profiles of different lines. The value is not an exact wind velocity, but it is directly related to it. traces the expansion of the atmosphere in the place of the line formation. The terminal wind velocity is usually somewhat greater than the escape velocity of the star (), being also directly related to it.
Using simple ratios, described in the previous section, we can find that I(B)-1/3, hence, it depends on the optical brightness as well as the temperature of the photosphere. In contrast to the relations I(B)-1/3 and I(B)2/3, which must be correct for LBV stars, the dependence I(B)-1/3 may well be inaccurate, as the final wind velocity depends on a number of conditions in the atmosphere. Moreover, if we identify with , which can be directly measured, i.e. if we use a relation I(B)-1/3 we can make a significant quantitative error. But qualitatively, with an increase in the size of the stellar photosphere (which depends on the optical brightness as I(B)2/3) the wind velocity should decline.
9mm \onelinecaptionsfalse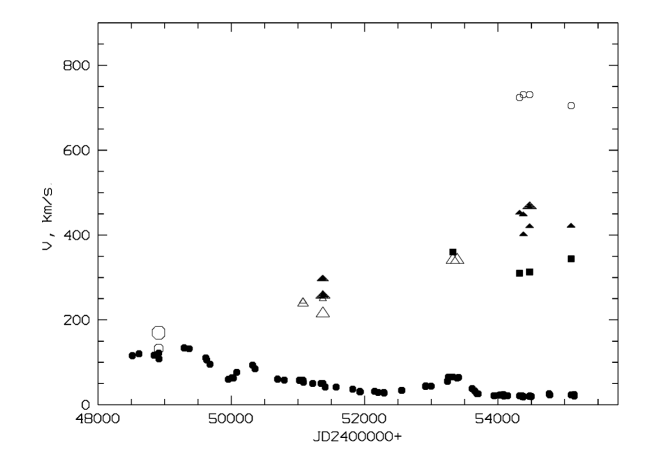 \captionstylenormal
Figure 13 demonstrates wind velocity variations of V 532 with time, measured as . The velocity is measured from all the spectra we have, and in all the lines revealing P Cyg type profiles. If the spectra contain many lines of one type (e.g., the lines of hydrogen or He I) with a P Cyg profile, then, in order not to overload the figure, we show the results of measurements only for those lines, in which the absorption core can be most reliably measured. The same figure demonstrates the variation of I(B) with time, for convenience the value of I(B) is multiplied by a factor of 20. We can see that in the state of absolute maximum the wind velocity is the lowest. At this time the P Cyg type profile is perceivable only in hydrogen lines. The rate of expansion of the atmosphere is higher in the line of H than in H, which is natural, as the first line is formed in higher layers of the atmosphere. In the state of intermediate brightness and during the local maximum of , P Cyg profiles were revealed only by He I lines, both by singlets and triplets.
In the state of absolute minimum P Cyg profile was observed in He I, He II lines and in the hydrogen H line. It is important that in this state P Cyg profiles were revealed only by the triplet lines of He I, which is due to the difference from the singlet lines in their formation. We can see (Fig. 13) that in the state of absolute minimum a clear correlation is observed between the excitation potential and the velocity in , the higher the potential, the lower the velocity of wind.
8mm \onelinecaptionsfalse \captionstylenormal
Figure 14 demonstrates the dependence of the wind velocity on the relative optical brightness. We can see that with decreasing brightness I(B), that is, with declining size of the photosphere the wind expansion velocity is clearly increasing. As noted above, the radius of the LBV star is determined quite well by the dependence I(B)2/3, but the wind velocity can only very conditionally be expressed by the relation I(B)-1/3, the more so since the value determines only the velocity of expansion in the region of formation of this line. Nevertheless, the expansion velocities, measured from the H line in the state of absolute maximum, He I lines in the intermediate state, and He II line in the state of absolute minimum are consistent with the dependence I(B)-1/3. In each of the these states, these lines are formed in the deeper parts of the wind, and perhaps for this reason this simple relationship holds (however, H line in the state of maximum brightness is formed higher than H line).
In the state of absolute minimum we can see the kinematic profile of the atmosphere (Fig. 13 and 14): the lowest wind velocity ( km/s) is observed in the He II line, intermediate velocity in this state ( km/s) is observed in the triplet He I lines, and the maximum velocity ( km/s) is observed in H line. The interpretation of this dependence is clear, the wind velocity increases outwards according to the acceleration of wind. In addition, it clearly shows that the temperature of the wind in the extended atmosphere of V 532 declines with distance from the star. The gas temperature in the wind may be determined by many factors. They define the energy balance between the heating through radiation (heating by shock waves is also possible, if such exist in the winds of LBV) and the gas cooling. The cooling of gas occurs both through radiation, and due to expansion. One way or another, we can confidently conclude that we have found explicit evidence of acceleration and cooling of the wind of V 532 based on the spectra of V 532 in absolute minimum.
4 CONCLUSION
This paper presents the results of the most complete spectroscopy of an LBV star V 532 in M 33. The spectra cover both the absolute maximum occurring between (the high/cold state), and the absolute minimum of (the low/hot state). The brightness difference between these extremes amounts to . In addition to the extreme brightness states of V 532, spectral observations also cover the local minimum and maximum of . The variability of the spectrum of V 532 completely corresponds to the variations in temperature of its photosphere depending on the visual brightness ( I(B)-1/3) in the B-band.
Following the estimation of the photosphere temperature of V 532 from Valeev, Sholukhova, & Fabrika (2009), K, calculated from the data obtained when the star was in its intermediate state (), in the absolute minimum its temperature reached K, while in the absolute maximum the photosphere cooled down to K. Despite the fact that these estimates of the photosphere temperature are quite rough (a special simulation of the V 532 spectrum is needed), the appearance, variation and disappearance of major lines in the stellar spectrum is fully consistent with their ionization potentials (excitation in the case of neutral atoms) and current temperature of the photosphere. Even the forbidden lines of [OIII], [FeIII], [ArIII] and [NII] 5755 behave accordingly with the permitted lines and follow the same dependence on the temperature of the photosphere. We hence conclude that the envelope around the star, in which all these lines are formed is relatively compact, it is an extended atmosphere of the star (its wind). In contrast to the line [NII] 5755, the line [NII] belongs to the extended nebula sized tens of pc Fabrika et al. (2005), which, however, is captured by the spectrograph slit and can not be removed.
We have traced the evolution of broad components of the brightest lines. In the spectrum of V 532 they appear in the strongest lines of hydrogen, HeI and HeII 4686, their width ranging from 1100 to 1800 km/s. Broad components also behave in parallel with the temperature of the photosphere. In the high state a broad component appears in hydrogen lines, when the temperature of the star increases, the broad wings disappear. In the intermediate state a broad component appears in the He I 5876 line, this component is not observed in hotter or colder states. In the low state, broad wings appear in the HeII 4686 line, however, they are not observed in the line of the same ion HeII 5412. It follows from this that broad components appear in the lines with maximal optical depth, and only in those states/lines, when the temperature of the photosphere is optimal for the excitation of the given transition. Consequently, broad components are in no way connected with stellar rotation or with the Doppler broadening of spectral lines in the wind, since the bright narrow components are present in the same line profiles. The appearance of broad line wings is related to the broadening due to the Thomson scattering in the most dense and closest to the photosphere parts of the wind.
The HeII 5412 emission is relatively narrow. In contrast to the 4686 Å line, its profile reveals an absorption component, shifted towards the blue region. We explain the absence of a broad component in the 5412 Å line by a significantly lower optical depth of this line, compared with the 4686 Å line, as it is known in the winds of WN stars Hamann, Koesterke, & Wessolowski (1995). A narrow profile of the 5412 Å line, and the presence of absorption in its blue wing is fully consistent with this explanation, i.e. the 5412 Å line is formed much closer to the photosphere of the star than the 4686 Å line. A small width of the 5412 Å line indicates that the wind velocity close to the photosphere is relatively low, and the broad component of 4686 Å does indeed appear due to the Thomson scattering.
Radial velocity of V 532 is km/s, it is constant with an accuracy of a few km/s. This value was found from the two best spectra, obtained with the time difference of 15 years. The wind velocity of V 532, measured as varies with time. The velocity is measured from all the spectra we have, and in all the lines, revealing P Cyg type profiles. The wind velocity clearly depends on the radius of the stellar photosphere (which is determined sufficiently well by the relationship I(B)2/3), i.e. on the value of visual brightness of the star. With decreasing brightness I(B), or with declining size of the photosphere the wind velocity increases. This is discovered based on different lines, in so far as when the temperature of the photosphere changes, different lines reveal P Cyg-type profiles.
In the absolute minimum we managed to find the kinematic profile of the atmosphere of V 532. The lowest wind velocity ( km/s) is observed in the He II line, intermediate velocity ( km/s) is observed in the triplet He I lines, while the maximum wind velocity ( km/s) is observed in the H line. This implies that the wind velocity increases outwards, and that the wind temperature in the extended atmosphere of V 532 decreases with distance from the star.
Using quantitative spectral criteria, introduced in Crowther & Smith (1997), it was found in Fabrika et al. (2005) that in the intermediate brightness state of , the spectral type of the star corresponds to WN10-11. When the star was in the low/hot state, Polcaro et al. Polcaro et al. (2003), using the same criteria Crowther & Smith (1997) found that the spectral type of V 532 was close to WN8-9. It means that the spectral class of V 532 varies between WN11 and WN8-9 depending on visual brightness. We confirm these results based on a more representative set of spectra. Using the criteria of spectral classification of WN stars from Smith, Shara, & Moffat (1996) we have identified the spectral class of V 532 in its low state as WN8.5h, based on several criteria.
Using the Crowther and Smith diagrams Crowther & Smith (1997) we have traced the evolution of V 532 along with the evolution of two other LBV stars, AG Car and the WN component of the massive binary HD 5980. AG Car has over the past few years shown the -type transition. HD 5980 has revealed the reverse transition, more precisely, an LBV episode in autumn 1994. Hence, only three objects are known by now that can be studied in detail in their -type transitions, namely, V 532, AG Car and HD 5980.
We found that during the visual minima all the three stars perfectly fit into the sequence of WNL stars Crowther & Smith (1997). However, when the visual brightness increases, all the three stars, AG Car, V 532 and HD 5980 form a separate sequence, not consistent with the WNL sequence Crowther & Smith (1997), and hence they depart beyond its limits. Meanwhile, V 532, both in the local maximum, and with increasing visual brightness falls into one and the same new sequence.
The departure from the WNL sequence with increasing brightness is related to the HeII 4686 line broadening, when its width does not correspond to its equivalent width, which is required to remain within the WNL sequence. Perhaps this is due to the wind which is denser, than those, observed in the WNL stars, i.e., due to the line broadening via the Thomson scattering. It is possible that what we see is a new property of LBV stars, when in the high/cold state they do not correspond to the latest bona fide WNL stars. We presently know only three examples of such transitions. Obviously, to make more reliable conclusions one requires additional observations and new objects.
Acknowledgements.
The authors thank T. Szeifert for the kindly presented spectra, A. Knyazev for spectroscopic observations performed with the CAFOS on the 2.2-m Calar-Alto telescope and the reduction of obtained spectra, E.A. Barsukova for her assistance with photometric observations and spectra processing, and E.L. Chentsov for useful discussions. The work was supported by the RFBR grants nos. 09-02-00163, 10-02-00463, the grant Leading Research Schools of Russia no. 5473.2010.2., and by the federal grant Scientific and Teaching Staff of Innovative Russia , P1244.References
- Humphreys & Davidson (1994) R. M. Humphreys and K. Davidson, Publ. Astronom. Soc. Pacific 106, 1025 (1994).
- van Genderen (2001) A. M. van Genderen, Astronom. and Astrophys. 366, 508 (2001).
- Smith & Conti (2008) N. Smith and P. S. Conti, Astrophys. J. 679, 1467 (2008).
- Szeifert (1996) T. Szeifert, LIACo 33, 459 (1996).
- Clark, Larionov, & Arkharov (2005) J. S. Clark, V. M. Larionov, and A. Arkharov, Astronom. and Astrophys. 435, 239 (2005).
- Smith, Crowther, & Prinja (1994) L. J. Smith, P. A. Crowther, and R. K. Prinja, Astronom. and Astrophys. 281, 833 (1994).
- Walborn (1977) N. R. Walborn, Astrophys. J. 215, 53 (1977).
- Groh et al. (2009) J. H. Groh, D. J. Hillier, A. Damineli, et al., Astrophys. J. 698, 1698 (2009).
- Koenigsberger et al. (2010) G. Koenigsberger, L. Georgiev, D. J. Hillier, et al., Astronom. J. 139, 2600 (2010).
- Artyukhina et al. (1995) N. M. Artyukhina et al., General Catalog of Variable Stars (Kosmosinform, Moscow, 1995).
- Romano (1978) G. Romano, Astronom. and Astrophys. 67, 291 (1978).
- Sharov (1990) A. S. Sharov, Sov. Astron. 34, 364 (1990).
- Kurtev et al. (2000) R. Kurtev, O. Sholukhova, J. Borissova, and L. Georgiev, IBVS 4922, 1 (2000).
- Kurtev et al. (2001) R. Kurtev, O. Sholukhova, J. Borissova and L. Georgiev, Rev. Mex. Astronom. and Astrophys. 37, 57 (2001).
- Sholukhova et al. (2002) O. Sholukhova, A. Zharova, S. Fabrika, and D. Malinovskii, ASPC 259, 522 (2002).
- Zharova et al. (2011) A. Zharova, V. Goranskij, O. N. Sholukhova, and S. N. Fabrika, Peremennye Zvezdy Prilozhenie, 11, no. 11 (2011).
- Stahl et al. (2001) O. Stahl, I. Jankovics, J. Kovács, et al., Astronom. and Astrophys. 375, 54 (2001).
- Sholukhova et al. (1997) O. N. Sholukhova, S. N. Fabrika, V. V. Vlasyuk, and A. N. Burenkov, Aston. Lett. 23, 458 (1997).
- Fabrika (2000) S. Fabrika, ASPC 204, 57 (2000).
- Polcaro et al. (2003) V. F. Polcaro, R. Gualandi, L. Norci, et al., Astronom. and Astrophys. 411, 193 (2003).
- Fabrika et al. (2005) S. Fabrika, O. Sholukhova, T. Becker, et al., Astronom. and Astrophys. 437, 217 (2005).
- Viotti et al. (2006) R. F. Viotti, C. Rossi, V. F. Polcaro, et al., Astronom. and Astrophys. 458, 225 (2006).
- Viotti et al. (2007) R. F. Viotti, S. Galleti, R. Gualandi, et al., Astronom. and Astrophys. 464, L53 (2007).
- Valeev, Sholukhova, & Fabrika (2009) A. F. Valeev, O. Sholukhova, and S. Fabrika, Monthly Notices Roy. Astronom. Soc. 396, L21 (2009).
- Polcaro et al. (2010) V. F. Polcaro, R. F. Viotti, C. Rossi, et al., arXiv:1010.2136.
- Crowther & Smith (1997) P. A. Crowther and L. J. Smith, Astronom. and Astrophys. 320, 500 (1997).
- Massey et al. (Massey2006) P. Massey, K. A. G. Olsen, P. W. Hodge, et al., Astronom. J. 131, 2478 (2006).
- Sharov et al. (2000) A. S. Sharov, A. Alksnis, A. V. Zharova, and Y. A. Shokin, Astron. Lett. 26, 433 (2000).
- Humphreys (1980) R. M. Humphreys, Astrophys. J. 241, 587 (1980).
- Afanasiev & Moiseev (2005) V. L. Afanasiev and A. V. Moiseev, Astron. Lett. 31, 194 (2005).
- Kubota et al. (2010) K. Kubota, Y. Ueda, S. Fabrika, et al., Astrophys. J. 709, 1374 (2010).
- Fabrika (2004) S. Fabrika, ASPRv 12, 1 (2004).
- Fadeyev (2010) Y. A. Fadeyev, Astron. Lett. 36, 362 (2010).
- Hamann, Koesterke, & Wessolowski (1995) W.-R. Hamann, L. Koesterke, and U. Wessolowski, Astronom. and Astrophys. 299, 151 (1995).
- Barba et al. (1995) R. H. Barba, V. S. Niemela, G. Baume, and R. A. Vazquez, Astrophys. J. 446, L23 (1995).
- Heydari-Malayeri et al. (1997) M. Heydari-Malayeri, G. Rauw, O. Esslinger, and J.-L. Beuzit, Astronom. and Astrophys. 322, 554 (1997).
- Foellmi et al. (2008) C. Foellmi, et al., Rev. Mex. Astronom. and Astrophys. 44, 3 (2008).
- Smith, Shara, & Moffat (1996) L. F. Smith, M. M. Shara, and A. F. J. Moffat, Monthly Notices Roy. Astronom. Soc. 281, 163 (1996).