A Survey of 286 Virgo Cluster Galaxies at Optical griz and Near-IR -band: Surface Brightness Profiles and Bulge-Disk Decompositions
Abstract
We present ,,, and H-band surface brightness profiles and bulge-disk decompositions for a morphologically-broad sample of 286 Virgo cluster catalog (VCC) galaxies. The H-band data come from a variety of sources including our survey of 171 VCC galaxies at the UH 2.2-m, CFHT and UKIRT telescopes, and another 115 galaxies from the Two-Micron All-Sky Survey (2MASS) and GOLDMine archives. The optical data for all 286 VCC galaxies were extracted from Sloan Digital Sky Survey (SDSS) images. The H-band and SDSS data were analyzed in a homogeneous manner using our own software, yielding a consistent set of deep, multi-band surface brightness profiles for each galaxy. Average surface brightness profiles per morphological bin were created in order to characterize the variety of galaxy light profiles across the Hubble sequence. The 1D bulge-disk decomposition parameters, as well as non-parametric galaxy measures, such as effective radius, effective surface brightness and light concentration, are presented for all 286 VCC galaxies in each of the five optical/near-infrared wavebands. The profile decompositions account for bulge and disk components, spiral arms, nucleus and atmospheric blurring. The Virgo spiral galaxy bulges typically have a Sérsic index , while elliptical galaxies prefer . No galaxy spheroid requires . The light profiles for 70% of the Virgo elliptical galaxies reveal the presence of both a spheroid and disk component. A more in-depth discussion of the structural parameter trends can be found in McDonald et al. (2009b). The data provided here should serve as a base for studies of galaxy structure and stellar populations in the cluster environment. The galaxy light profiles and bulge-disk decomposition results are available at the Centre de Données astronomiques de Strasbourg (CDS; http://cds.u-strasbg.fr/) and the author’s own website (http://www.astro.queensu.ca/virgo).
1 Introduction
The advent of large-area near-infrared (NIR) surveys such as the Two-Micron All Sky Survey (Skrutskie et al. 2006; hereafter 2MASS) and the UKIRT Infrared Deep Sky Survey (Lawrence et al. 2007; hereafter UKIDSS) has forever improved our understanding of galaxy structure and evolution. The NIR data provide an unobscured view of galaxy structure, due to the relative insensitivity of NIR light to dust extinction, while probing the oldest and most representative stellar populations by mass. Unfortunately, the aforementioned surveys, designed largely for the study of bright infrared sources, use short exposure times (7.8 and 40 seconds for 2MASS and UKIDSS, respectively), and suffer from the tremendous brightness of the NIR sky (typically 3 orders of magnitude brighter than at -band), leading to rather shallow surface brightness limits for galaxy studies when compared to similarly-designed optical surveys.
The stability of the optical night sky, especially at - and -bands, allows for deep, accurate optical surface photometry with relatively short integrations and careful data processing. The Sloan Digital Sky Survey (Adelman-McCarthy et al. 2008; hereafter SDSS) has revolutionized optical astronomy, increasing the wealth of available astronomical data (both photometric and spectroscopic) by orders of magnitude. A development made possible by the SDSS was the unraveling of bimodalities in various galaxy properties such as color, star formation rate and clustering (e.g., Strateva et al. 2003; Blanton et al. 2003; Kauffmann et al. 2003; Baldry et al. 2004; Brinchmann et al. 2004; Balogh et al. 2004). These and other studies have provided firm evidence that galaxies can be separated into two distinct classes: blue, star-forming galaxies found primarily in the field, and red, quiescent galaxies found primarily in clusters.
Prior to these findings, Tully & Verheijen (1997; hereafter TV97) reported a different form of galaxy structural bimodality. This one, independent of the SDSS colour bimodality, was based on a sample of 62 members of the Ursa Major (UMa) cluster of galaxies; TV97 found a bimodal distribution in the distribution of K′-band (2.2 m) surface brightness of galaxy disks. McDonald et al. (2009a), who re-analyzed the same UMa data using more sophisticated light profile decompositions to measure the disk structural parameters, corroborated TV97’s results. Bell & de Blok (2000) have however argued that the UMa sample was too small for a statistically significant proof of bimodality. It is partly this unresolved issue, as well as the need for a complete NIR survey of a nearby galaxy cluster to study the (dust-free) structural parameters and stellar populations of cluster galaxies, that motivated our NIR survey of the Virgo cluster.
Using the optical and NIR data presented in this paper, McDonald et al. (2009b) performed 1D bulge-disk decompositions for 286 Virgo cluster galaxy surface brightness profiles and bolstered the evidence for a disk surface brightness bimodality. Furthermore, it was found for galaxies of all morphologies, that the effective surface brightness (defined as the surface brightness measured at the half-light radius) distribution had three peaks, each defining: (i) high surface brightness, gas-poor galaxies, (ii) low surface brightness, gas-poor galaxies and high surface brightness, gas-rich galaxies, and (iii) low surface brightness, gas-rich galaxies. A more thorough discussion of these, and other results from this survey, can be found in McDonald et al. (2009b).
This paper presents the deep, optical and NIR surface brightness profiles for our sample of 286 Virgo cluster galaxies. The paper outline is as follows: we describe in §2 the sample selection and the optical and NIR data acquisition. In §3, we give an overview of our NIR data reduction methods and we describe in §4 the process of surface brightness profile extraction for both the optical and NIR data. We discuss in §5 the quality of the NIR data and compare our data products with those from 2MASS and SDSS. The full collection of surface brightness profiles is presented in §6, along with a brief analysis of the average profile shape for various galaxy types. Galaxy structural parameters from our light profile decompositions and from non-parametric galaxy measurements are presented in §7. We conclude and ponder future work in §8.
In this paper, we assume a distance of 16.5 Mpc or m-M=31.18 for all Virgo cluster galaxies (Mei et al. 2007). At that distance, = 80 pc.
2 Virgo Sample
The construction of an unbiased distribution of galaxy surface brightness requires volume completeness, which can be most easily obtained for galaxies in a cluster which all lie at a common distance. Our sample is drawn from the Virgo cluster catalogue of Binggeli et al. (1985; hereafter VCC). The VCC catalogue contains 2096 galaxies within an area of 140 deg2 on the sky, centered on the galaxy M87 at 12h25m and 13∘. The VCC is asserted to be complete down to a limiting absolute magnitude of and to contain many objects as faint as . The full sample was reduced to a manageable size of 286 galaxies by performing a brightness cut ( mag), a spatial cut (to remove contamination from W, W’, and M background groups) and a velocity cut ( 3000 km s-1). These cuts, which yield a sample covering a wide range of luminosities and morphologies, are discussed in further detail in McDonald et al. (2009b).
2.1 NIR Data
Deep -band imaging for some VCC galaxies is already available from the 2MASS and GOLDMine111http://goldmine.mib.infn.it/ (Gavazzi et al. 2003) databases. -band images from GOLDMine were kindly provided by G. Gavazzi, while calibrated 2MASS galaxy images were extracted from the online database. Many of the 2MASS and GOLDMine images were not deep enough for our purposes. Whilst adequate for large HSB galaxies, the high 2MASS surface brightness threshold (typically mag arcsec-2 – Bell et al. 2003; Courteau et al. 2007; Kirby et al. 2008) undermines the use of that database for deep extragalactic studies. Likewise, only a fraction of the available GOLDMine images were deep enough to properly separate bulge and disk light components, or suffered from ghost images. Whenever possible, we attempted to salvage such images by either masking the ghosts or confining our analysis to a single chip, which were typically unaffected by contamination due to ghosts. We secured -band imaging for the remainder (187 galaxies) of our sample with the detectors ULBCam (UH 2.2-m), WFCAM (UKIRT), and WIRCAM (CFHT) over the period 2005-2009. The existing and new observations are summarized in Table 1 of McDonald et al. (2009b).
The surface brightness profiles for the deep GOLDMine and 2MASS images were measured using the same techniques as our new NIR images to ensure uniformity for the entire database. Further details regarding the data reduction process and quality are given below.
2.2 Optical Data
We have extracted calibrated images from the SDSS for the 286 VCC galaxies in our sample. Surface brightness profiles and total luminosities were extracted for all of these galaxies in all five SDSS bands using procedures described in Courteau (1996) and McDonald et al. (2009b). -band images were consistently shallower than those in the bands and, thus, were discarded. Sky levels for background subtraction and the photometric zero-points for calibration were obtained from the SDSS image headers and the SDSS archives, respectively. However, we will see in §4.1 that we ultimately prefer our own estimates of the sky background for each of the galaxy images. The remainder of the profile extraction technique is identical to that used for the NIR photometry, as we describe below.
3 NIR Observations and Data Reduction
Virgo cluster galaxies which lacked suitable NIR imaging were observed with ULBCam222ULBCam, the Ultra Low Background Camera, is a JWST prototype camera developed at the IfA by Don Hall and his team. It combines 4 20482048 arrays, of which we used only the cleanest one. on the 2.2-m UH telescope (Hall et al. 2004), WIRCAM on the 3.6-m CFHT (Puget et al. 2004) and WFCAM on the 3.8-m UKIRT (Hambly et al. 2008) from April 2005 to May 2008 (see Table 1 of McDonald et al. 2009b).
For all three NIR imagers, we only used one of the available detectors given the relatively small size of our targets. A single ULBCam detector has a field of view (FOV) with a pixel scale of pixel, while WFCAM has a FOV with a pixel scale of pixel, and WIRCAM has a FOV with a pixel scale of pixel. Altogether, 129, 35, and 27 galaxies were observed at H-band with ULBCam, WIRCAM and WFCAM, respectively.
Given the rapid NIR sky fluctuations, we used a maximum single frame exposure time of 40s with ULBCam, 15s with WIRCAM and 10s with WFCAM to maximize sky flux, while keeping within the detector’s linear regime. A dithering script was used to minimize resampling of bad pixels. In order to ensure sampling of each galaxy out to several effective radii, we first pre-classified the galaxies by eye as high, medium, and low surface brightness. For these three classes we aimed for total exposure times of 8, 16, and 24 minutes (on the 2.2-m), respectively. These different exposure times were motivated by our desire for a well-sampled disk in order to obtain a reliable bulge-disk decomposition.
Basic flat-fielding, stacking and bad pixel rejection procedures were applied to the ULBCam data using the XVista astronomical software package333http://astronomy.nmsu.edu/holtz/xvista/index.html. Primary data reductions for the WIRCAM and WFCAM made use of observatory pipelines. The removal of geometric distortion and photometric calibration of the ULBCam data, as well as the procedures for extraction of surface brightness profiles for all NIR and optical data, are described below.
3.1 ULBCam Geometric Distortion
We corrected the significant geometric distortions in ULBCam images by observing the dense star field FS17 and computing the offset between the predicted and observed stellar positions, following Meurer et al. (2002). The following simple correction minimizes the distortion in our images:
Additionally, each ULBCam 2048x2048 detector is comprised of four smaller 512x2048 arrays that required horizontal offsets of -4 pixels (arrays 1 and 3) to account for their physical separation prior to determining the detector-wide astrometric correction. The 2D pattern of this correction model, shown in Fig. 1, is accurate to within 1 pixel (0.25″) across the full FOV.
3.2 NIR Flux Calibration
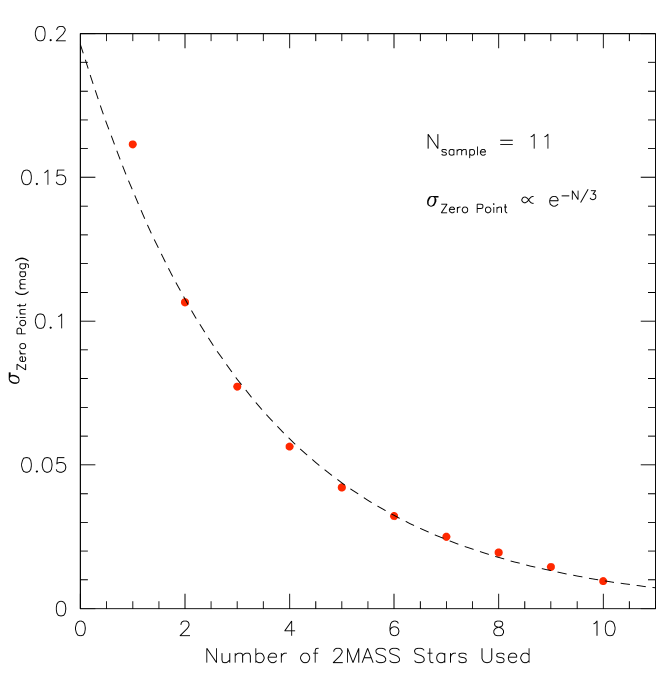
The target flux calibration is based on 2MASS foreground stars. For each galaxy field, all stars above a given flux level (corresponding to the minimum detection level in 2MASS) were marked and their coordinates cross-correlated with the 2MASS stellar library. Typically, three to seven 2MASS stars per ULBCam galaxy field were marked. The ratio of our instrumental magnitudes for those stars to those provided by 2MASS enabled a calibration of all of our photometry at each pixel, independent of any airmass or photometric variations (our NIR images were still all obtained in most favorable conditions). This approach was tested extensively against the traditional method of multiple standard star observations per night and found to be equally reliable provided that at least three 2MASS stars were used per field. Under such conditions, the standard deviation of the derived zero-point corrections from each star is 0.1 mag, as seen in Fig. 2. This error is comparable to those quoted for NIR photometric calibrations using standard star fields (de Jong 1996; Gavazzi et al. 1996; MacArthur et al. 2003).
4 Surface Brightness Profile Extraction
The measurements of galaxy surface brightnesses rely on the careful mapping, in one or two dimensions, of a representative light profile. Our profile extraction uses numerous XVISTA routines and procedures described in Courteau (1996). We review the important steps below. While azimuthally-averaged surface brightness profiles for some of our galaxies are available elsewhere (e.g. 2MASS and GOLDMine), we have recovered original images in all cases and rederived our own surface brightness profiles for all of these galaxies, to ensure a homogeneous database.
4.1 Sky Measurement
A sky level error of only 0.01% at NIR wavelengths can result in either an artificial truncation (over-subtraction) or upturn (under-subtraction) of the galaxy SB profile at large radii. At H-band, this truncation/upturn would occur at 23.5 mag arcsec-2. An accurate assessment of the sky level is thus crucial for the extraction of a reliable, deep, NIR surface brightness profile.
For all images, the sky level is estimated in the final fully-reduced image by isolating five regions (by eye) away from the galaxy, free of any other sources, and calculating the mode of the sky intensities per pixel within each sky region. The average and standard deviation of the five sky values were then computed. Sky levels were estimated this way not only for our data but for 2MASS and GOLDMine images as well. The typical sky fluctuation for our NIR data is 0.005%.
Thanks to its extended sky coverage, SDSS should achieve accurate sky level measurements (http://www.sdss.org/dr5/algorithms/flat_field.html). However, we still use our interactive assessment of the sky background, as described above, for all SDSS data. Fig. 3 shows the difference between our measured sky values and those provided by SDSS. The latter is always biased high, likely due to the inclusion of bright, extended sources. Our interactive technique ensures a (mostly) contaminant-free selection of sky fields. However, due to the fact that we extend the surface brightness profiles to the edge of the field of view, the uncertainty in the profile shape is dominated by systematic (sky measurement) errors at large radii. While seemingly small, sky level errors of a few percent, as seen in Fig. 3, yield significant deviations in a galaxy surface brightness profile (McDonald et al. 2009b). We find that the shape of the surface brightness profile in -band is typically dominated by sky measurement errors by 26 mag arcsec-2. Below this surface brightness level (and corresponding surface brightnesses in ,,) users should consider the data with 1-sigma sky error envelopes.
4.2 PSF Measurement and Star Masking
The seeing point-spread functions (PSF) is often modeled either as a Gaussian or a Moffat (1969) function. The latter has broader wings, which better matches our stellar fields; we have thus used the Moffat function throughout our analysis. On average, 17 stars per field were modeled for PSF measurements. The average FWHM for all ULBCam observations taken over 2005-2008 was ; slightly better imaging was achieved at CFHT and UKIRT. The average FWHM measurement for each image is later used to convolve the analytical models for the galaxy bulge and disk light (see McDonald et al. 2009a).
The identification of foreground stars also enables their removal from the galaxy light. The use of circular masks with radii equal to FWHM ensures that most of this contaminant light is properly removed. Our automated masking routine could not identify bright stars with diffraction spikes or other irregularly shaped features; those obtrusive objects were manually masked.
4.3 Isophotal Fitting
Surface brightness profiles were extracted for all of our galaxy images. The XVISTA command, PROFILE, performs this operation through isophotal fitting, using a generalized non-linear least-squares fitting routine. The ellipticity and position angle, but not the center, of each elliptical isophote are allowed to vary. The center is determined by measuring the centroid of the central light distribution with the XVISTA command AXES. Beyond 1-2 disk scale lengths, the position angle and ellipticity usually settle to constant values. The isophotal solution based on these values is extrapolated to larger radii where the signal-to-noise is too low for PROFILE to converge on a unique solution. Adjustments to the ellipticity profile can be made with the XVISTA command, CPROF, to account for abrupt changes due to any non-axisymmetric features. Ellipse fitting to map the radial surface brightness profile requires the galaxy to be slightly (but not fully!) inclined, so that the azimuthal direction is projected onto the plane of the sky. Edge-on galaxies are thus excluded from this procedure. Fortunately, only 3 galaxies in our sample have inclinations ; non-parametric structural measures (e.g., effective surface brightness) for those galaxies are still valid.
4.4 Profile Depth and Signal-to-Noise Ratios
We calculate the signal-to-noise (hereafter ) ratio of a surface brightness profile as a function of radius as:
| (1) |
where the number of pixels (expressed as an area) along each isophote is given by:
| (2) |
where , are the semi-major and semi-minor axes of a given elliptical isophote, is its total surface brightness level (intensity in counts), and is the surface brightness of the sky.
The measurement of was outlined in §4.1. According to Eq. (1), depths of -mag arcsec-2 with 3 can be achieved with an exposure time of 480s (at the 2.2-m UH telescope). For intermediate and low surface brightness galaxies, our exposure times of 960s and 1440s were determined to yield 3 at surface brightness depths of 24 and 24.5 -mag arcsec-2 , respectively. These levels correspond to 4 disk scale lengths for disk galaxies and 5 effective radii for spheroidal systems.
5 NIR Data Quality
While our collection of Virgo cluster galaxy light profiles results from the merging of independent imaging surveys, we have imposed our own uniform analysis methods to the entire database. Internal errors can be assessed from repeat measurements, and we can compare our extracted light profiles with those from the original authors, whenever available. We can also compare our estimates of empirical quantities such as total luminosity, scale radii and concentration to those provided with surveys such as 2MASS and SDSS in order to test for systematic differences.
5.1 Independent Calibration Errors from Multiple Measurements
We have repeat measurements for three galaxies observed from 2005 to 2007: VCC1614, VCC1516 and VCC1664. We find no variation in the surface brightness profiles over these three epochs, demonstrating the stability of our calibrations over time. Since our calibration of ULBCam data is tied to the 2MASS system, we did not derive extinction coefficients and zero-point corrections for each observing night. However, we can compute relative offsets between the observed and 2MASS magnitudes for several stars in each observed field. The distribution of the photometric offsets shown in Fig. 4 spans 4 years of observations and a full range of airmasses. The measured width of mag for this distribution is expected for night-to-night zero-point variations alone (e.g., Courteau 1996).
5.2 Profile Comparison with Independent Measurements
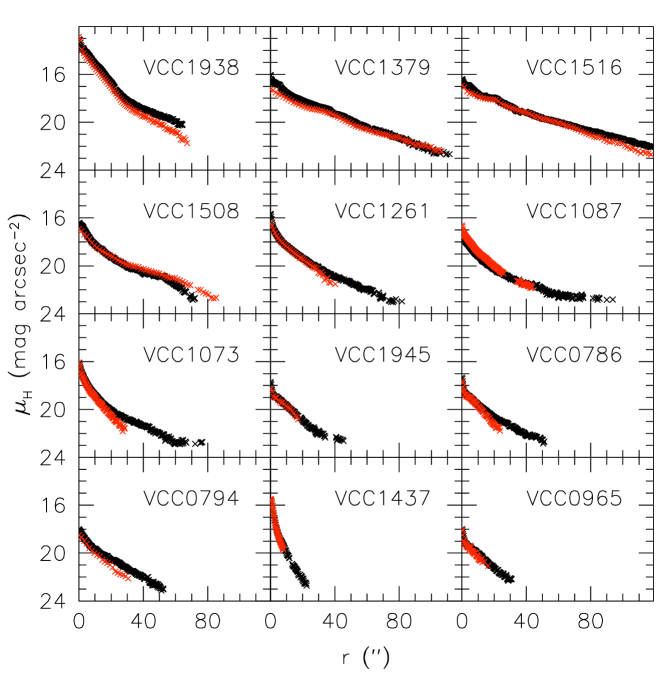
A total of 80 GOLDMine galaxies that satisfy our criterion (McDonald et al. 2009b) were included in our sample. Original images from GOLDMine’s heterogeneous collection of galaxies were kindly provided to us by G. Gavazzi. The average -band surface brightness zero-point offset of 0.15 mag arcsec-2 between our ULBCam and GOLDMine’s original light profiles is small enough to justify merging the two samples into one. However, for complete uniformity, we have recomputed surface brightness profiles for GOLDMine galaxies using our own data reduction techniques outlined earlier. Another motivation for doing so is the desire to have linearly, rather than logarithmically (as in GOLDMine), sampled surface brightness profiles. This exercise also led to more data points in the outer disks, which is relevant for the extrapolation of light profiles to infinity. Fig. 5 shows the overlap of our profiles derived from ULBCam and GOLDMine images for selection of VCC galaxies covering a broad range in luminosity and morphology.
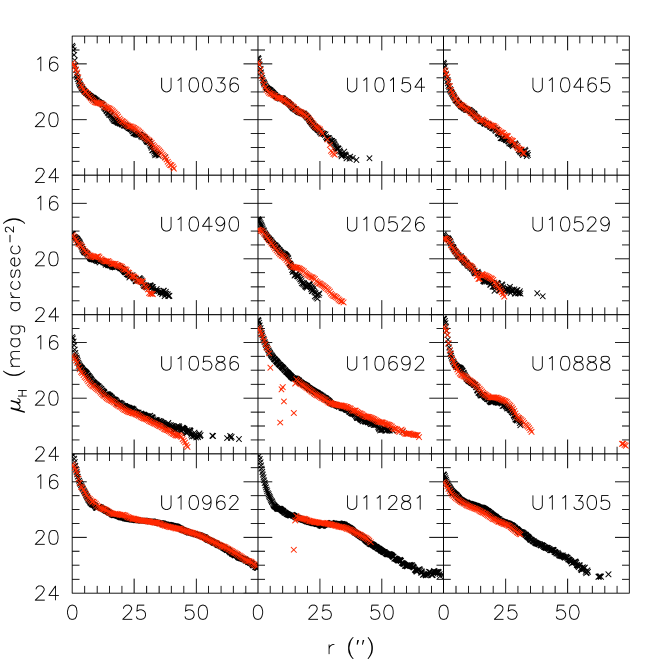
We now compare our calibrated profiles with the fully homogeneous database of deep -band images of late-type northern spirals by MacArthur et al. (2003; hereafter M03). These -band images of spiral galaxies were collected at the KPNO 4-m telescope with the COB detector; typical total integration times were 20 mins per galaxy. We observed 12 non-Virgo UGC galaxies from M03’s sample with ULBCam in April 2007 for comparison. As shown in Fig. 6, the match with M03 is typically very good, with a mean deviation between the two samples of . This comparison with an independent database reinforces the quality of our dataset.
To summarize this section, we have shown that we can merge our GOLDMine and ULBCam -band SB profiles into one sample with a systematic error . Because all profiles are calibrated to 2MASS, the 2MASS profiles with are also naturally integrated into our system. Our entire collection of -band SB profiles is thus self-consistent to within 0.15 out to the last measured data point.
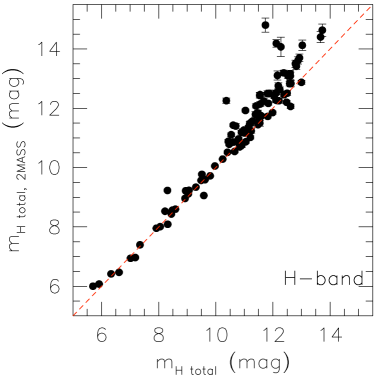
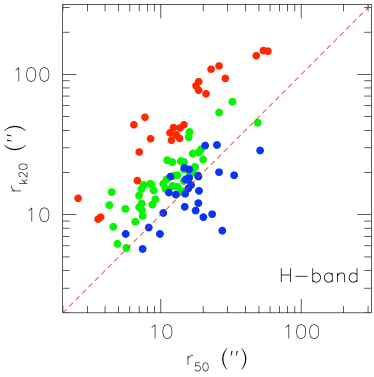
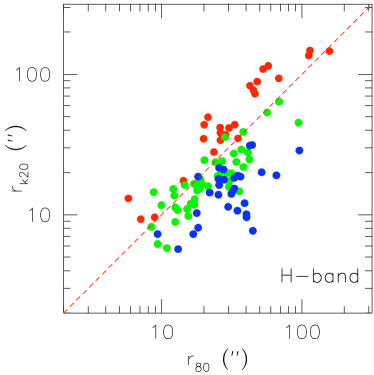
5.3 Comparison of 2MASS and SDSS Data Products
We can also compare our well-tested, non-parametric data products, such as the half-light radius and total magnitude, with those provided by automated 2MASS and SDSS pipelines. The upper panel of Fig. 7 shows our total, extrapolated -band brightnesses versus those provided by 2MASS. The agreement between the two samples for mag is excellent, however the shallower 2MASS catalog is biased for fainter magnitudes. The lower panels of Fig. 7 show our -band radii against the 2MASS -band isophotal radius, , measured at the -band surface brightness level of 20 mag arcsec-2. We compare to two radii, and , which enclose 50% and 80% of the total -band light, respectively. Besides the bandpass differences, the scatter in this distribution is largely due to the bias between an absolute metric, , and a relative metric, or ; the former is fixed for any galaxy profile whereas the latter shifts radially as a function of galaxy profile shape. The two measures thus differ as a function of galaxy mean surface brightness, as shown in Fig. 7; the agreement worsens for mag arcsec-2 . Overall, for mag and mag arcsec-2 , the 2MASS total magnitudes and isophotal radii are reliable to within 0.1 mag and 0.2 dex, respectively.
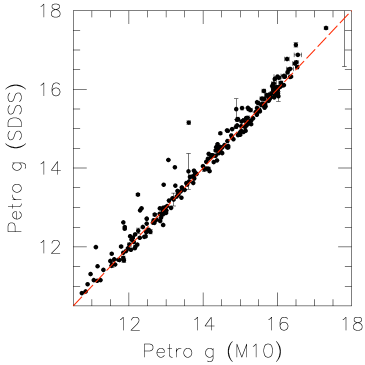
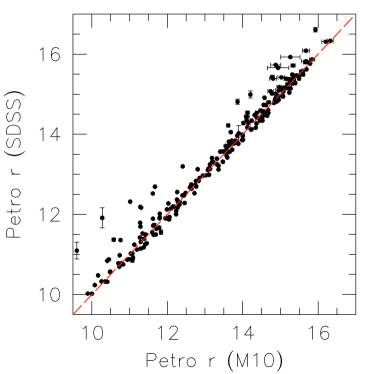
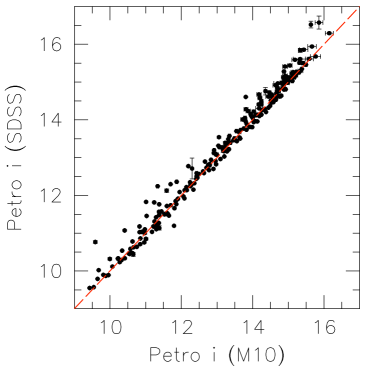
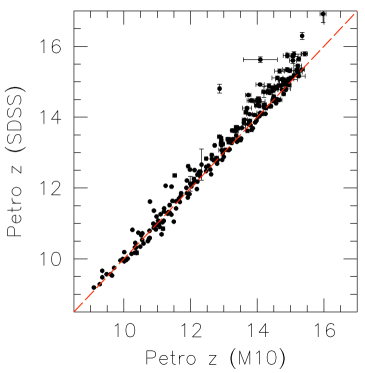
Before performing a similar comparison with the SDSS data, we must first confirm that we have properly extracted and calibrated these data. To that end, we extract Petrosian magnitudes from our calibrated profiles and compare these to the published SDSS Petrosian magnitudes (Adelman-McCarthy et al. 2008). For a fair comparison, we use the distributed Petrosian radii and computed the total brightness within a circular aperture of that radius. The results from this analysis, shown in Fig. 8, confirm that we reproduce the published Petrosian magnitudes to within their error for nearly all galaxies. This confirms our proper calibration of the SDSS surface brightness profiles.
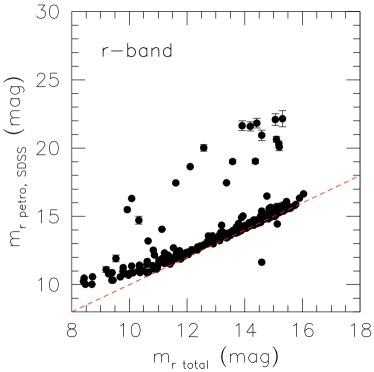
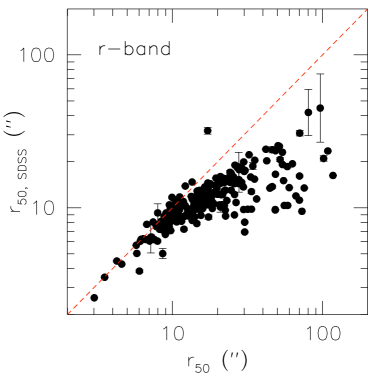
A comparison with various SDSS data products is shown in Fig. 9. The top figure shows the SDSS Petrosian -band magnitude versus our total isophotal -band magnitude from SDSS images. Many galaxies have Petrosian magnitudes more than 2 magnitudes fainter than ours, likely due to a galaxy misidentification by the SDSS pipeline (see Hall et al. 2011, in prep.). The mean 0.2 mag offset from the 1-to-1 line for well-behaved systems is simply the reflection of comparing our total magnitudes extrapolated to r = with Petrosian magnitudes which are measured within a finite aperture. The deviation at the bright end is due to the SDSS pipeline “shredding” of large galaxies (e.g., Panter et al. 2004). The large scatter at all magnitudes is most likely due to the misidentification of clumpy, star-forming galaxies into several individual sources. The bottom left of Fig. 9 shows the SDSS Petrosian half-light radius, , against the half-light radius, , measured with our own software from SDSS images. The deviation from the 1-to-1 line is largely due to comparing radii derived from circular (SDSS) apertures versus elliptical apertures, since, at a given radius, a circular aperture will always enclose more flux than an elliptical aperture of the same maximal size.
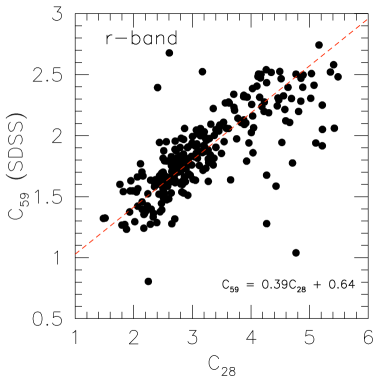
Finally, the lower-right corner of Fig. 9 shows a comparison of our and the SDSS concentration parameter, defined as CXY=5log10(/), where and contain % and % of the total light of the galaxy. The curvature between the radii seen in the lower-left panel of Fig. 9 cancels out to yield a rather linear, albeit noisy, mapping between the two concentrations. The conversion between the two concentration parameters is given by C59 = 0.34C28 + 0.71.
Overall, these comparisons highlight the risks of taking survey data at face value (see also Hall et al. 2010).
6 Surface Brightness Profiles
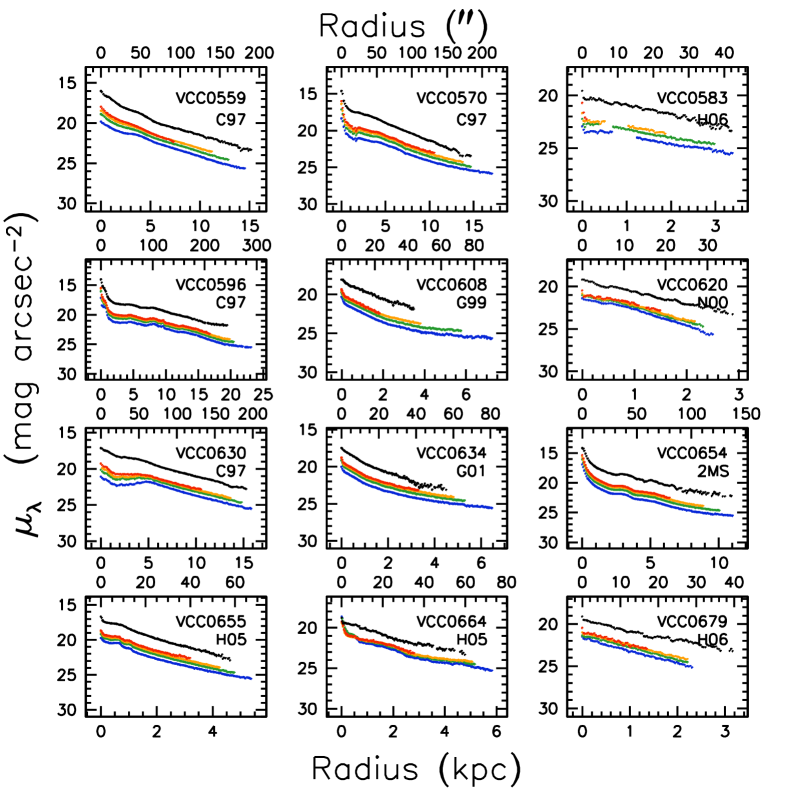
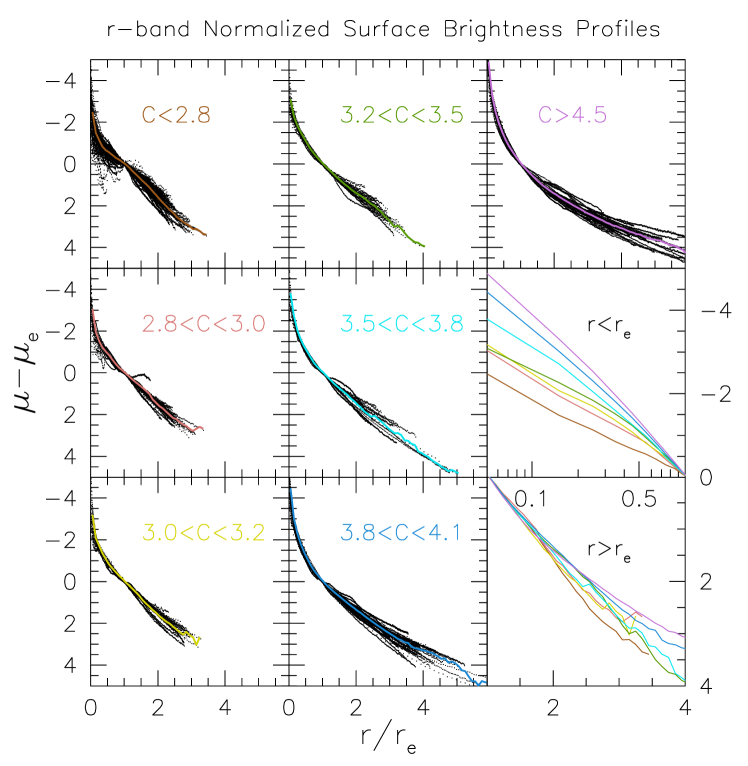
We show in Fig. 10 the and -band surface brightness profiles for 12 of the 286 VCC galaxies in our main sample (see http://www.astro.queensu.ca/virgo/ for the full collection). The full morphological range spanned by our sample from blue to red and dwarf to giant is demonstrated by the wide variety of light profile shapes. To demonstrate this, we have computed the average -band surface brightness profile for galaxies in several morphological bins. Fig. 11 shows the differences and similarities between light profiles at all morphological types, normalized at and . In a plot of versus /, all SB profiles must pass through the point (1,0). In each window we show the normalised surface brightness profiles of a given morphology, with the mean profile per morphological bin shown in color. The middle and lower windows to the right show the average surface brightness profiles in each morphological bin interior and exterior to . For , gas-poor (E, S0, Sa) galaxies exhibit classical cuspy bulges, while gas-rich types (Sb, Sc, Sd, dwarf and irregular galaxies) have cored profiles, commonly associated with pseudo-bulges (MacArthur et al. 2003; Kormendy & Kennicutt 2004). For , the relative shape of the outer profiles can be compared. Both giant and dwarf spheroidal systems (E, dE, S0, dS) have similar shapes, while disk-like systems (Sa-Sd) exhibit a more exponential outer profile.
Similar conclusions are reached if we bin the profiles by concentration rather than morphological type (Fig. 12). The use of a quantitive measure for the concentration yields tighter distributions as opposed to the more subjective morphological classification. There is a natural division for systems with pseudo bulges (C3.8) versus those with a classical bulge (C3.8), as shown by McDonald et al. (2009b).
We find the same results with the H-band data, though the -band data are, typically, deeper than at H-band. The most noticeable difference is with the depth of the dwarf and irregular galaxy profiles. The average dE, dS and Irr profiles are well defined out to much larger radii at -band than at -band. Overall, the trends that are present in the mean -band profiles are reproduced at -band, suggesting that these mean profiles are robust.
Whereas Lauer et al. (2007) hinted at a bimodal separation of the central regions of giant and dwarf ellipticals into cuspy and cored profiles, respectively, Côté et al. (2007) showed that the distribution of central profile shapes is a continuum. Côté et al. suggested that a possible selection bias and choice of radius at which the inner slope is measured could explain the differences, showing that a continuum of inner slopes is seen in the comparison of the inner profile slope with a non-parametric parameter such as total luminosity. Our Fig. 12 attests to the continuous distribution of inner slopes when we bin by galaxy concentration (which correlates with total luminosity). Thus, a dichotomy between cuspy and cored profiles is only seen if profiles are binned by morphology; a continuous distribution prevails with a more physically motivated binning criterion such as concentration.
7 Galaxy Structural Parameters
In order to determine the contribution of the bulge and disk components to the total galaxy light, we have performed 1-D bulge-disk decompositions on the full sample of Virgo cluster galaxies following the techniques described in M09a. Due to the 1-D nature of these decompositions, we are unable to fully account for non-axisymmetric components such as bars and ovals. These components will necessarily be added to either the bulge or the disk light, adding a degree of uncertainty to these fits. Ideally, one should use a 2-D decomposition code such as GIM2D (Simard et al. 2002), BUDDA (de Souza et al. 2004) or GALFIT (Peng et al. 2010) so that non-axisymmetric features can be properly modeled. For further discussion of the relative merits of 1-D and 2-D bulge-disk decompositions, see MacArthur et al. (2003). While 2D decompositions can reduce some of the inherent uncertainty in 1D model parameters, differences between 1D and 2D values are at the 10–20% level. We proceed with our 1D approach here; our 2D decompositions will be presented elsewhere. We describe the salient features of this method below.
Our bulge model uses a generalized Sérsic function (Sérsic 1968) with three free parameters: an effective (or half-light) radius, , the surface brightness at that radius, , and a shape parameter, . For the special case of , the Sérsic function reduces to a simple exponential. The disk light is modeled with an exponential function described by two free parameters: a disk central surface brightness, , and a disk scale length, . The bulge and disk models are convolved with the Moffat (1969) function to simulate the effects of seeing on the intrinsic light profile of a galaxy.
For spiral and irregular galaxies (S0–Sd, Irr) we model the surface brightness profile with a combination of a Sérsic bulge and exponential disk. If the inclusion of the bulge component does not sufficiently improve the fit quality (i.e. Sd or Irr galaxies), the software will discard it and fit an exponential function alone in an attempt to decrease the degrees of freedom and, thusly, minimize the reduced . Since spheroidal galaxies (E, dE, dS) may or may not have a disk, we also attempt to model the profile with a single Sérsic. Once again, if the absence of a disk component increases the goodness-of-fit, the software will automatically discard this component of the model. The fit minimization uses brightnesses in magnitude (not counts), and the lowest global value of the per degree of freedom determines the best fit.
Our model decomposition can also account for the presence of a nucleus, here modeled by a seeing-convolved delta function at (one additional free parameter, ), as well as spiral arms, which are modeled by a smooth increase in brightness above the underlying disk. We find that the addition of a nuclear component reduces the need for high- bulges, yielding an average shape parameter of 1. These additional features increase the degrees of freedom and, thus, are only applied for obvious cases.
Non-parametric structural measurements, such as the total magnitude (extrapolated from the last data point to infinity), the effective radius and surface brightness, and galaxy light concentration, were computed for all 286 galaxies in each of the 5 bands. These measurements are nearly independent of the bulge-disk model decompositions, relying only on the fit in order to determine the amount of galaxy light beyond the last data point (typically 0.2 mag). The fact that these parameters are independent of any model (i.e. no assumption that a galaxy profile can be separated into components) makes them most useful for galaxy structure studies. The effective radius, , is defined as the radius which encloses half the total light, while the effective surface brightness is the surface brightness at this radius, . We compute the concentration parameter, C28, as in §5.3.
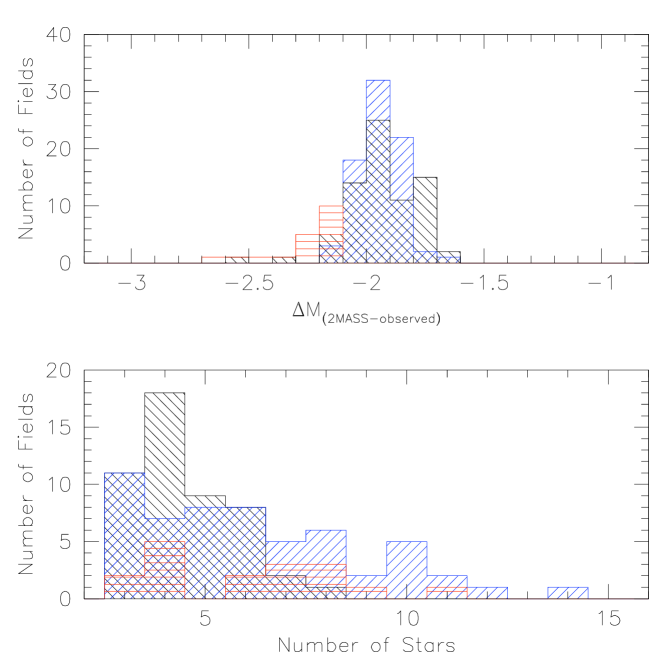
The parametric and non-parametric structural measurements for our 286 VCC galaxies in the and bands are provided online at the CDS (http://cds.u-strasbg.fr/) and our private website (http://www.astro.queensu.ca/virgo/). For spiral galaxies with well-defined bulges and disks (i.e., Sa-Sb), we find typical -band errors on our fitting parameters of: mag arcsec-2 , mag arcsec-2 , %, %, and . These uncertainties are similar to those reported by MacArthur et al. (2003), who relied on similar techniques. For irregular or poorly-sampled systems, these uncertainties can increase by as much as an order of magnitude. The distribution of the H-band parametric quantities is shown in Fig. 13 for different morphological bins. This figure clearly shows the disk surface brightness bimodality discovered by TV97 and confirmed by McDonald et al. (2009a,b). These distributions are meant to be compared to galaxy formation models.
8 Tables of Median Structural Parameters
We provide in Table 1 the median and standard deviation of the four non-parametric parameters (total magnitude, effective surface brightness, effective radius, and concentration) as a function of morphology and bandpass. This table shows the variation of galaxy structural parameters with wavelength and morphology, as well as the spread of each parameter within a given morphological/wavelength bin. For instance, there is a substantial range in elliptical galaxy brightnesses, as expected from the bimodal distribution of elliptical surface brightnesses (McDonald et al. 2009b), and a clear division of galaxies into cuspy (C) and disk-like (C) galaxies, also as reported by McDonald et al. (2009b). Additionally, Table 1 shows that disk galaxies have, on average, effective radii that are twice as large as spheroidal galaxies, regardless of surface brightness or color.
Table 2 gives the median and standard deviation of five parametric quantities from 1D bulge-disk decompositions. This includes three bulge parameters: , , and the two disk parameters: and . This table shows the variation of bulge and disk structural parameters as a function of color and morphology. We find that the “typical” bulge shape is indeed exponential (e.g., Courteau et al. 1996; MacArthur et al. 2003) and that the light profile of a typical elliptical galaxy is well fit by a single Sérsic index of . No Virgo galaxy spheroid requires . Futhermore, the decomposition of elliptical galaxy light profiles requires the addition of a disk component for 70% of our sample. These disks tend to have low surface brightness, with average brightnesses similar to Sc-Sd galaxies, but typically have scale lengths twice as large. Finally, we find that the typical spiral galaxy disk has a half-light radius larger than that of the bulge.
Tables 1 and 2 offer a wealth of information about the structural parameters of galaxies across the Hubble sequence and over a range of wavelengths. An extensive discussion of these trends is found in McDonald et al. (2009b). These tables ought to provide a valuable compendium of galaxy structural properties for theoretical investigations of galaxies as well as a much needed foil for comparisons with high redshift galaxy samples.
9 Summary
We have presented the results of a NIR survey, supplemented with optical imaging from the SDSS, of 286 morphologically-diverse Virgo cluster galaxies. Our NIR images come from various sources including archival -band data from the 2MASS and GOLDMine archives and new -band data for 171 galaxies from the UH 2.2-m, CFHT and UKIRT telescopes. These NIR data have been carefully calibrated, yielding a photometric accuracy of 0.1 mag arcsec-2 over the entire sample. Both the new and archival data were analyzed in a homogeneous manner using our own software for uniformity. For each galaxy in our sample we have extracted ,,,, surface brightness profiles yielding a deep, multiwavelength collection of surface photometry. Full bulge-disk decompositions were performed in each of the five wavebands for all 286 VCC galaxies. We also provide the average structural parameters for galaxies in various morphological bins, offering a most valuable benchmark for comparison against theoretical investigations of galaxies as well as high redshift galaxy samples. This database has recently been utilized in studies of galaxy structural parameters by McDonald et al. (2009b) and stellar populations by Roediger et al. (2010) and Prochaska et al. (2011). The galaxy light profiles and results of bulge-disk decompositions are available online at the CDS (http://cds.u-strasbg.fr/) and our own website (http://www.astro.queensu.ca/virgo/).
Acknowledgements
S.C. acknowledges support through a Discovery Grant of the Natural Science and Engineering Research Council of Canada. R. B. T. acknowledges support from US National Science Foundation award AST 09-08846. Guiseppe Gavazzi is thanked for sharing Goldmine data products with us. We are also indebted to Enrico Maria Corsini for catching a subtle error in our computation of sky errors and enabling its correction before going to print. Lastly, we are grateful to Jon Holtzman and Melanie Hall for their contributions to the data selection, acquisition and reduction phases of this survey.
References
- Adelman-McCarthy et al. (2008) Adelman-McCarthy, J. K., et al. 2008, ApJS, 175, 297
- Baldry et al. (2004) Baldry, I. K., Glazebrook, K., Brinkmann, J., Ivezić, Ž., Lupton, R. H., Nichol, R. C., & Szalay, A. S. 2004, ApJ, 600, 681
- Balogh et al. (2004) Balogh, M. L., Baldry, I. K., Nichol, R., Miller, C., Bower, R., & Glazebrook, K. 2004, ApJ, 615, L101
- Bell & de Blok (2000) Bell, E. F., & de Blok, W. J. G. 2000, MNRAS, 311, 668
- Bell et al. (2003) Bell, E. F., McIntosh, D. H., Katz, N., & Weinberg, M. D. 2003, ApJS, 149, 289
- Binggeli et al. (1985) Binggeli, B., Sandage, A., & Tammann, G. A. 1985, AJ, 90, 1681 [VCC]
- Blanton et al. (2003) Blanton, M. R., et al. 2003, ApJ, 594, 186
- Brinchmann et al. (2004) Brinchmann, J., Charlot, S., White, S. D. M., Tremonti, C., Kauffmann, G., Heckman, T., & Brinkmann, J. 2004, MNRAS, 351, 1151
- Côté et al. (2007) Côté, P., et al. 2007, ApJ, 671, 1456
- Courteau (1996) Courteau, S. 1996, ApJS, 103, 363
- Courteau et al. (1996) Courteau, S., de Jong, R. S., & Broeils, A. H. 1996, ApJ, 457, L73
- Courteau et al. (2007) Courteau, S., Dutton, A. A., van den Bosch, F. C., MacArthur, L. A., Dekel, A., McIntosh, D. H., & Dale, D. A. 2007, ApJ, 671, 203
- de Jong (1996) de Jong, R. S. 1996, A&A, 313, 45
- de Souza et al. (2004) de Souza, R. E., Gadotti, D. A., & dos Anjos, S. 2004, ApJS, 153, 411
- Gavazzi et al. (1996) Gavazzi, G., Pierini, D., Baffa, C., Lisi, F., Hunt, L. K., Randone, I., & Boselli, A. 1996, A&AS, 120, 521
- Gavazzi et al. (2003) Gavazzi, G., Boselli, A., Donati, A., Franzetti, P., & Scodeggio, M. 2003, A&A, 400, 451
- Gebhardt et al. (1996) Gebhardt, K., et al. 1996, AJ, 112, 105
- Hall et al. (2004) Hall, D. N. B., Luppino, G., Hodapp, K. W., Garnett, J. D., Loose, M., & Zandian, M. 2004, Proc. SPIE, 5499, 1
- Hambly et al. (2008) Hambly, N. C., et al. 2008, MNRAS, 384, 637
- Kauffmann et al. (2003) Kauffmann, G., et al. 2003, MNRAS, 341, 33
- Kirby et al. (2008) Kirby, E. M., Jerjen, H., Ryder, S. D., & Driver, S. P. 2008, AJ, 136, 1866
- Kormendy & Kennicutt (2004) Kormendy, J., & Kennicutt, R. C., Jr. 2004, ARA&A, 42, 603
- Lauer et al. (2007) Lauer, T. R., et al. 2007, ApJ, 664, 226
- Lawrence et al. (2007) Lawrence, A., et al. 2007, MNRAS, 379, 1599
- MacArthur et al. (2003) MacArthur, L. A., Courteau, S., & Holtzman, J. A. 2003, ApJ, 582, 689
- McDonald et al. (2009) McDonald, M., Courteau, S., & Tully, R. B. 2009a, MNRAS, 393, 628
- McDonald et al. (2009) McDonald, M., Courteau, S., & Tully, R. B. 2009b, MNRAS, 394, 2022
- Mei et al. (2007) Mei, S., et al. 2007, ApJ, 655, 144
- Meurer et al. (2002) Meurer, G. R., et al. 2002, The 2002 HST Calibration Workshop : Hubble after the Installation of the ACS and the NICMOS Cooling System, 65
- Moffat (1969) Moffat, A. F. J. 1969, A&A, 3, 455
- Panter et al. (2004) Panter, B., Heavens, A. F., & Jimenez, R. 2004, MNRAS, 355, 764
- Peng et al. (2010) Peng, C. Y., Ho, L. C., Impey, C. D., & Rix, H.-W. 2010, AJ, 139, 2097
- Prochaska Chamberlain et al. (2011) Prochaska Chamberlain, L. C., Courteau, S., McDonald, M., & Rose, J. A. 2011, MNRAS, 412, 423
- Puget et al. (2004) Puget, P., et al. 2004, Proc. SPIE, 5492, 978
- Roediger et al. (2010) Roediger, J. C., Courteau, S., MacArthur, L. A., & McDonald, M. 2010, arXiv:1011.3511
- Sersic (1968) Sersic, J. L. 1968, Cordoba, Argentina: Observatorio Astronomico, 1968
- Simard et al. (2002) Simard, L., et al. 2002, ApJS, 142, 1
- Skrutskie et al. (2006) Skrutskie, M. F., et al. 2006, AJ, 131, 1163
- Strateva et al. (2001) Strateva, I., et al. 2001, AJ, 122, 1861
- Tully & Verheijen (1997) Tully, R. B., & Verheijen, M. A. W. 1997, ApJ, 484, 145


 |
 |
 |
 |
 |
 |
 |
 |
 |
 |


| Parameter | Morphology | |||||
|---|---|---|---|---|---|---|
| mT | E | 13.5(1.8) | 12.9(1.8) | 12.4(1.8) | 12.7(1.9) | 10.6(2.2) |
| mag | S0 | 12.5(1.3) | 11.6(1.4) | 11.2(1.4) | 11.0(1.5) | 9.3(1.6) |
| (1) | Sa-Sb | 12.1(1.2) | 11.5(1.3) | 11.1(1.3) | 10.9(1.3) | 9.0(1.5) |
| Sc-Sd | 13.3(1.3) | 12.7(1.5) | 12.6(1.4) | 12.4(1.5) | 9.9(1.8) | |
| dE | 15.3(0.9) | 14.7(0.8) | 14.4(0.9) | 14.2(1.3) | 12.5(0.9) | |
| dS | 14.7(0.5) | 14.1(0.6) | 13.8(0.6) | 13.6(0.7) | 11.7(0.9) | |
| Irr | 14.9(1.3) | 14.3(1.4) | 14.0(1.5) | 13.7(1.5) | 12.3(1.6) | |
| E | 22.0(1.4) | 21.2(1.5) | 20.9(1.5) | 20.5(1.4) | 18.3(1.5) | |
| mag arcsec | S0 | 22.3(0.9) | 21.5(1.0) | 21.1(1.0) | 20.8(1.0) | 18.9(1.1) |
| (2) | Sa-Sb | 22.8(0.7) | 22.2(0.7) | 21.8(0.7) | 21.5(0.7) | 19.5(0.7) |
| Sc-Sd | 23.5(0.7) | 23.0(0.7) | 22.7(0.7) | 22.3(0.7) | 20.6(1.0) | |
| dE | 24.1(0.7) | 23.4(0.7) | 23.1(0.8) | 22.6(0.7) | 21.1(0.9) | |
| dS | 23.8(0.9) | 23.2(0.8) | 22.9(0.8) | 22.5(0.8) | 20.6(0.8) | |
| Irr | 23.7(1.0) | 23.3(1.1) | 23.1(1.1) | 22.6(1.1) | 21.3(1.3) | |
| E | 1.1(0.8) | 1.1(0.8) | 1.1(0.9) | 1.0(0.7) | 0.9(1.1) | |
| kpc | S0 | 1.7(0.9) | 1.8(0.9) | 1.7(0.9) | 1.6(0.8) | 1.4(1.0) |
| (3) | Sa-Sb | 2.6(1.6) | 2.5(1.5) | 2.9(1.4) | 2.5(1.4) | 2.5(2.0) |
| Sc-Sd | 2.4(1.8) | 2.4(1.7) | 2.4(1.5) | 2.3(1.4) | 2.2(2.4) | |
| dE | 1.3(0.5) | 1.3(0.5) | 1.2(0.5) | 1.0(0.8) | 1.2(0.5) | |
| dS | 1.2(0.6) | 1.2(0.5) | 1.2(0.5) | 1.2(0.5) | 1.1(0.5) | |
| Irr | 1.4(0.7) | 1.4(0.7) | 1.5(0.8) | 1.3(0.7) | 1.3(0.8) | |
| C28 | E | 3.8(0.7) | 3.9(0.7) | 4.0(0.7) | 3.8(1.0) | 3.8(0.7) |
| (4) | S0 | 4.0(0.8) | 4.1(0.8) | 4.1(0.8) | 4.2(0.8) | 4.0(0.9) |
| Sa-Sb | 3.1(0.7) | 3.2(0.7) | 3.2(0.7) | 3.3(0.7) | 3.4(0.7) | |
| Sc-Sd | 2.6(0.4) | 2.5(0.5) | 2.8(0.5) | 2.7(0.6) | 2.8(0.4) | |
| dE | 2.9(0.6) | 3.0(0.6) | 2.9(0.6) | 2.7(0.5) | 2.9(0.5) | |
| dS | 3.3(0.4) | 3.3(0.4) | 3.2(0.4) | 2.9(0.4) | 3.3(0.6) | |
| Irr | 2.7(0.8) | 2.7(0.8) | 2.6(0.7) | 2.5(0.7) | 2.6(0.7) |
(1) Total apparent magnitude extrapolated to r= (mag) (2) Effective surface brightness (mag arcsec-2) (3) Effective radius (kpc) (4) Concentration: C28=5log10(/)
| Parameter | Morphology | |||||
|---|---|---|---|---|---|---|
| E1 | 2.4(1.1) | 2.6(1.0) | 2.3(1.0) | 2.2(1.4) | 2.1(0.9) | |
| (1) | E2 | 1.4(0.6) | 1.5(0.5) | 1.5(0.6) | 1.3(0.7) | 1.5(0.7) |
| S0 | 1.4(0.6) | 1.4(0.5) | 1.4(0.6) | 1.3(0.6) | 1.2(0.7) | |
| Sa-Sb | 1.2(0.7) | 1.2(0.6) | 1.4(0.6) | 1.2(0.7) | 1.0(0.6) | |
| Sc-Sd | 0.5(0.3) | 0.7(0.5) | 0.6(0.4) | 0.6(0.4) | 0.8(0.5) | |
| dE/dS | 0.9(0.3) | 0.9(0.4) | 0.9(0.4) | 0.8(0.4) | 0.8(0.5) | |
| Irr | 0.6(0.6) | 0.8(0.6) | 0.7(0.5) | 0.5(0.5) | 0.7(0.6) | |
| E1 | 22.7(1.4) | 21.7(1.4) | 21.4(1.4) | 21.3(1.5) | 18.7(0.9) | |
| mag arcsec | E2 | 21.0(1.4) | 20.5(1.4) | 20.2(1.4) | 19.8(1.6) | 17.5(1.3) |
| (2) | S0 | 20.6(1.3) | 20.0(1.3) | 19.4(1.4) | 19.2(1.5) | 17.2(1.3) |
| Sa-Sb | 21.2(1.2) | 20.5(1.2) | 20.3(1.4) | 19.9(1.4) | 17.6(1.5) | |
| Sc-Sd | 22.6(1.5) | 21.9(0.9) | 21.6(1.0) | 21.4(1.2) | 19.7(1.4) | |
| dE/dS | 23.0(0.9) | 22.6(0.9) | 22.2(1.0) | 21.9(0.9) | 20.0(1.1) | |
| Irr | 22.6(1.4) | 22.1(1.5) | 21.8(1.6) | 21.0(1.7) | 20.2(1.8) | |
| E1 | 1.7(2.3) | 1.6(2.0) | 1.5(2.0) | 1.5(3.2) | 1.3(2.0) | |
| kpc | E2 | 0.6(0.4) | 0.6(0.3) | 0.6(0.3) | 0.6(0.3) | 0.7(0.9) |
| (3) | S0 | 0.8(0.6) | 0.8(0.6) | 0.6(0.7) | 0.6(0.6) | 0.6(0.9) |
| Sa-Sb | 0.5(1.4) | 0.6(0.6) | 0.6(0.8) | 0.6(0.7) | 0.5(0.6) | |
| Sc-Sd | 0.5(0.4) | 0.4(0.4) | 0.6(0.6) | 0.6(0.5) | 0.7(1.1) | |
| dE/dS | 0.6(0.4) | 0.6(0.3) | 0.6(0.3) | 0.5(0.3) | 0.5(0.4) | |
| Irr | 0.6(0.4) | 0.8(0.5) | 0.8(0.4) | 0.4(0.3) | 0.8(0.5) | |
| E2 | 23.8(1.6) | 23.3(1.6) | 22.7(1.6) | 22.3(1.6) | 20.9(1.8) | |
| mag arcsec | S0 | 22.9(1.5) | 22.3(1.3) | 21.9(1.2) | 21.3(1.4) | 19.6(1.5) |
| (4) | Sa-Sb | 22.6(1.3) | 22.0(0.9) | 21.6(1.1) | 21.3(1.1) | 18.9(1.1) |
| Sc-Sd | 22.9(0.8) | 22.4(0.9) | 22.1(1.1) | 21.9(0.8) | 20.5(1.4) | |
| dE/dS | 24.3(1.0) | 23.7(0.9) | 23.4(0.9) | 22.9(0.9) | 21.4(1.0) | |
| Irr | 23.8(1.2) | 23.4(1.1) | 23.2(1.1) | 22.6(0.9) | 21.4(1.3) | |
| E2 | 2.4(2.3) | 2.4(2.6) | 2.4(2.4) | 2.1(2.5) | 2.5(9.1) | |
| kpc | S0 | 3.3(4.0) | 3.4(3.5) | 3.0(5.0) | 2.5(5.1) | 2.9(7.5) |
| (5) | Sa-Sb | 3.7(3.6) | 3.4(2.2) | 3.9(2.0) | 3.3(2.7) | 3.3(2.6) |
| Sc-Sd | 2.6(2.7) | 2.7(2.5) | 2.8(2.5) | 2.9(2.1) | 3.0(10.7) | |
| dE/dS | 1.9(1.8) | 1.9(1.8) | 1.9(1.4) | 1.8(2.3) | 1.8(1.8) | |
| Irr | 2.2(1.8) | 2.1(2.3) | 2.4(1.6) | 2.0(1.2) | 2.2(3.0) |
(1) Sérsic n parameter (2) Bulge effective surface brightness in units of mag arcsec-2 (3) Bulge effective radius in units of kpc (4) Disk effective surface brightness in units of mag arcsec-2 (5) Disk effective radius in units of kpc (E1) Elliptical galaxy light profile fit with single Sersic function (E2) Elliptical galaxy light profile fit with Sersic + exponential functions