Ubiquitous quiet-Sun jets
Abstract
Context. IMaX/Sunrise has recently reported the temporal evolution of highly dynamic and strongly Doppler shifted Stokes signals in the quiet Sun.
Aims. We attempt to identify the same quiet-Sun jets in the Hinode spectropolarimeter (SP) data set.
Methods. We generate combinations of linear polarization magnetograms with blue- and redshifted far-wing circular polarization magnetograms to allow an easy identification of the quiet-Sun jets.
Results. The jets are identified in the Hinode data where both red- and blueshifted cases are often found in pairs. They appear next to regions of transverse fields that exhibit quiet-Sun neutral lines. They also have a clear tendency to occur in the outer boundary of the granules. These regions always display highly displaced and anomalous Stokes profiles.
Conclusions. The quiet Sun is pervaded with jets formed when new field regions emerge at granular scales loaded with horizontal field lines that interact with their surroundings. This interaction is suggestive of some form of reconnection of the involved field lines that generates the observed high speed flows.
Key Words.:
Sun: surface magnetism – Sun: photosphere – Sun: granulation1 Introduction
The magnetism of the quiet Sun has recently come under deep scrutiny. Thanks to the advent of two major observatory missions, the Hinode satellite (see Kosugi et al. Kosugi07 (2007), Tsuneta et al. Tsuneta08 (2008), Suematsu et al. Suematsu08 (2008), Shimizu et al. 2008a , Ichimoto et al. Ichimoto08 (2008)) and the Sunrise balloon (see Barthol et al. Barthol11 (2011) and Solanki et al. Solanki10 (2010)), a wealth of information about the physical processes behind the magnetism of the quiet Sun has been gathered. In particular, the existence of emerging flux in the form of granular scale loops is now solidly established. From Lites et al. (2008; see also Orozco et al. 2007), who published the most detailed map of linear polarization signals marking the presence of transverse fields, to Martínez González & Bellot Rubio (2008) who analysed a large number of internetwork loop appearances, we have formed a somewhat detailed picture of how new flux arrives at the solar surface on scales as small as one arcsecond. (For a larger statistical sample of flux emergence cases with detected horizontal fields, we refer to Ishikawa & Tsuneta Ishikawa09 (2009) and Jin et al. Jin09 (2009).) Emerging flux is observed first in the form of upflowing horizontal internetwork features (HIFs as first coined by Lites et al. (1996)), which, at a later stage, displays footpoints of opposite polarities at both ends. Ishikawa et al. (2010) describes with Hinode the rise of a single, more or less coherent, flux concentration through the line-forming region of the spectropolarimeter (SP) instrument. The Sunrise mission has described in detail similar processes (that even resolve substructures within the emerging region, see Danilovic et al. 2010a ) and produced a statistically sound set of properties and evolutionary timescales of the HIFs (Danilovic et al. 2010b ).
The complexity of these flux emergence processes must be somehow reflected in the observed Stokes profiles of the quiet Sun. In particular, the circularly polarized Stokes profiles are known to display very asymmetric shapes from the Advanced Stokes Polarimeter (ASP) era (Sigwarth Sigwarth01 (2001)) to the more recent Hinode/SP observations (Viticchié et al. (2011)). The origin of these anomalously behaved profiles is unclear and the physical processes involved are largely unknown. Single lobed and/or multilobed shapes often show large displacements from the central (rest) wavelengths, which are indicative of large line-of-sight (LOS) flow velocities. Shimizu et al. (2008b) found strong (supersonic) downflows, in, both, the vicinity of sunspots and in the quiet Sun. These downflows were interpreted as representing the formation of a strong field concentration through the process of convective collapse (see also Nagata et al. Nagata08 (2008) and Fischer et al. Fischer09 (2009)). One of the few other cases where the origin of these profiles has been associated with a physical scenario was presented by Socas-Navarro & Manso Sainz (Navarro05 (2005)). These authors found quiet-Sun Stokes profiles with a third lobe, this time blueshifted by 7.5 km s-1 from the rest position. They tentatively ascribed this lobe to an upward rebound of the material participating in the convective collapse process. Independently of the validity of these explanations, the identification of the physical scenario in which these profiles are generated is clearly crucial to developing diagnostic tools that retrieve information from them. This is the main objective of this work.
The IMaX instrument (Martínez Pillet et al. Martinezpillet10 (2010)) aboard Sunrise has provided the temporal evolution of circular polarization signatures observed in the continuum reference point (Borrero et al. Borrero10 (2010); BMS hereafter). These signals were identified to occur close to upflowing material in the form of granules that carry with them considerable amounts of fairly inclined fields. Most of these events occur near a magnetic neutral-line configuration, suggesting that there is a link to reconnection processes taking place in regions of flux emergence. High speed flows are needed to explain the generation of significant signals at the observed continuum wavelength. This phenomenon seems to be fundamental enough to occur more than 400 times across a field of view (FOV) of 100 arcseconds squared in one hour (BMS, 1.310-5 events/s arscec2). Understanding the nature of these processes, the magnetic topology in which they are originated, and quantifying the energetics involved would help us to identify these processes in data sets with wider spectral coverage such as those obtained by Hinode/SP, which offers full Stokes profiles of two magnetically sensitive Fe i lines. This paper provides the conceptual bridge between the IMaX/Sunrise observations of quiet-Sun jets and the Hinode/SP data.
2 Hinode/SP data and comparison with IMaX/SUNRISE observations
Before describing the data used in this work, we discuss the observations of the IMaX instrument used by BMS. They correspond to data sets that use all four Stokes parameters at four wavelength points within the spectral line of IMaX (the Fe i 5250.2 Å line) and one in the continuum. The spectral line samples were nominally taken at -80, -40, 40, and 80 mÅ from the central wavelength. In addition, we routinely observe a fifth point in the continuum at 227 mÅ redwards of the spectral line. This wavelength point is half-way between the nominal IMaX line and the Fei 5250.6 Å line. The exact observing mode used by IMaX is described in detail by Martínez Pillet et al. (2010), where it is referred to as the V5-6 observing mode (vector mode with five wavelength samples and six accumulations achieving a signal-to-noise ratio, hereafter , of 1000 per wavelength). The spatial resolution of these first-flight IMaX magnetograms was slightly better than 0.2 arcsec.
Averaging the samples within the line, one produces mean linear polarization () and mean circular polarization (i.e., normal) magnetograms ()
| (1) |
where is the vector and the mean observed continuum intensity. Since four wavelength points are included in these magnetograms, their is typically around 2000. The circular polarization observed at the continuum sample will hereafter be referred to as (and given in units of ). BMS found that 70 % of the signals observed by IMaX occur near strong blue shifts as measured by a Gaussian fit to the Stokes samples. This indicates that a large fraction of these signatures are probably generated by a blueshifted circular polarization signal from the Fe i 5250.6 Å. However downflows that generate a redshift of the nominal IMaX line cannot be excluded. The estimated LOS flow speeds involved were larger than 3 km s-1. These strong flows (most likely supersonic) were found to occur immediately next to HIF patches observed in the magnetograms (see the on-line material of BMS). While all circular polarization continuum signals (tracing the high speed flows) were associated with HIF patches, the reverse was not true. Many HIF regions that had just appeared displayed no clear signatures at the IMaX continuum point. The association identified by BMS appears to represent flux emergence on granular scales that interacts with pre-existing flux and that, in some cases, reconnects with it giving rise to the observed jets. However, with as little as four points within the line and one in the continuum on only one side of the spectral line, it is hard to investigate these quiet-Sun jets. Identifying this process in the Hinode/SP database will help us enormously in understanding its underlying physical mechanism.
To proceed with this identification in the Hinode/SP data set, we use the same observations described in Lites et al. (2008). These data have a similar to that of the IMaX individual wavelength points (1000). The spatial resolution is around 0.3 arcsec. Each slit position has an exposure time of 4.8 seconds. To produce observables comparable to those obtained by IMaX, the Hinode/SP data was first convolved with a 95 mÅ wide Gaussian profile simulating the spectral resolving power of the Sunrise magnetograph. This number corresponds to the intrinsic resolution of the IMaX instrument (85 mÅ) scaled by the factor after subtracting (quadratically) the spectral resolution of Hinode/SP (see Tsuneta et al. Tsuneta08 (2008)). The resulting profiles were then sampled at wavelengths similar to those used by IMaX scaled, again, by the same wavelengths ratio (in particular, the continuum points are now located at 272 mÅ from line centre). The line selected for this study is the Fe i 6302.5 Å line as it has a very similar Zeeman sensitivity as the nominal IMaX line. This time, we also include a continuum sample on the red side of the line to help us identify up- and downflow events. These continuum magnetograms ( and superscripts correspond to the red and blue samples, respectively) are reminiscent of those used by Ichimoto et al. (2009) in their study of the penumbral flows. The and magnetograms can now be combined in a way similar to that demonstrated by BMS to identify locations where the HIF concentrations are associated with nearby high-speed flows.
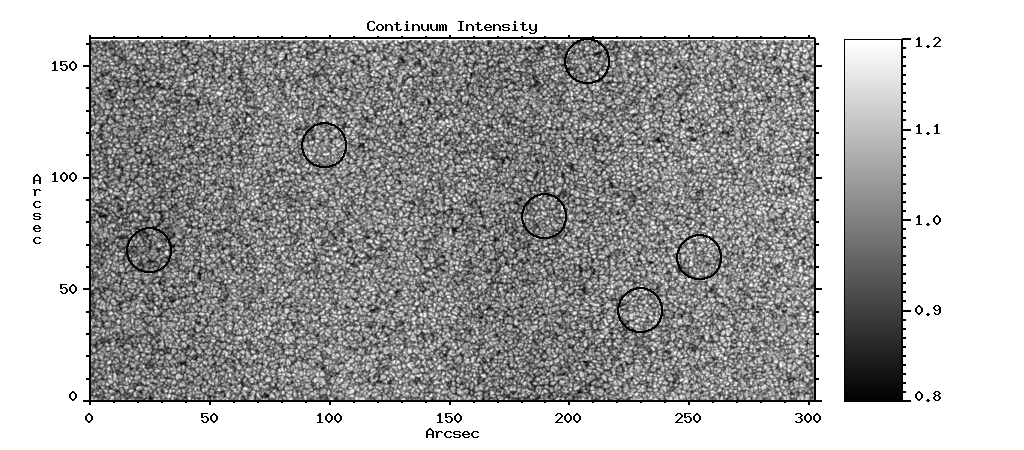
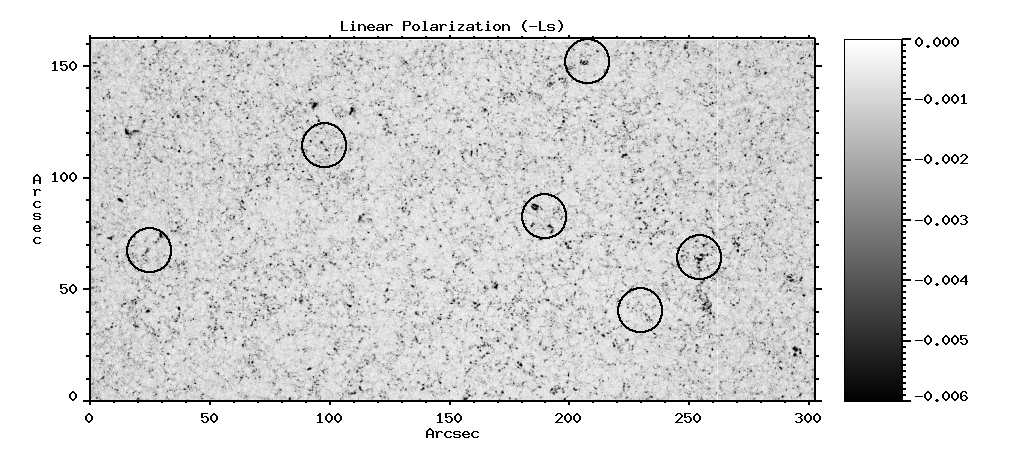
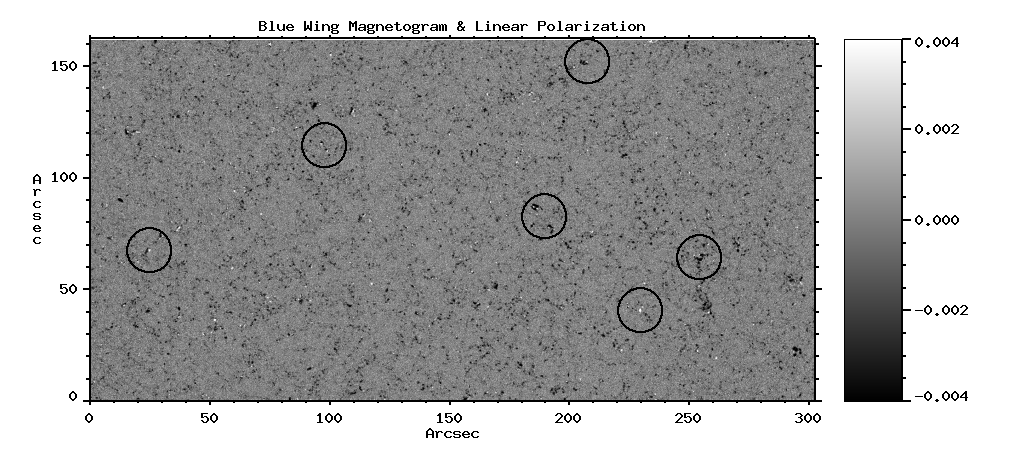
Figure 1 shows the continuum (top) and magnetogram (bottom) from the Hinode/SP set that are similar to those published by Lites et al. (2008; cf. their Figs. 1 & 2). They are given here for easy cross reference with that work. The black circles indicate the regions explored in detail in the next section. The top panel of Fig. 2 displays the combined magnetogram. Strong unsigned-blue-wing continuum signals are shown in white, while strong linear polarization signals are displayed in black. The number of identified coincidences of HIF features with nearby blueshifted signatures is enormous: 209 by simple visual inspection (thresholds for this identification were 0.32 % in and 0.28 % in ). This large number of identifications indicates that the phenomenon described by BMS is also present in the Hinode/SP data. In 24 cases (10 % of the total), we found a clear blueshifted pattern without any evident linear polarization signals in the surroundings. Given the almost ubiquitousness of the association between these two observables, we hypothesize that the linear polarization signals existed at a time other than the exact time when the slit sampled that region (or that the signals remain below the noise level). This hypothesis is reinforced from the visualization of the on-line material of BMS, which illustrates how time-dependent these events are.
The rather different nature of these instruments makes it difficult to compare their occurrence rates. However, a rough comparison can be made if one notes that at any given time in the on-line material of BMS there are in the range of 5-10 events over a FOV of 4545 arcsec2. As the typical lifetime of the supersonic jets (100 seconds, see BMS) is much longer than the exposure time of any slit position, we can take the image in Fig. 2 as a snapshot similar to those in IMaX (with, indeed, similar exposure times). Thus, simple scaling of the Hinode/SP FOV (300160 arcsec2) suggests that we should find about 24 times more events, i.e., between 120 and 240 events. These numbers compare rather well with the number of detected events here.
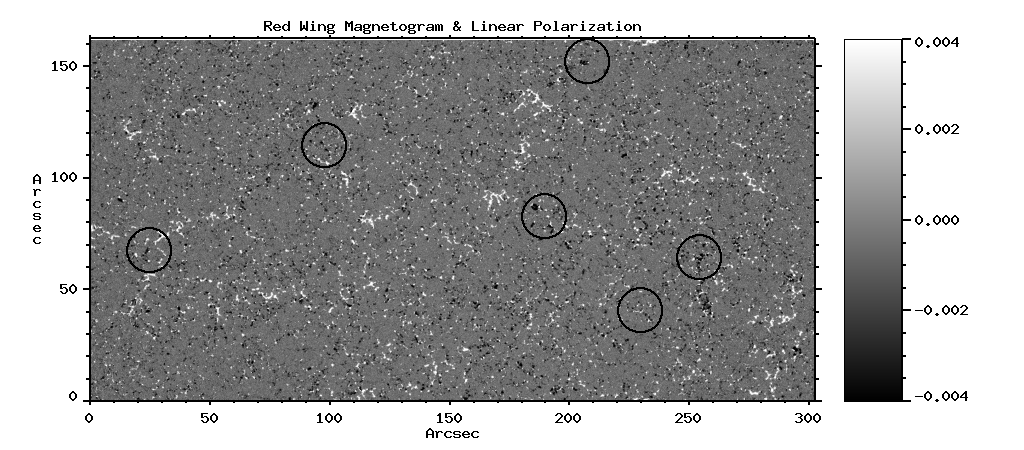
In the bottom panel of Fig. 2 we present the same magnetogram as before but this time combined with the red continuum magnetogram (that is, the displayed quantity is ). The appearance is rather different from the previous case as clear residuals from the network regions are now evident. This is indeed expected as it is well known that the Stokes profiles of this line display an extended red wing that is absent from the blue side of the line (see, e.g., Martínez Pillet et al. Martinezpillet97 (1997)). These signals from the extended wings that mark network locations complicate the identification of events similar to those described for the blue wing magnetogram. Although one can envisage techniques to remove this leakage from network regions, in this work we simply use the magnetogram as presented in this figure as it still allows this identification to be made (see next section).
From a quantitative point of view, we note that the most easily identifiable white events (the high speed flows) in the magnetograms of Fig. 2 are in the range from 0.01 to 0.03 after convolving with the IMaX spectral function. IMaX signals have a similar magnitude before the image reconstruction process and reach values two times larger after reconstruction (with a resolution of 0.15 arcsec).
3 Examples of quiet-Sun jets identified in Hinode/SP
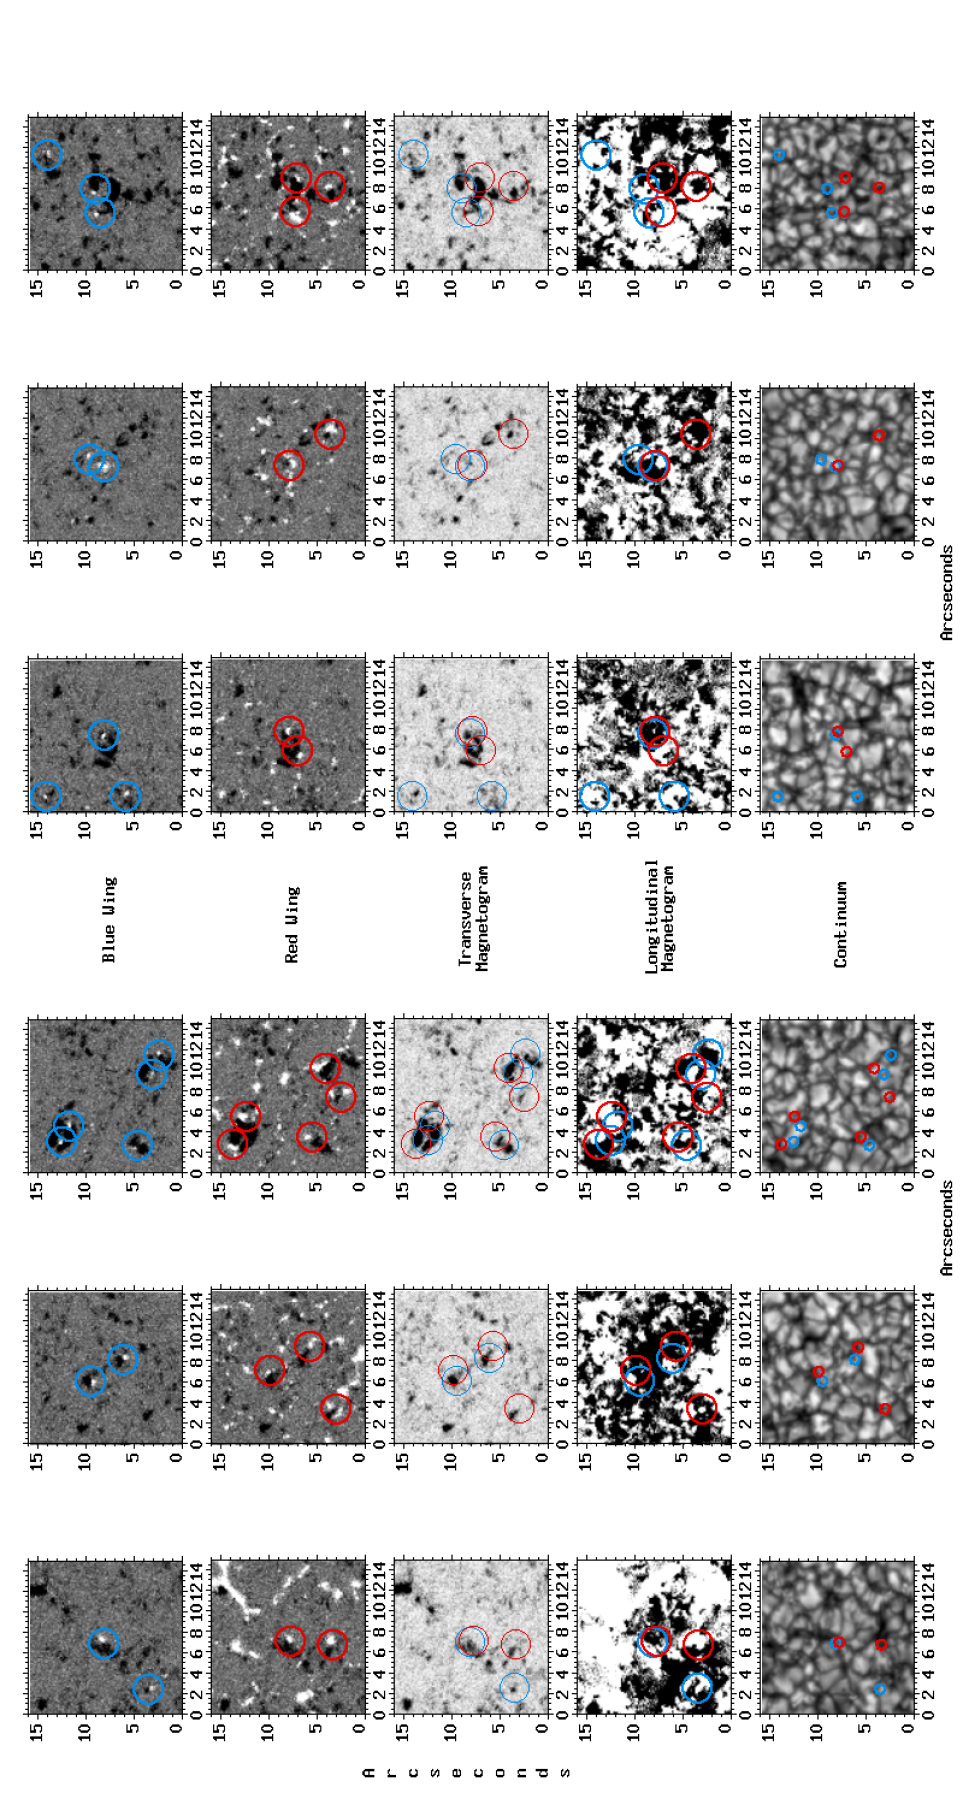
From a visual inspection of the and combination, we selected six cases for closer analysis. They are marked in Figs. 1 and 2 with black circles and shown in an expanded view in Fig. 3. The first row displays the combination The second row shows the same regions, but now using . The third row is the transverse magnetogram (same as Fig. 1 bottom image). In all examples, the selected cases display a number (1) of coincidences between HIF regions and blueshifted signals (first row). In the first row, these coincidences are marked with the blue circles (of 2.76 arcsec diameter). Visual inspection of the Stokes profiles associated with the white patches showed that they correspond to a blueshifted third lobe or to just one isolated Doppler-shifted lobe. The example shown in the fifth position shows a strong blueshifted patch of circular polarization that has no clearly identifiable linear polarization nearby. However, signatures of transverse fields can be found in the corresponding panel (third row), albeit weak. The magnetograms were not used in the identification of the selected regions because of the network leakage effect described before. The most clear example of this leakage is seen in the first example: a narrow tilted zone of about 5 arcsec appears in the top right corner of the image. (The network origin of this signal is confirmed in the normal magnetogram presented in the fourth row.) The red circles mark redshifted jets that are next to the corresponding HIF. In this case, care was taken to ensure that none of the red circles marked correspond to a network-leaked signal. This time, all Stokes profiles displayed a third lobe displaced to the red or a strongly broadened red lobe with a redshifted zero-crossing point.
We note the rather common coincidence between blueshifted and redshifted patches. They seem to occur in pairs. While sometimes only one of the Doppler-shifted signatures appear, often both are present next to the corresponding HIF and next to each other. This can be checked in the fourth row of Fig. 3 that presents the normal magnetogram (highly saturated to ) with overlaid blue and red circles from the previous examples. Apart from the proximity between blue- and redshifted patches from the quiet-Sun jets, this panel also proves that they always occur in regions containing mixed polarities (a fundamental ingredient of any type of reconnection). The neutral lines observed inside the circles might be caused by two different reasons. First, an emerging bipole will always have its intrinsic neutral line (on top of the transverse fields). Second, a newly emerged bipole can encounter pre-existing opposite polarity fields nearby. That in most of the circles seen in the fourth row of Fig. 3 one can identify several neutral lines suggests that both types are present. However, it is not yet clear whether the jets are related to either one of these type of neutral lines or to both. This point will be addressed in future work.
Finally, the fifth row provides the corresponding continuum frames. The overlaid circles have been made smaller in this case (0.92 arcsec diameter) to help us identify the exact location of the high-speed jets on top of the granular pattern. As can be easily inferred, these signatures occur near the edges of the granules in the vast majority of the selected cases. This location suggests a link with the fields that would be encountered by the emerged bipole in the surrounding intergranular lanes.
4 Conclusions
The quiet-Sun jets discovered by BMS have been unambiguously identified in the Hinode/SP data, proving that this is an ever present process that pervades the solar surface. Using the same combination of linear polarization and Stokes far-wing magnetograms as used in the IMaX analysis, we have developed a natural way of pinpointing them in the Hinode/SP database. In this case, we find coincidences between HIF patches and strongly Doppler-shifted signals in both the red and the blue sides of the spectrum. While no analysis of the profiles is presented in this paper, it has been verified that they correspond to cases where the Stokes signal displays highly asymmetric shapes with multiple lobes far from the reference rest wavelengths. The profiles are similar to those presented in Socas-Navarro and Manso Sainz (Navarro05 (2005)) in their Fig. 2 and a deeper study of the Hinode/SP data will likely deduce velocities similar to those found in that work.
The results presented here, that is, the existence of blue- and redshifted flows near HIFs (but not on top of them), the presence of nearby neutral lines in normal magnetograms (i.e. mixed polarities), and the location of the jets on the granular boundaries provide a consistent picture of the physical process behind these quiet-Sun jets. Granulation emerges to the surface loaded with magnetic fields forming a tangled loop configuration; the horizontal fields emerging with the granules encounter nearby pre-existing fields at the intergranular regions and, sometimes, reconnect with them. This naturally explains the existence of the high speed flows, the mixed polarity character, and their spatial location within the granules and at some distance from the transverse field patch. Sweet-Parker reconnection, as modeled by Chae et al. (Chae02 (2002)) and Litvinenko et al. (Litvinenko07 (2007)), and favored by the low electrical conductivity of the photospheric layers, can be invoked to explain the observed flows. According to these works, the outflowing speeds from the reconnection region will be in the range of 3-10 km s-1 (see their Figure 6 of the first reference and Equation 17 of the second) which are capable of generating the observed jets.
Two other possible physical mechanisms could be considered to explain these jets. One is a combination of convective collapse processes and their associated downflows together with occasional rebounded material propagating upwards (see Socas-Navarro and Manso Sainz Navarro05 (2005) or Nagata et al. Nagata08 (2008)). The other mechanism is siphon flows along magnetic arches (Montesinos & Thomas Montesinos93 (1993)). While all three possibilities need to be studied carefully, the strong association with flux emergence favors the reconnection scenario. The Hinode/SP database now provides a fantastic opportunity to study in more detail (with Stokes inversion techniques) the topology and the energetics of these ubiquitous quiet-Sun jets identified now by, both, IMaX/SUNRSIE and Hinode/SP. We urgently need to understand which counterparts of these events can be seen in different wavelengths and in higher altitudes in the solar atmosphere.
Acknowledgements.
Comments by J. M. Sykora and by J.M. Borrero are gratefully acknowledged. The work has been funded by the Spanish MICINN under project AYA2009-14105-C06-03/06 and by Junta de Andalucía under project P07-TEP-02687. Hinode is a Japanese mission developed and launched by ISAS/JAXA, with NAOJ as domestic partner and NASA and STFC (UK) as international partners. It is operated by these agencies in co-operation with ESA and NSC (Norway).References
- (1) Barthol, P., Gandorfer, A., Solanki, S. K., Schüssler, M., Chares, B., et al. 2011, Sol. Phys., 268, 1
- (2) Borrero, J. M., Martínez Pillet, V., Schlichenmaier, R., Solanki, S. K., Bonet, J. A., et al. 2010, ApJ, 723, L144
- (3) Chae, J., Choi, B., Park, M. 2002, JKAS, 35, 59
- (4) Danilovic, S., Pietarila, A., Riethmüller, T.L., Lagg, A., Schüssler, M. et al. 2010a, A& A, submitted
- (5) Danilovic, S., Beeck, B., Pietarila, A., Schüssler, M., Solanki, S. K. et al. 2010b, ApJ, 723, L149
- (6) de Wijn, A. G., Stenflo, J. O., Solanki, S. K., & Tsuneta, S. 2009, Space Science Reviews, 144, 275
- (7) Fischer, C. E., de Wijn, A. G., Centeno, R., Lites, B. W., & Keller, C. U. 2009, A&A, 504, 583
- (8) Ichimoto, K. 2009, In: Magnetic Coupling between the Interior and the Atmosphere of the Sun, S. S. Hasan, R. J. Rutten (eds.), Astrophys. Space Sci. Procs., Springer, Heidelberg, pg.
- (9) Ichimoto, K., Lites, B.W., Elmore, D. et al. 2008, Sol. Phys., 249, 233
- (10) Ishikawa, R., Tsuneta, S., 2009, A&A, 495, 607
- Ishikawa et al. (2010) Ishikawa, R., Tsuneta, S., Jurcak, J. 2010, ApJ, 713, 1310
- (12) Jin., C, Wang, J., Zhou, G. 2009, ApJ, 495, 607
- (13) Kosugi, T., Matsuzaki, K., Sakao, T., et al. 2007, Sol. Phys., 243, 3
- Lites et al. (1996) Lites, B. W., Leka, K. D., Skumanich, A., Martínez Pillet, V., Shimizu, T., 1996, ApJ, 460, 1019
- Lites et al. (2008) Lites, B. W., Kubo, M., Socas-Navarro, H., Berger, T., Frank, Z., et al., 2008, ApJ, 672, 1237
- (16) Litvinenko, Y.E., Chae, J., Park, S. 2007, ApJ, 662, 1302
- (17) Martínez Pillet, V., del Toro Iniesta, J. C., Alvarez-Herrero, A., Domingo, V., Bonet Navarro, J. A., et al. 2010, Sol. Phys., 268, 57
- (18) Martínez Pillet, V., Lites, B.W., Skumanich, A., 1997, ApJ, 474, 810
- Martínez González & Bellot Rubio (2008) Martínez González, M.J., Bellot Rubio, L. R., 2008, A&A, 700, 1391
- (20) Montesinos, B. & Thomas, J., ApJ, 402, 314
- Orozco Suárez et al. (2007) Orozco Suárez, D., et al. 2007, ApJ, 670, L61
- (22) Shimizu, T., Nagata, S., Tsuneta, S., et al. 2008a, Sol. Phys., 249, 221
- Shimizu et al. (2008b) Shimizu, T., Lites, B. W., Katsukawa, Y., Ichimoto, K., Suematsu, Y., et al. 2008b, ApJ, 680, 1467
- (24) Sigwarth, M. 2001, ApJ, 563, 1031
- (25) Suematsu, Y., Tsuneta, S., Ichimoto, K., et al. 2008, Sol. Phys., 249, 197
- (26) Nagata, S., Tsuneta, S., Suematsu, Y., Ichimoto, K., Katsukawa, Y. et al. 2008, ApJ, 677, L145
- (27) Socas-Navarro, H., Manso Sainz, R. 2005, ApJ, 620, 71
- (28) Solanki, S. K., Barthol, P., Danilovic, S., Feller, A., Gandorfer, A., et al. 2010, ApJ, 723, L127
- (29) Tsuneta, S., Ichimoto, K., Katsukawa, Y., et al. 2008, Sol. Phys., 249, 167
- Viticchié et al. (2011) Viticchié, B., Sánchez Almeida, J., Del Moro, D., Berrilli, F. 2011, A&A, 526, 60