Direct Determination of Diffusion Properties of Random Media from Speckle Contrast
Nathan Curry1, Pierre Bondareff1, Mathieu Leclercq1, Niek F. van Hulst2, Riccardo Sapienza2, Sylvain Gigan1,∗, Samuel Grésillon1
1Institut Langevin, ESPCI, CNRS UMR 7587, UPMC Université Paris 6, 10 rue Vauquelin, 75231 Paris Cedex 05, France.
2ICFO-Institut de Ciencies Fotoniques, Mediterranean
Technology Park, 08860 Castelldefels (Barcelona),
Spain, and ICREA-Institució Catalana de Recerca i
Estudis Avançats, 08015 Barcelona, Spain
∗ Corresponding author: sylvain.gigan@espci.fr
Abstract
We present a simple scheme to determine the diffusion properties of a thin slab of strongly scattering material by measuring the speckle contrast resulting from the transmission of a femtosecond pulse with controlled bandwidth. In contrast with previous methods, our scheme does not require time measurements nor interferometry. It is well adapted to the characterization of samples for pulse shaping, non-linear excitation through scattering media and biological imaging.
The propagation of optical waves in scattering media is both a fundamental and a very applied topicwhich requires a deep understanding of how a wave propagates in a scattering medium[1]. An important transport parameter that governs it is the transport mean free path, . Upon multiple scattering, that is when the dimension of the system is much larger than , virtually no ballistic light transport is present and for (where is the wavenumber) we can treat, in first approximation, the propagation as a diffusive process governed by the diffusion constant, .
Coherence plays an essential role in propagation. In the continuous-wave domain, characterized by a single pulsation , multiple scattering gives rise to a very universal random interference figure: the speckle [2]. For a polarized monochromatic wave, the spatial distribution of the speckle intensity follows the Rayleigh distribution , where is the mean intensity, and the contrast is unity.
In a slab geometry, measuring scattering properties, in particular , or the energy velocity is by no means trivial. The angular width of the coherent backscattering cone [3], or, in the case of thin slab geometry, total transmission studies [4], give an evaluation of . The spread of a short pulse [5], speckle correlations in time [6] or frequency [4], phase sensitive interferometric measurements [7] or variation of the effective refractive index [8] allow to extract the diffusion constant . Simultaneous measurement of and [9, 10] give access to .
The relevant time, in the dynamical case, is the Thouless time [11], with associated bandwidth . The characteristic time of diffusion is the time it takes for a photon to leave the medium, related to the diffuse traversal time [12, 7], which takes also into account the direction of the propagation of light (). In essence, a short laser pulse of duration transmitted through the medium will be scattered all over the medium and its duration will be extended by approximately by multiple scattering.
Earlier works have studied how the speckle depends on the coherence of the source [13] or is modified when a monochromatic laser is frequency-tuned in the GHz range [14]. The temporal behavior of the speckle has been measured with a streak camera in the sub-ns range [15] or via non-linear interferometry in the fs range [16]. Some related works on temporal aspects of speckle from surface scattering have also been studied (see for instance [17]). They rely either on temporal measurement (direct or via non-linear interferometry or Fourier Transform) or by time integrated contrast measurement on a camera.
In this paper, we introduce a simple method to determine the diffusion properties of a thin slab of strongly scattering material, in a regime where the other techniques are not easily applicable. The method is based on a simple contrast measurement on a CCD camera and illumination with a femtosecond laser of variable spectral bandwidth.
The investigated samples are 3D scattering media with slab geometry made by sedimentation through vertical deposition from a wt% (weight-weight percentage) water suspension of ZnO powder as described in reference [18]. This technique allows to grow cm2 homogenous samples with a very flat surface, and filling fraction around 50%. The particle size distribution is 230 nm.
In the simple model of reference [2], the contrast of the speckle image is shown to be , where is the number of independent speckle patterns added incoherently. In the present case, the medium is illuminated by a pulse with a bandwidth larger than the bandwidth of the medium . After propagation through the medium, there are independent spectral speckles patterns, making the contrast . This implies that a measurement of the contrast as a function of will give access to , and therefore .
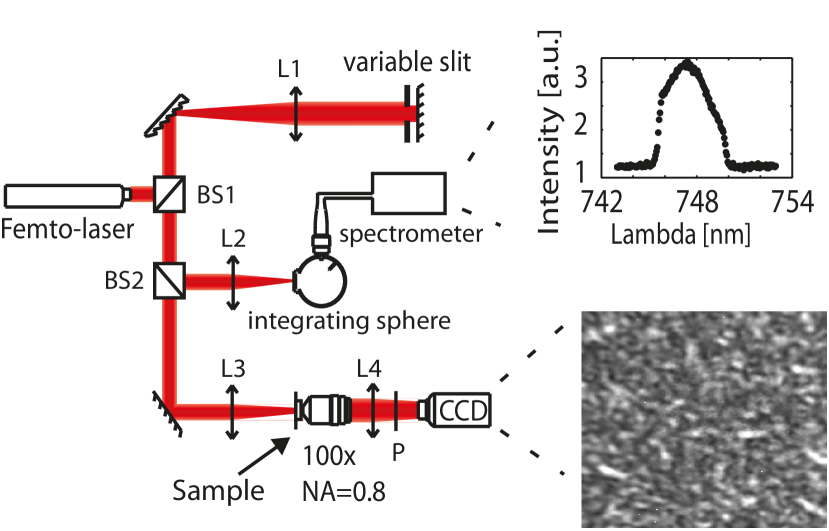
The experimental setup is shown in Figure 1. The light source is a mode-locked Ti:Sapphire laser (Spectra Physics Mai Tai 90 fs pulse and 80 MHz repetition rate), with a central wavelength of 748 nm. The 2 mm collimated TEM00 output of the laser is sent in a zero dispersion line [19] in order to select the spectral bandwidth of the light before the scattering medium. It consists of a series of 3 optical elements, a grating (1200 pitch per mm), a variable slit attached to a mirror, and a lens between the mirror and the grating at the focal distance from both elements. After the zero dispersion line, the beam is focused at the surface of the scattering medium with a lens. Transmitted light is collected with a microscope objective (Olympus 100X, NA = 0.8) and the back focal plane of the objective is imaged with a lens on a CCD camera (AVT PIKE F-100B). The object plane of the microscope is moved by from the sample surface in order to increase the size of the speckle grain on the CCD Camera. A linear polarizer is placed between the objective and the lens to ensure that a single polarization component is imaged. To monitor the input spectrum the laser is partially deflected onto a spectrometer (Ocean Optics HR4000, resolution ) by a beamsplitter after the zero dispersion line. Spectrum and image are acquired simultaneously. The pulse bandwidth at the entrance of the medium is between the bandwith of the laser and , limited by diffraction on the slit.
A typical image on the CCD is shown in inset on Fig. 1. The contrast of the speckle is calculated within a statistically homogeneous region of the CCD, either in the speckle image (speckle), either not (dark). The contrast , where and are the mean and standard deviation of the pixel intensities within the defined region. Error of is evaluated based on the standard deviation of the dark image.
Samples with different thicknesses were illuminated with light pulses of various bandwidths in order to investigate the link between the speckle contrast and . To quantify the contrast modification with in a more complete formalism, we treat a thin strongly scattering sample using a slab geometry and assuming a non-absorbing medium. This treatment, however, is general and can be extended to any geometry and medium including those in which both scattering and absorption are significant. The first question is to determine the distribution of transit time through such a medium. A general treatment of this problem has been introduced in [20]. In the multiple scattering regime, the spatially integrated transmittance as a function of time for negligible absorption reads (from Eq. (15) of [20]):
| (1) | |||||
We neglected contributions by more than 3 reflections as they do not contribute significantly to in the numerical calculation. This time-dependent transmission has to be compared to the pulse duration in order to determine the contrast. In reference [13] a formalism is introduced for this purpose, in the context of continuous-wave laser propagating through a very thick medium, which is also valid in the case of a short pulse. A spatially coherent source of spectrum going through a scattering medium of time distribution produces a speckle with a contrast given by the following integral:
| (2) | |||||
and where is, with a change of variable, a Fourier transform of , and reads:
| (3) |
It is important to note that all parameters of the problem are not fully independent as and depend in a non-trivial way on all the parameters , and . As a consequence it is not possible to infer all parameters independently from contrast measurements.
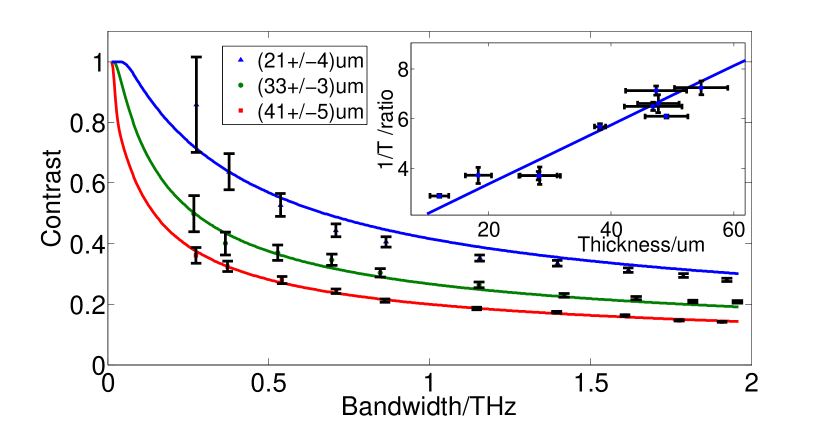
By changing the width of the variable slit, measurements of the contrast were made over a range of spectral bandwidths . As expected (Fig. 2). As expected for large values of the bandwidth the contrast asymptotically decreases with increasing bandwidth in the form and decreases with faster for thicker material as the traveling time gets longer. The monochromatic limit where is reached when , i.e. when is identical to the confinement time of the medium [21].
Once known , the diffusion constant can be obtained if the transport mean free path is measured. can be extracted from a total transmission measurement by employing the optical analogue of the Ohm’s law: the angular integrated total transmission is inversely proportional to the thickness of the sample. A simple expression relating to is [22]:
| (4) |
where we have assumed symmetric boundary conditions and , , is the absorption length and is a correction factor due to the diffuse reflectivity of the boundary conditions [23], which we calculated to be =0.49 for a ZnO sample in air. The interface between the sample and the glass substrate is here neglected as index matching is almost achieved between glass (n=1.46) and the sample (n1.5). Eq. 4 holds in the multiple scattering regime () which is the case of the samples under study. When absorption can be neglected, Eq. 4 simplifies to .
Total transmission as a function of sample thickness is measured by focusing a laser beam at 748 nm on a set of samples placed at the entrance of an integrating sphere. The integrated light transmitted at all angles is sent via an optical fibre to a spectrometer, which measures the total transmission [10]. The inset in figure 2 shows a plot of the inverse of the transmission as a function of the thickness for . Vertical error bars are based on the variation of transmission for different position on the sample while the horizontal ones are the standard deviation of the sample thickness upon repeated measurements. Fitting this data set to the model gave and such that absorption is negligible.
, and being measured independently, by fitting Eq. 2 to all data, is found to be for our ZnO samples. Fits are shown in Fig. 2 for 3 samples. This allows to be calculated for our medium as , i.e. , where is the speed of light in vacuum.
Alternatively, the description of the speckle contrast in terms of interference of independent spectral modes provides a straightforward estimate of the diffusion properties of the medium: using , we estimate the diffusion coefficient to be , close to the rigorous value previously calculated.
In conclusions, using a CCD camera and a femtosecond light pulse, we demonstrate a simple set-up to characterize the diffusion properties of a scattering medium. In order to avoid complex interferometry measurement of time and phase we exploit the ability of a multiple scattering medium to mix spatial and spectral modes at the output [24]. In view of the recently realized spatio-temporal control of light pulse in scattering media [24, 25], our concept applies for a wide range of Thouless time, and therefore allows to characterize the diffusion coefficient for various scattering media, for photonics and biological applications.
We acknowledge fruitful discussion with Remi Carminati. PB is funded by ANR ROCOCO. RS and NH acknowledge the financial support of MICINN, programs FIS2009- 08203, CONSOLIDER CSD2007-046, RyC, Fundacio’ CELLEX, and the EU Project ERC.
References
- [1] P. Sebbah, Waves and Imaging through Complex Media. (Kluwer Academic, 2001).
- [2] J. W. Goodman, J. Opt. Soc. Am. (1976) vol. 66 (11) pp. 1145-1150.
- [3] P. E. Wolf et al., J. Phys. (1988) vol. 49 p63.
- [4] A. Z. Genack, Phys. Rev. Lett. (1987) vol. 58 (20) pp. 2043-2046
- [5] D.S. Wiersma et al, Phys. Rev. E (2000) vol. 62, pp. 6681, J. M. Drake et al., Phys. Rev. Lett. (1989) 63, pp. 259.
- [6] W. Cai et al Proc. Natl. Acad. Sci. USA (1996) vol. 93, pp 13561.
- [7] I. M. Vellekoop et al, Phys. Rev. E (2005) vol. 71, 056604.
- [8] S. Faez et al., Phys. Rev. Lett. (2009) vol. 103 (5) 053903.
- [9] M. P. van Albada et al., Phys. Rev. Lett. (1991) vol. 66 (24) pp. 3132-3135, Ad Lagendijk et al., Phys. Rep. (1996) vol. 270 pp. 143-215,
- [10] R. Sapienza et al., Phys. Rev. Lett. (2007) vol. 99, 233902.
- [11] D. J. Thouless, Phys. Rev. Lett. (1977) vol. 39 (18), pp1167-1169.
- [12] R. Landauer et al, Phys Rev. B (1987) vol. 36 (12) pp6255-6260.
- [13] C. A. Thompson et al., Appl. Optics (1997) vol. 36 (16) pp. 3726-3734,
- [14] J. D. McKinney et al., Opt. Lett. (2000) vol. 25 (1) pp. 4-6, J.-M. Tualle et al., Opt. Lett. (2005) vol. 30 (1) pp. 50-52.
- [15] M. Tomita et al, J. Opt. Soc. Am. B (1995) vol. 12 (1) pp. 170-174.
- [16] Liu Wen-Jun et al. , Chinese Phys. B. (2010) vol. 19 (2), 024204.
- [17] P. M. Johnson et al., Phys. Rev. E (2003) vol. 68 (1), 016604, E. Tal and Y. Silberberg, Opt Lett (2006) vol. 31 (23) pp. 3529-3531.
- [18] P.D. García et al. Adv. Mater. (2007) vol. 19. pp 2597-2602.
- [19] Antoine Monmayrant, Sebastien Weber, and Beatrice Chatel, (2010) J. Phys. B: At. Mol. Opt. Phys. vol. 43, 103001.
- [20] M. S. Patterson et al., Appl. Optics (1989) vol. 28 (12) pp. 2331-2336.
- [21] N. Cherroret et al., http://arxiv.org/abs/1007.2085
- [22] N. García et al, Phys. Rev. B (1992) vol. 46 (22) pp. 14475-14479.
- [23] J.X. Zhu, D. J. Pine, and D.A. Weitz, Phys. Rev. A(1991) vol. 44 (6) pp. 3948-3959.
- [24] J. Aulbach et al., Phys Rev. Lett. vol. 106, 103901 (2011), O. Katz, et al, http://arxiv.org/abs/1012.0413
- [25] D. J. McCabe et al., http://arxiv.org/abs1101.0976