OPTICAL PROPERTIES OF THE ULTRALUMINOUS X-RAY SOURCE HOLMBERG IX X-1 AND ITS STELLAR ENVIRONMENT
Abstract
Holmberg IX X-1 is an archetypal ultraluminous X-ray source (ULX). Here we study the properties of the optical counterpart and of its stellar environment using optical data from SUBARU/Faint Object Camera and Spectrograph, GEMINI/GMOS-N and Hubble Space Telescope (HST)/Advanced Camera for Surveys, as well as simultaneous Chandra X-ray data. The spectroscopically identified optical counterpart is part of a loose cluster with an age . Consequently, the mass upper limit on individual stars in the association is about . The counterpart is more luminous than the other stars of the association, suggesting a non-negligible optical contribution from the accretion disk. An observed UV excess also points to non-stellar light similar to X-ray active low-mass X-ray binaries. A broad He II4686 emission line identified in the optical spectrum of the ULX further suggests optical light from X-ray reprocessing in the accretion disk. Using stellar evolutionary tracks, we have constrained the mass of the counterpart to be , even if the accretion disk contributes significantly to the optical luminosity. Comparison of the photometric properties of the counterpart with binary models show that the donor may be more massive, , with the ULX system likely undergoing case AB mass transfer. Finally, the counterpart exhibits photometric variability of 0.14 mag between two HST observations separated by 50 days which could be due to ellipsoidal variations and/or disk reprocessing of variable X-ray emission.
1 Introduction
Ultraluminous X-ray sources (ULXs) are compact X-ray sources that are located away from the nucleus of their host galaxy, emitting well above the Eddington limit of a black hole () assuming isotropic emission. It is now agreed that ULXs are accreting systems powered by black holes, due to the high X-ray variability they sometimes display on timescales as short as minutes. Among the remaining questions is the nature of these black holes: are they stellar-mass black holes similar to Galactic X-ray binaries but with higher accretion rates or do they contain intermediate-mass black holes? See Roberts (2007) for a recent X-ray review.
Holmberg IX X-1 (HoIX X-1 also known as M81 X-9) is a prototype ULX located in Holmberg IX, an irregular dwarf galaxy cataloged by Holmberg et al. (1974) belonging to the M81 group of galaxies. It is located at about 3.6 Mpc (the distance of M81; Freedman et al. 1994), corresponding to a distance modulus . Holmberg IX may be a tidal dwarf galaxy resulting from the major interaction between M81, M82, and NGC 3077 that occurred 200 Myr ago or an old dwarf galaxy (Sabbi et al. 2008). Indeed, this group of galaxies is located in a giant H I cloud with tidal bridges connecting the different components (Yun et al. 1994). Numerous optical knots have been detected along the H I filaments where there are overdensities, Holmberg IX being one of the most prominent such objects.
Discovered by Einstein (Fabbiano 1988) and studied with all the following X-ray satellites (see Vierdayanti et al. (2010) for an X-ray review), HoIX X-1 is an extremely luminous X-ray source with an isotropic X-ray luminosity (0.3–10 keV) usually above and thus is one of the most luminous ULXs. The X-ray spectrum of this ULX has been interpreted in two different ways, either as a cool accretion disk () with an additional power law or as a slim disk characterized by a hot thermal component (). This has led to two opposite conclusions with the former interpretation suggesting the presence of an intermediate-mass black hole () accreting at a sub-Eddington rate (Miller et al. 2004) and the latter implying a stellar-mass black hole () accreting at a super-Eddington rate (Tsunoda et al. 2006). Recently, a model consisting of a disk plus a cool, optically thick corona (Gladstone et al. 2009; Vierdayanti et al. 2010) has been applied to high-quality X-ray spectra of ULXs and in particular to HoIX X-1. This model suggests a stellar-mass black hole with super-Eddington accretion.
HoIX X-1 is located about () northeast of the center of Holmberg IX and about () outside of what we can consider the limit of the stellar envelope of the galaxy. This ULX is thus present in a zone where there is no intense stellar formation, but we note the existence of a close molecular cloud (Brouillet et al. 1992) at southeast of its position. The Galactic interstellar extinction is low, E() 0.08 (Schlegel et al. 1998), making this source a very good target for an optical photometric and spectroscopic study.
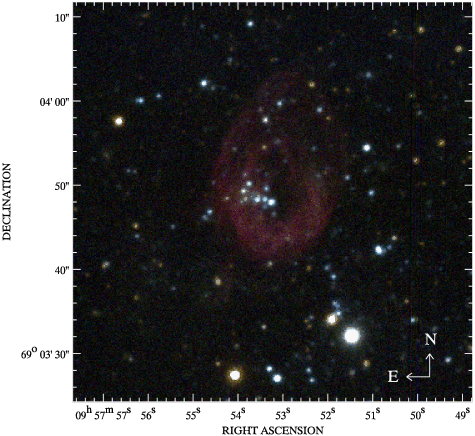
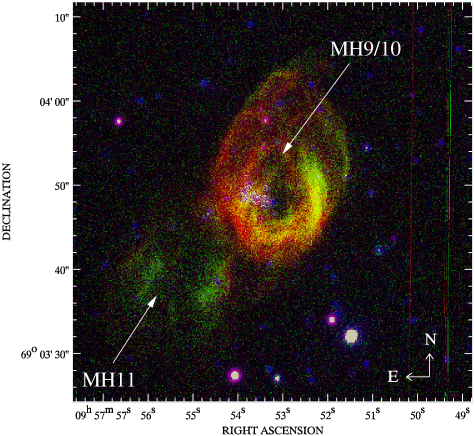
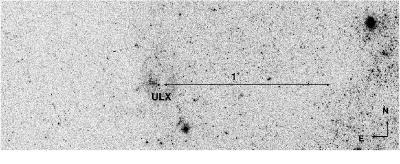
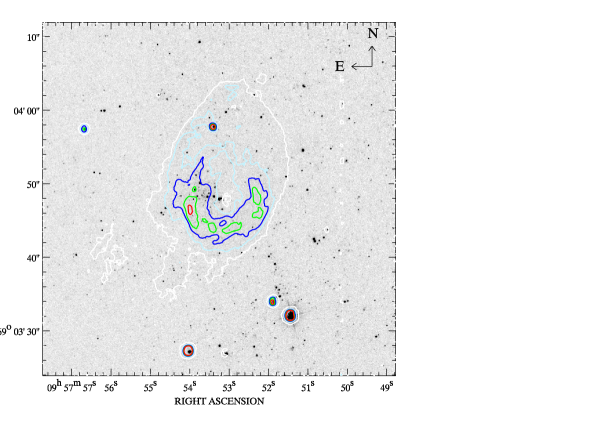
The striking characteristic of HoIX X-1 at optical wavelengths is the presence of a huge ionized nebula, see Miller (1995) and Figure 1, with a size of pc at the distance of 3.6 Mpc. This and further work (Pakull & Mirioni 2002, 2003) has shown that shocks should play a key role in the nebula even if photoionization from the X-ray source is possibly required to understand all the properties of the nebula (Abolmasov & Moiseev 2008). The optical counterpart of the ULX is the most luminous object belonging to a small stellar association located inside the nebula (Grisé et al. 2006; Ramsey et al. 2006). This paper concentrates on the properties of the optical counterpart and its stellar environment, revising and expanding our previous results (Grisé et al. 2006).
2 Observations and data analysis
2.1 SUBARU
The SUBARU data set comes from two observing programs (PIs: T. Tsuru, M. Pakull) and makes use of the SUBARU/Faint Object Camera and Spectrograph (FOCAS) instrument (Kashikawa et al. 2002). This instrument has been used to study the counterparts and environment of several ULXs, one of them being HoIX X-1. This data set consists of imaging through broadband filters as B, V, and R and through narrowband filters as Hα and [O III], as well as spectroscopy. All the raw frames were reduced under ESO MIDAS using standard procedures, i.e., correcting for bias and flat fields. The two spectra were combined and then wavelength and flux calibrated.
The local environment to the ULX is not completely resolved, so point-spread function (PSF) fitting photometry is necessary to separate blended objects. We used the package DAOPHOT II (Stetson et al. 1990) under ESO MIDAS and we employed a quadratically varying PSF in the field.
Our absolute photometry in the B, V, and R bands uses three consecutive observations made on 2003 Jan 26 (see Table 1 for details of the SUBARU observations). Photometric transformations were derived with the only observed standard field, Ru152, for which we used both the Landolt standard stars and also a set of stars defined by Peter Stetson 111Photometry of this secondary set of stars is available on the CADC Web site, http://www3.cadc-ccda.hia-iha.nrc-cnrc.gc.ca/community/STETSON/standards/. This permitted us to obtain a more homogeneous calibration on the range of photometric colors and also to use stars fainter than the 14th mag.
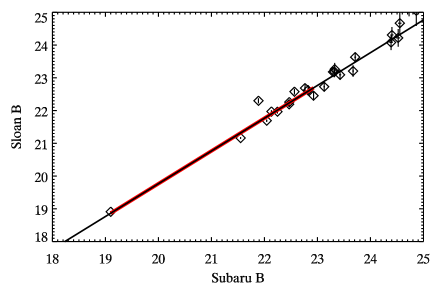
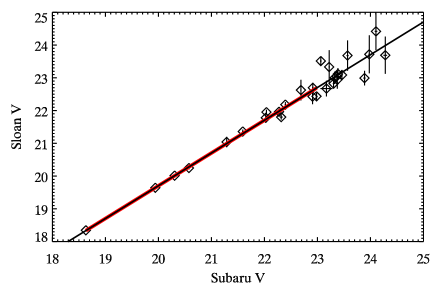
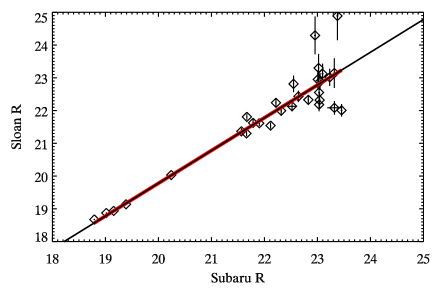
To check our photometry, we used the Sloan Digital Sky Survey (SDSS) data release 6 (Adelman-McCarthy et al. 2008) which imaged fields around our target. Thanks to its 2.5 m telescope, photometry with an accuracy of 2%–3% is possible down to 21–22nd magnitude. The filters’ system used by the SDSS is noticeably different from the Johnson-Cousins system, so we had to transform the , and magnitudes into , , . For that we used the empirical transformations of Lupton222See http://sdss.org/dr6/algorithms/sdssUBVRITransform.html (2005) who made a correlation between SDSS photometry and Stetson photometry. A possible dependence on color or metallicity related to the spectral type of stars has not been taken into account. As our goal is to make a global comparison between the two photometric data sets and not an analysis of SDSS data, we can content ourselves with this approach.
The results of this comparison are shown in Figure 2. We note the good linear agreement in the three filters. The scatter at faint magnitudes is consistent with the photometric errors of the SDSS and is more evident in the filter, where the errors are higher than in the other filters. However, there is an offset in each filter, with the SUBARU magnitudes being fainter than the SDSS values (+0.23 mag in , +0.30 mag in , and +0.22 mag in ). The reason for these offsets are unclear. In the following, all SUBARU measurements have been corrected by these offsets.
Long-slit spectroscopy has been done with the slit centered on the assumed counterpart. The observational settings include a 150 lines grism, an filter, and a slit of 06 in width. This translates into an accessible wavelength range of 4600–7600 Å, a dispersion of 2.8 Å and a resolution at 6500 Å, i.e., the spectral resolution is approximately 8 Å.
2.2 HST
The second data set used in this study comes from the Hubble Space Telescope (HST)/Advanced Camera for Surveys (ACS) archive (Program GO-9796 ; PI: J. Miller). Observations were made on 2004 February 07 with the Wide-Field Camera (WFC) in the , , and filters, and also with the High Resolution Camera (HRC) in the filter. One additional observation was made on 2004 March 25 with the WFC in the filter. More details about these observations are given in Table 2. We have re-analyzed the data using the latest calibration files available at the time of the analysis (STSDAS v3.5) and have applied the standard corrections, especially about the spatial distortion (Multidrizzle v2.7.2; Koekemoer et al. 2002). As in the SUBARU observations, the field of interest looks moderately crowded in the HST/ACS image so we used again DAOPHOT II (Stetson et al. 1990) for the photometric analysis. This analysis is similar to our previous study of the ULX NGC 1313 X-2 and details can be found in Grisé et al. (2008, G08 hereafter).
2.3 Comparison between HST and SUBARU photometry
Optical variability is an important parameter in studies of X-ray binaries, since it can constrain the orbital period of the system or quantify a possible variability linked to the accretion disk. To study photometric variability using different telescopes, we have to make sure that the magnitudes derived from the HST and SUBARU data sets are consistent. As for our previous study (G08), we have isolated bright point-like sources in the two data sets and compared their luminosities to study the photometric accuracy of our two data sets.
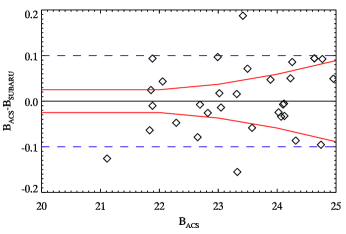
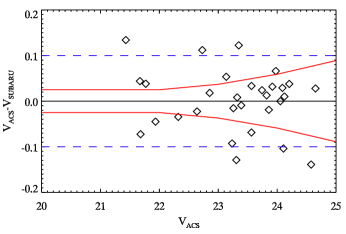
Figure 3 shows the magnitude differences between FOCAS and ACS in the and filters for observed stars. For 50% of them, the differences are consistent with the combined photometric errors of the two instruments. For the other objects, the differences are almost always below 0.1 mag. Standard deviations are and which turn out to be the same as found in our previous study of NGC 1313 X-2 between HST/ACS and ESO/VLT data (G08). We note that deviations of the order of 0.1 mag are easily explained by, for example, a 23 mag object blended with a 26 mag object.
Photometric study of the ULX counterpart with SUBARU, Table 3, was done on 2003 Jan 26 with three consecutive observations in the three photometric bands , and , strongly limiting the risk of seeing intrinsic variability which could have introduced a bias in colors estimation. Comparing with HST data, Table 4, we note excellent agreement in the () colors with magnitude differences being explained by variability.
2.4 GEMINI
The last optical data set used in this study comes from the GEMINI/GMOS-N archive (Program ID GN-2008A-Q-49; PI: J. Gladstone). The observations consist of six spectra taken consecutively in the night of 2008 March 07 with the Gemini Multi-Object Spectrograph (GMOS) (Hook et al. 2004) installed on the 8.1 m Gemini North telescope. The B600 grism was used, covering a wavelength range of 3160–6070 Å with a dispersion of 0.90 Å including a binning, and the slit width was .
Data reduction was performed using the latest GEMINI IRAF package v1.10. All standard tools to reduce long-slit spectroscopy are included and easily handle the three CCDs frames. Flat fields were created and used with the processed bias to correct for instrumental defects. After wavelength calibration, the six spectra were co-added using the ccdclip rejection algorithm to remove cosmic rays and other bad pixels. Careful extraction of the spectrum was done due to the trace which appeared to vary by six pixels from one side of the frame to the other. We did not perform an absolute flux calibration.
2.5 Chandra data
Simultaneous X-ray and optical observations are quite rare for ULXs, so we took the opportunity that two X-ray pointings were done at the same time as the HST observations. We retrieved the data from the Chandra archive which consist of two 5 ks ACIS-S observations (PI: J. Miller, see details in Table 5). We used the level 2 event files but were faced with severe pile-up due to the combination of the high count rate of the source and the frame time used, 1.8 s. Standard extraction of the data led to highly distorted spectra, and use of the pile-up model (Davis 2001) in Xspec 12.6.0l (Arnaud 1996) was not able to solve this problem. Thus, we extracted only the counts coming from the PSF wings of the source, where pile-up should be negligible. To do so, we used the recipe devised by M. Tsujimoto333http://www.astro.isas.jaxa.jp/tsujimot/arfcorr.html that provides a method to correct the Ancillary Response File when using events from the outskirts of the PSF. To maximize the signal-to-noise ratio without including a large fraction of piled-up events, we used a series of different extraction annuli, then fitted an absorbed power law in Xspec and plotted the power-law index versus the radius of the inner extraction annulus. The power-law index is unphysically hard () at small inner radii, but increases at larger radii until reaching a plateau. This is where pile-up becomes negligible and corresponds to an inner extraction radius of 3.5 and 4.0 pixels for the first and second observation, respectively. The outer radius for the extraction was taken as 20 pixels for both observations.
Results of the spectral fits, involving 286 and 240 counts, respectively, are shown in Table 5, where the spectra were grouped to have bins of at least 20 counts. We were unable to use models more complex than an absorbed power law due to the loss of counts resulting from the pile-up. Our fits, using a column density fixed to (Gladstone et al. 2009; Vierdayanti et al. 2010) are quite similar for the two observations with a power-law index of and an absorbed flux of . This is consistent with the apparent permanent hard spectrum of HoIX X-1 (Kaaret & Feng 2009).
3 Results and discussion
3.1 Identification of the optical counterpart
3.1.1 Photometric identification
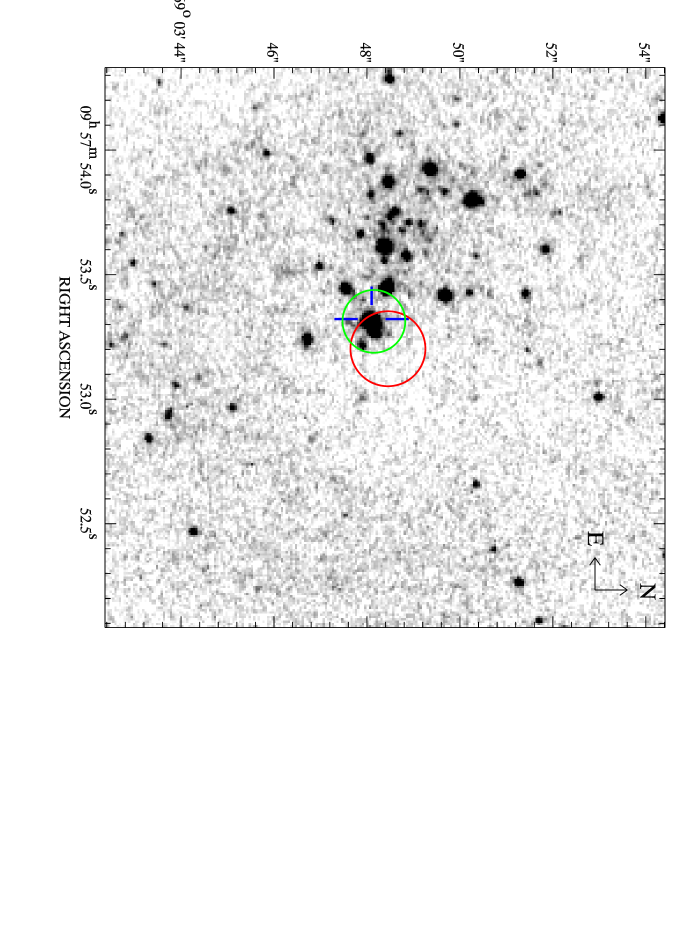
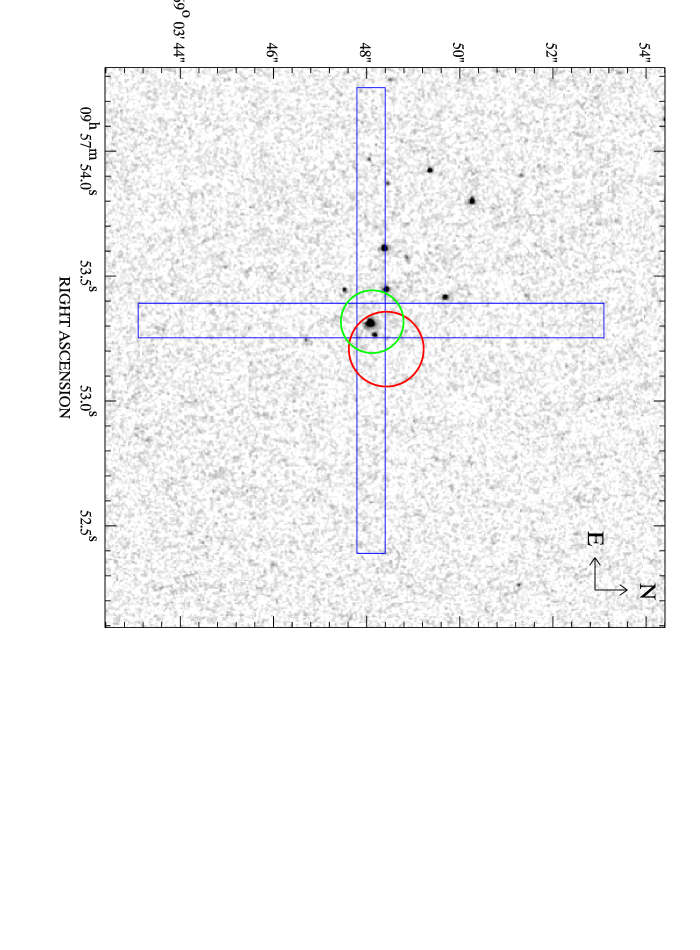
The HST images were individually astrometrically re-calibrated using 10 stars from the Two Micron All Sky Survey catalog (Skrutskie et al. 2006). The rms of these fits are between and . In the Chandra observations, the ULX is located almost on-axis, with an offset of only . In these conditions, the Chandra X-ray absolute position has a 90% uncertainty of . We have compared the X-ray positions of some sources outside the field shown in Figure 4 with the HST/ACS images and found that they are coincident with extended objects, hence preventing a re-calibration. Taking the optical centroids of these objects, we found that two of them are consistent with the Chandra X-ray position within and the third one shows a larger offset, . The positions of the ULX in the three HST/ACS observations are all within 1 pixel, i.e., and are totally consistent with the Chandra position (Table 6).
We also used for comparison the XMM-Newton position, Table 6, coming from a long observation (PI: Tod Strohmayer, ObsID: 0200980101, exposure time: 100 ks) and listed in the second XMM-Newton serendipitous source catalog (Watson et al. 2009). The XMM position has a statistical error of but is affected by a systematic uncertainty (). Thus, the 90% confidence radius, including the optical astrometric uncertainty, is . Figure 4 shows the Chandra and XMM-Newton positions of HoIX X-1 with, respectively, a and a radius error circle (90% confidence, including the error on the calibration of the optical image) on an HST/ACS image, which does not allow one to identify a unique counterpart. Specifically, the brightest object is contaminated by a nearby faint star, , at northwest of its position.
3.1.2 Spectroscopic identification
Our SUBARU spectroscopic observations were centered on the presumed counterpart, i.e., the brightest object of the small association of stars. The ULX is embedded in the optical nebula MH9/10 but fortunately, the central position of the counterpart is coincident with a region where the nebula has low intensity.
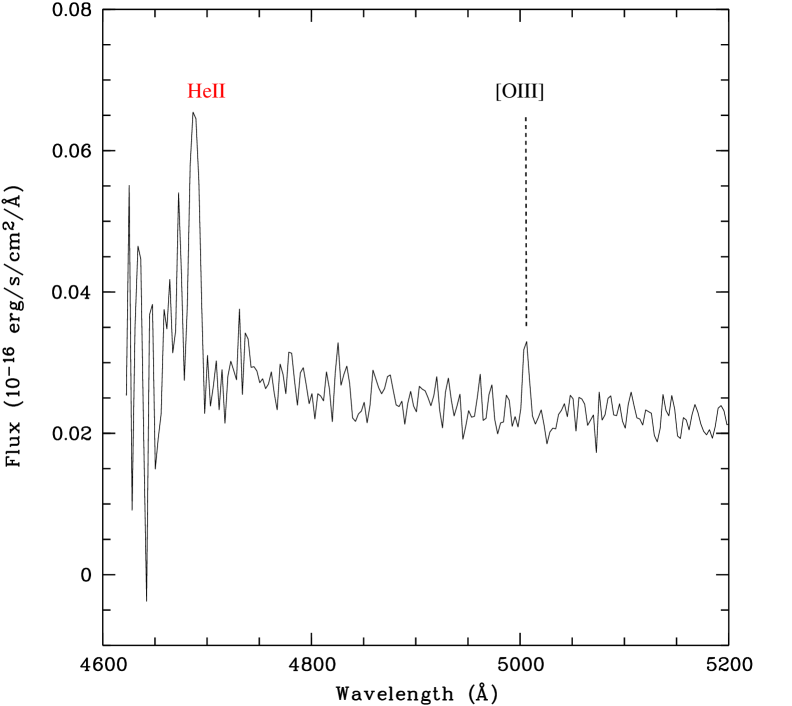
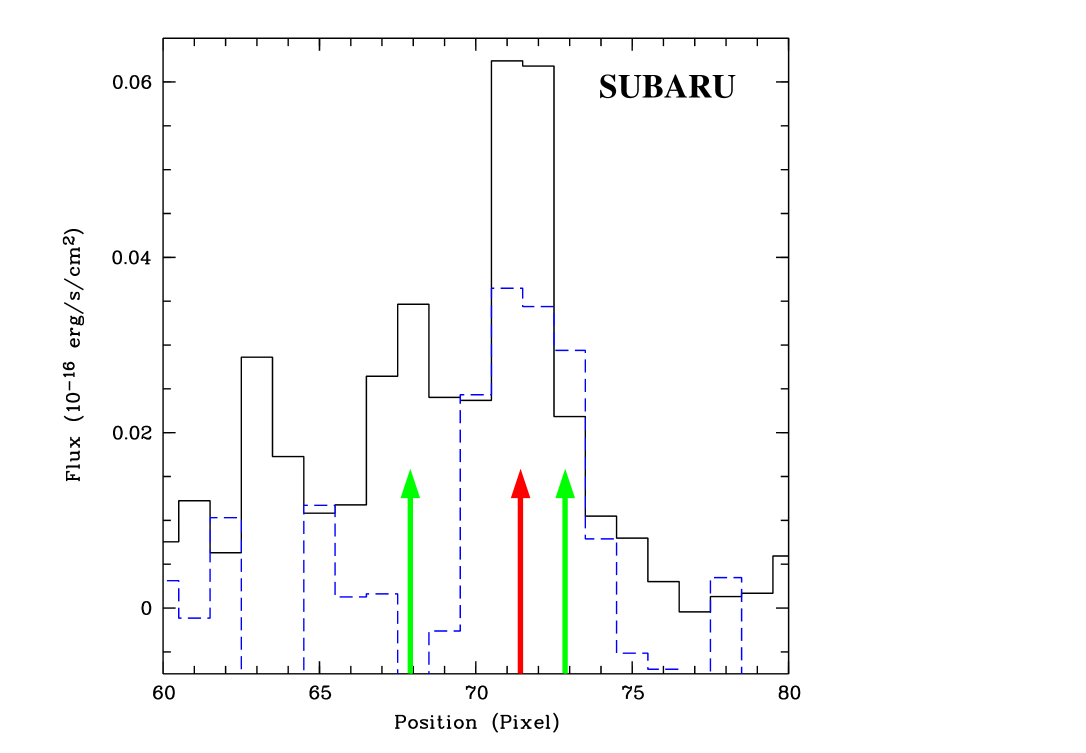
The one-dimensional SUBARU spectrum of the most luminous object in the X-ray error circle with the slit oriented east-west is shown in Figure 5. The main feature of the spectrum is the presence of the 4686 He II emission line, which is a typical signature of X-ray binaries and thus identifies this object as the optical counterpart of the ULX. The line is spatially coincident with the continuum of the counterpart, Figure 6, and excludes the possibility that the emission comes from the nearby fainter star. The He II line is not spectrally resolved in the FOCAS spectra. Its equivalent width (EW) is . The emission coincident with the continuum of the counterpart is unresolved, Figure 6, as in NGC 1313 X-2 (Pakull et al. 2006; Grisé et al. 2009), and thus probably reflects the emission of the ULX system.
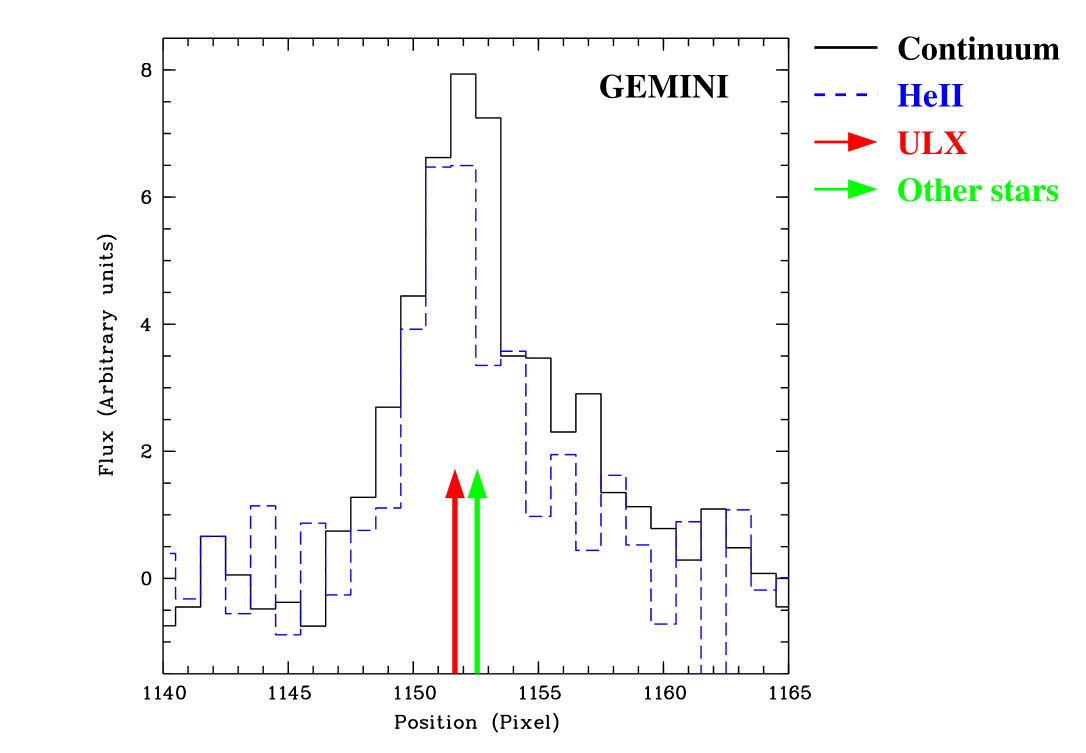
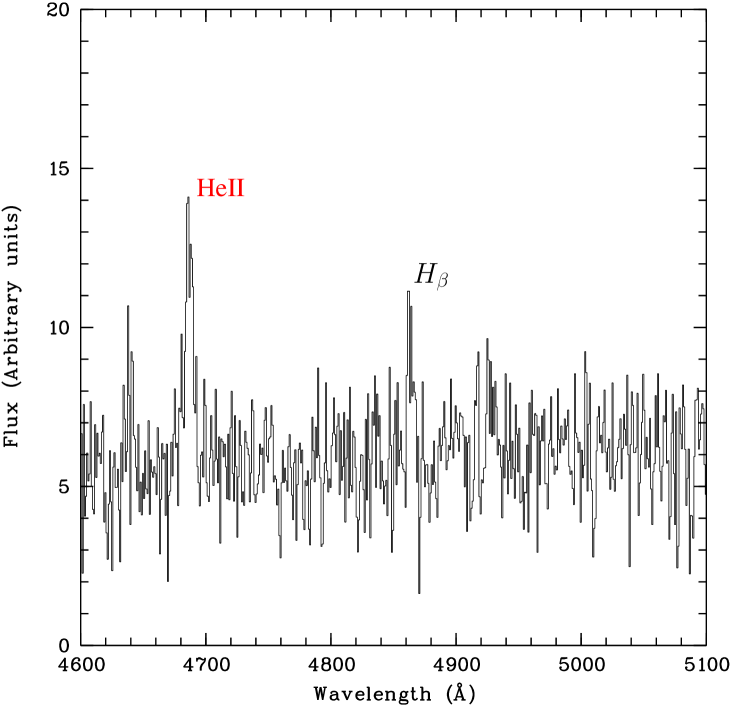
The GEMINI spectrum confirms this result, see Figure 7. In this case, the slit was oriented north-south so the brightest object and nearby fainter star are located at almost the same position along the slit. The He II line is again spatially coincident with the brightest object. Thus, the fainter object cannot be the ULX counterpart, in agreement with the SUBARU spectrum. The GMOS spectrum has better resolution (pixel scale of 0.9 versus 2.8 Å and spectral resolution of 3.7 versus 8.0 Å for SUBARU spectrum), allowing the emission lines to be resolved. In the co-added spectra, the He II line has an intrinsic FWHM of 7.0 Å or 450 compared to the nebular lines like [O III]5007 with an intrinsic FWHM Å or 200 . The width of the He II line is comparable with that of NGC 1313 X-2 (Pakull et al. 2006; Grisé et al. 2009) and indicates that the He II emission is produced in the ULX system rather than being of nebular origin. Contrary to the behavior observed in NGC 1313 X-2 (Grisé et al. 2009), the EW of the He II line is stable in HoIX X-1 between the SUBARU and the GEMINI observations, with a value of 11 Å in the latter which is consistent with the high and persistent X-ray luminosity of the ULX. We note that the EW of the He II4686 line is more than 10 times higher in this object than in the brightest Galactic (and Magellanic) high-mass X-ray binaries which is consistent with the higher X-ray luminosity of ULXs.
The radial velocity of the He II line is similar in the six individual GEMINI observations and does not show significant variation between the SUBARU and the GEMINI observations with a velocity consistent with those of the nebular lines. Although this result could just be a matter of coincidence, we would expect a radial velocity shift if the He II line is indeed emitted in the accretion disk and the black hole is not very massive. We note that a recent dedicated spectroscopic campaign done by Roberts et al. (2010) has shown that the He II line displays non-periodic radial velocity variations with rapid variability of the line profile on timescales shorter than a day, casting doubt on the possibility to derive a mass function for this object with this method.
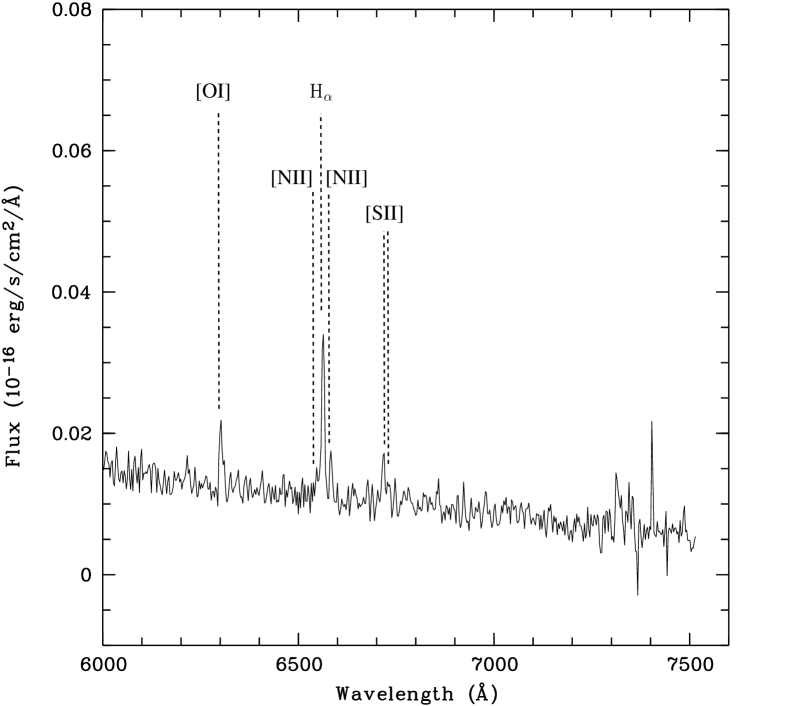
Thus, the spectrum of the counterpart of HoIX X-1 is similar to other spectra of ULX counterparts (e.g, Grisé et al. 2009; Kaaret & Corbel 2009), specifically a blue continuum without any spectral features apart from the He II emission line. The two-dimensional spectrum of the counterpart is contaminated by the presence of nebular emission lines. As the intensity of the nebula is highly spatially variable, we extracted the spectrum by subtracting a nebular background taken from a small region close to the ULX counterpart on the faint side of the nebula. We note the presence of emission lines such as [O III], [O I], Hα, and [S II], which are probably residual emission of the nebula due to its highly non-uniform intensity.
3.2 Stellar association around the ULX
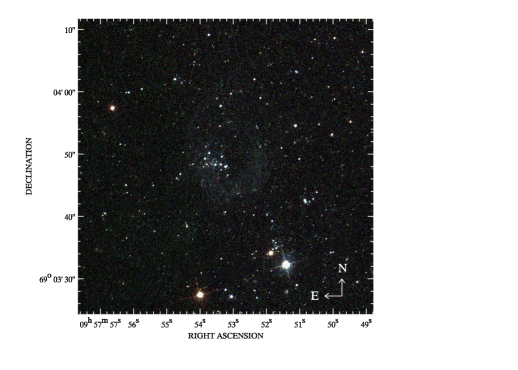
The multicolor SUBARU image (Figure 1) shows that the environment around the X-ray source is dominated by a compact group of blue stars located inside the Hα nebula, the filter also includes the Hα line. Outside of the nebula, we observe a mix of blue and red stars, and also foreground stars. On a large-scale HST image (Figure 8), we note that HoIX X-1 is located about east of an area rich in blue stars and is outside the standard isophotal radius of the galaxy Holmberg IX. On the contrary, we observe few stars north of the ULX, with a diffuse background of red stars close to the limit of detection and a few blue stars.
The ULX clearly does not belong to an intense star-forming region but rather appears outside the main body of the galaxy. The tight stellar association around the ULX is resolved into some seven stars (Figure 1) in the SUBARU data thanks to the excellent seeing during the observations (Table 1). The multicolor HST image (Figure 9) resolves the stellar association close to the ULX into dozens of members.
3.3 Extinction
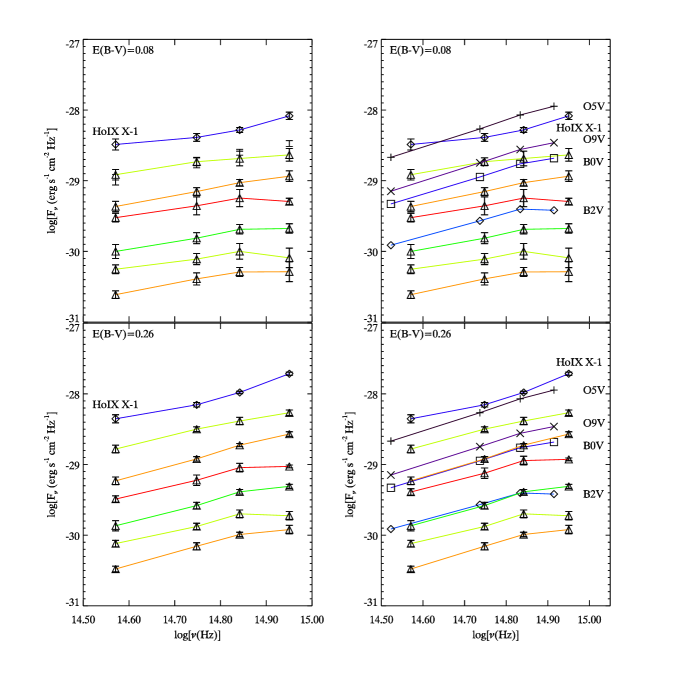
The quality of the photometry and the good agreement between the two data sets are two major points. Another key parameter for the interpretation of the data is the extinction along our line of sight toward HoIX X-1. The Galactic reddening is low ( = 0.08; Schlegel et al. 1998), and studies of the stellar population in Holmberg IX have never clearly identified any substantial, local reddening (e.g., Makarova et al. 2002). To check the extinction, we plotted the spectral energy distributions (SEDs) of all the stars located near the ULX dereddened by the Galactic extinction, see Figure 10. Given the magnitudes and colors of most of those stars (, , ), they have to be main-sequence early-type stars, such as O8 to B2 stars, although we cannot rule out that a few may be evolved. Comparison of these stars with SED templates of early-type stars (Schmidt-Kaler 1982; Straižys 1992; Cox 2000) show that their slope is not in agreement. The extinction must be increased to to make the observed fluxes consistent with the SED templates, Figure 10. We note that this estimate is made using only the photometric bands (and close related HST bands , , ) because the band is different from the band, the former lying on top of the Balmer jump and the latter being located shortward of the jump. We also studied the variation of the Balmer decrement (Hα/Hβ) in the spectrum of the nebula and we found that MH9, the east side of the nebula (along the slit) shows a higher value compared to MH10 (the west part), i.e., compared to . This suggests differential extinction in the nebula. In addition, the SEDs of several stars located in a small region west of the ULX indicate higher reddening, up to . In the remainder of this paper, we will use our best estimate of the extinction for the ULX, , with the caveat that there may be some variation of the extinction.
3.4 Interpretation of the Color-Magnitude diagrams
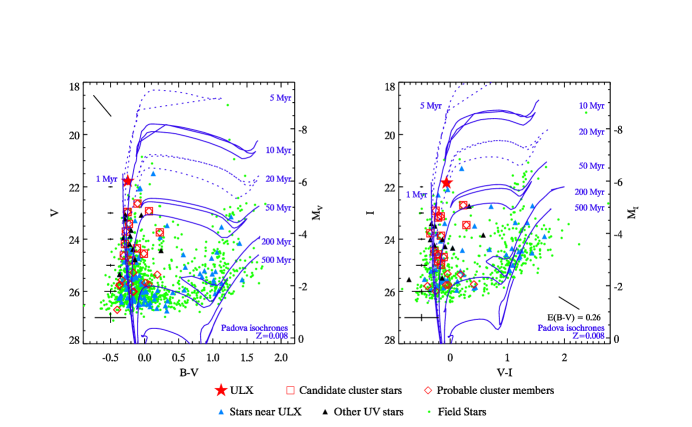
Color-magnitude diagrams in and (Figure 11) show the predominance of a blue main sequence (, ) but also the existence of a giant branch, especially obvious in the diagram, as pointed out by Sabbi et al. (2008) with their observations centered on Holmberg IX. The population of stars apparently associated with the ULX is nicely resolved with HST and we can see 10 members well identified by their positions internal to the nebula. The UV emission as seen in the filter, see Figure 4, provides a further clue to their relatively young age. In our study of NGC 1313 X-2 (G08), comparison with the image allowed us to discriminate between young stars and old field stars in a semi-quantitative manner. Here, the situation is more complex since the dominant population is young, likely because the encounter between M81, M82, and NGC 3077 triggered a wave of star formation within the past 200 Myr. Nevertheless, we can assign the status of “candidates of the association” to all stars visible in the UV image and which are visually in the dense association.
This group of stars does not differ from the other field stars but fits very well in the main sequence defined by the other stars. Figure 11 shows a color-magnitude diagram corrected by the assumed reddening and an extinction based on the Cardelli law (Cardelli et al. 1989). The Padova isochrones (Marigo et al. 2008; Girardi et al. 2010) used are for a metallicity , as derived by Makarova et al. (2002) by spectroscopy of an H II region (region 8 from Miller & Hodge 1994; located from HoIX X-1) and consistent with the dwarf nature of the galaxy. Concerning the age determination, we are facing a situation where most of the stars are located near the 1–20 Myr isochrones on the main sequence. The width of the main sequence, explained by photometric errors and probably some differential reddening, is quite large compared to the separation of the 1–20 Myr isochrones. We note that there are three stars (five if we consider the probable two reddened stars) with an absolute magnitude between -4.5 and -5.0. These stars may be late-O type stars or early-B stars evolving toward the supergiant phase. Thus, the age of this stellar association is uncertain but is most likely younger than 20 Myr.
We note that there is a population of stars in the field that is probably older, old, as seen by the red supergiants at (; , ). There are no such red supergiants associated with the stellar association around the ULX, but as we remarked in G08, the ratio of blue to red supergiants observed in metal-poor galaxies (Langer & Maeder 1995) being would imply only one or two red supergiants in the association which, given the statistics, is not in contradiction.
A previous study done by Ramsey et al. (2006) found an age of 4–6 Myr using the same HST data in the and filters. They in fact assumed that the blue stars in the color-magnitude diagram are reddened () main-sequence O stars. Even though this assumption had no real basis, it seems that our finding, based on a more careful extinction estimate, may be consistent with a close value.
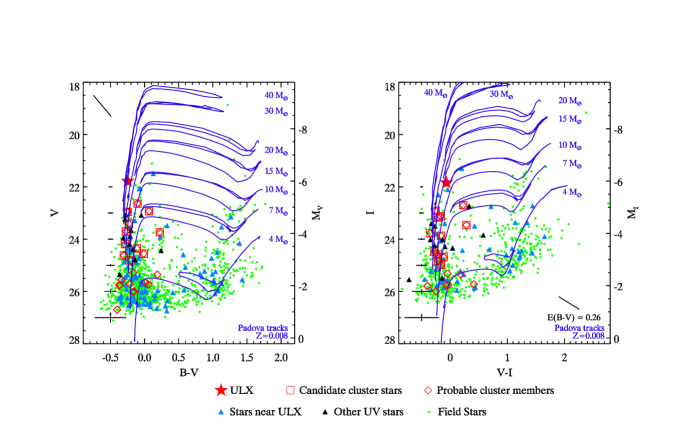
In terms of mass, the Padova evolutionary tracks show that the most luminous stars are compatible with a zero-age mass of the order of 10–20 (Figure 12). We note also that in principle, the band would be more discriminating in terms of age and mass of the stellar population, but unfortunately there is no available observational calibration between the and the more common band (Sirianni et al. 2005). Finally, using a solar metallicity () instead of the sub-solar one assumed here () does not influence our results in any significant manner.
3.5 Properties of the stellar association
The association of stars around HoIX X-1 looks more like an OB association than a cluster linked by gravitation. This is something we also saw in NGC 1313 X-2 (G08). The integrated magnitudes of the stellar association are , and . Comparing these magnitudes with Starburst99 simulations (Leitherer et al. 1999), and assuming that the age of the cluster is 10/20 Myr with a Salpeter initial mass function (IMF) or an “” IMF (with masses between and ), the mass of the cluster is about , which is similar to the association surrounding the ULX of our previous study (G08). This group of stars is clearly typical for OB associations of the Local Group, both in terms of mass and of size, with its diameter of 90 pc (). This isolated star formation is probably linked to the tidal forces between M81 and M82 which have created many stars concentrations, looking like either dwarf galaxies (like Holmberg IX) or less massive associations as recently discovered by de Mello et al. (2008) and Davidge (2008).
4 Nature of the ULX optical counterpart
4.1 Constraints from photometry
We have shown that the stellar population around the ULX has an age of and an individual upper mass limit of . In contrast to the NGC 1313 X-2 (G08), the ULX of our present study has a counterpart brighter than the other stars belonging to the stellar association, by almost 1 mag. If the counterpart is a normal star (as opposed to the case where the accretion disk may play a predominant role in the optical emission), its magnitude would be consistent with an O3–O4 star on the main sequence, a late-O type evolved star, or a late-O/early-B Ib supergiant. Its dereddened color (Table 7) would be consistent with most of those scenarii, but its is somewhat too red to be compatible with such interpretation. Indeed, the counterpart shows a slightly “red” excess (compared to the other stars of the association) since its () color would be more typical of a late-B star on the main-sequence, or a mid supergiant B star. But perhaps the most important feature we see is a significant excess in the UV (compared to the other stars of the association). This can be seen in the color-magnitude diagram () versus , Figure 13, where the ULX counterpart is clearly bluer than any other star of the stellar association. Unfortunately, this diagram is only illustrative of this UV excess since the magnitudes and colors , and () derived from HST/ACS data are not compatible with those used in the available evolutionary tracks and isochrones and thus cannot be used to derive age or mass properties of the stars.
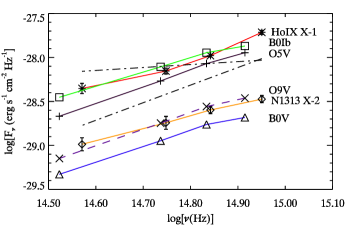
The SED of the ULX counterpart, Figure 14, leads to the same conclusion. Compared to other stars of the association, including the brightest ones in the UV, we can definitely see that the ULX counterpart shows a clear excess in the UV and a slight excess in the red part of the spectrum. In fact, it shows a 3363–4317 slope steeper than a O5 star, pointing to a very hot continuum in the UV. Figure 14 also shows the SED of the ULX NGC 1313 X-2 (G08); NGC 1313 X-2 looks like a normal OB star which is relatively unexpected since we have shown in G08 that the optical variability of the source was likely associated with some X-ray reprocessing in the system. This deserves more detailed study. Interestingly, Kaaret & Corbel (2009) showed that the ULX NGC 5408 X-1 also displays a UV excess at wavelengths shorter than the Balmer edge. They interpret this effect as coming from the accretion disk and the photoionized nebula surrounding the counterpart. In our case, the main nature of the nebula is quite different since it seems to be mainly shock-ionized (Grisé et al. 2006; Abolmasov et al. 2007; Pakull & Grisé 2008), but X-ray/UV photoionization is possibly required to explain all the properties of the ULX nebula (Abolmasov & Moiseev 2008). Also, Roberts et al. (private communication) have shown, using very deep optical spectra of these two ULXs, that NGC 1313 X-2 may display some absorption features coming from the donor star (specifically, a Balmer jump), while HoIX X-1 shows only a very blue continuum consistent with our findings. In any case, the absence of clear absorption lines in both ULXs point to a contribution from the accretion disk, which is probably acting at different levels and/or at different wavelengths in both sources.
The X-ray to optical flux ratio, (e.g., Kaaret 2005), with the 2–10 keV unabsorbed X-ray flux density in and the dereddened magnitude, is . This is consistent with the values found in LMXBs (van Paradijs & McClintock 1995) where the optical emission is dominated by X-rays reprocessing. We remark that if the accretion disk and the secondary star had equal luminosities, subtracting the light from the accretion disk would correct the position of the counterpart to be consistent with a star. Thus, it would simply be as luminous as the brightest stars in the tight association. The UV excess, as in low-mass X-ray binaries (LMXBs), would be due to reprocessed energy radiated in the UV and optical (van Paradijs & McClintock 1995). A key problem in ULXs is that we do not know the spectral type of the companion star.
A few models predicting the optical properties of ULXs have appeared recently in the literature (Rappaport et al. 2005; Copperwheat et al. 2005, 2007; Madhusudhan et al. 2008; Patruno & Zampieri 2008). Although their conclusions are not unanimous, one common result of these studies is that the companion star should be massive enough, , to sustain a stable accretion rate and to allow for X-ray luminosities of . This was also pointed out in Podsiadlowski et al. (2003) where the authors show that steady accretion can be achieved with a donor star of – around a black hole and can lead to X-ray luminosities above during –, respectively. These phases of high X-ray luminosity happen when the donor becomes a giant and the evolution is driven by the nuclear evolution of the hydrogen-burning shell (Podsiadlowski et al. 2003). Observational results also suggest giant companions for some other ULXs (e.g., Liu et al. 2004; Kaaret et al. 2006; Feng & Kaaret 2008; Motch et al. 2010).
The most recent published model predicting the optical output of ULXs (Patruno & Zampieri 2008, 2010) is also the only one that takes into account the fact that not all the mass lost by the donor star is accreted by the black hole. Instead, and especially when the donor star is leaving the main sequence, the rise in the mass transfer rate above the Eddington limit implies that there is substantial mass loss from the binary that does not contribute to the X-ray luminosity and to the reprocessing (Patruno & Zampieri 2008, 2010). One of the main differences with previous models is that accretion disks cannot be very bright in the optical unless the black hole is massive enough and/or the donor star is in the fast expanding giant phase.
If we apply our photometric results to this model, HoIX X-1 is consistent with a – donor around a – black hole undergoing case A(B) mass transfer. The donor is likely to be ascending the giant branch, which would give rise to a larger mass accretion rate and thus, a larger X-ray luminosity. However, this stage is likely to be very short for such a massive star, only a few tens of thousands of years (Patruno & Zampieri 2008). Based on the same arguments applied to NGC 1313 X-2 by Patruno & Zampieri (2010), case B mass transfer is unlikely due to the fact that the ULX is surrounded by a nebula that is old (Pakull & Grisé 2008; Abolmasov & Moiseev 2008). Thus, case AB, where mass transfer starts during the main sequence, is more likely since it allows several millions years (Patruno & Zampieri 2008) to inject the required energy to the nebula. In that framework, our values of magnitude and color do not allow discrimination of the mass of the black hole. Addition of other photometric bands in binary models may help in further constraining the mass of the components. Obtaining a full SED of the ULX from the far-UV to the near-infrared would also be helpful in trying to disentangle the contributions coming from the accretion disk versus the donor star.
From our own results, the firm conclusion that we can draw about the companion star is that it is likely a quite massive star, , when we take its position in the color-magnitude diagrams as those of a non-irradiated star. The same conclusion holds if we take into account a likely contamination of the optical flux by the accretion disk. Unfortunately, applied to the Patruno & Zampieri (2008) model, our results do not favor either the “standard” stellar-mass black hole (–) or the more massive () black hole scenario. However, we showed that the total stellar-mass in the young stellar association around the ULX is . Thus, HoIX X-1 is clearly not in a super-star-cluster. This means that whatever the nature of the compact object, it was not formed via a runaway-coalescence scenario as proposed by Ebisuzaki et al. (2001) and Portegies Zwart & McMillan (2002). If the black hole has a mass of the order of , it was probably formed via a more conventional stellar evolutionary scenario. This may be possible thanks to the sub-solar metallicity of the ULX environment, see Zampieri & Roberts 2009 for such arguments.
4.2 Photometric variability
We have tried to characterize the possible optical variability of the counterpart. We have four SUBARU images in the band, but only two of them have a good enough seeing to separate, via PSF fitting, the luminous counterpart from the fainter object which tends to contaminate the optical emission. In these two images, the counterpart has a constant magnitude within the photometric errors (, ).
On the contrary, the two HST/ACS images in the band show variability, clearly significant at . The amplitude is similar to that of NGC 1313 X-2 (G08). This optical variability may originate from ellipsoidal modulation reflecting the orbital movement of the donor star, like in massive X-ray binaries. It may also come from reprocessing of variable X-ray emission by the accretion disk and X-ray heating of the secondary as observed in LMXBs. A combination of both effects is likely, since the ULX environment is composed of moderately massive stars with , so that the optical emission of the donor is not negligible as in LMXBs, while the ULX X-ray output is 10–100 times that of LMXBs, suggesting a non-negligible optical contribution from reprocessing.
The SUBARU data do not permit a study without ambiguity of the intrinsic variability of the ULX, but the magnitude () from the 2003 January 26 observation is consistent with the range seen by HST. The color is consistent between the two observations of the two telescopes (Tables 3 and 4). We can compare the total magnitude of the counterpart and of the nearby object between the two observatories for all observations (Table 8). The agreement is very good between our SUBARU measurements (where we can resolve the counterpart from its nearby companion) and the HST observations. The second SUBARU observation (2003 January 26) does not allow the measurement of the faint object even if the measured total magnitude () suggests that we only see the ULX counterpart. The conclusion on the variability in the SUBARU observations is thus uncertain because of the photometric contamination by this fainter object. Nonetheless, all values are completely consistent with the luminosity range seen by the HST. We may be seeing similar variability as with the HST, but it is masked by the large uncertainties.
An interesting characteristic of these HST observations is that they were coordinated with two simultaneous Chandra ones. Unfortunately, the observations are highly piled-up preventing a detailed analysis. The derived fluxes suffer from a high uncertainty, with , for the two observations.
The optical variability observed corresponds to an increase of 14% in the optical flux. Considering the errors in the X-ray fluxes, it is obvious that nothing can be said about a possible correlation between the X-ray and optical fluxes. Detailed studies are needed to establish X-ray/optical correlations and it is clear that no conclusion can be drawn from only two data points. But the fact that X-ray and optical variations are seen in other ULXs which do not seem to be entirely related to the orbital movement of the companion star (Grisé et al. 2008, 2009) are a strong motivation for future simultaneous X-ray/optical studies and will help to disentangle the mechanisms at the origin of the X-ray and optical emission.
5 Conclusion
We have used the high sensitivity of SUBARU/FOCAS and GEMIMI/GMOS-N and the high spatial resolution of HST/ACS to make a detailed study of the optical counterpart of the ULX HoIX X-1 and its immediate environment. Close to the ULX, we have highlighted a group of young stars spread out over 100 pc that appears to be an OB association rather than a gravitationally linked cluster. The photometric properties of these stars are consistent with the young population that surrounds them. This tight association is quite isolated, located at 1 kpc from the dense star-forming area of Holmberg IX. This recent and localized episode of star formation is possibly related to the past interaction between M81 and M82, similar to Holmberg IX and other structures formed at H I overdensities. We have estimated that the young stellar association linked to the ULX has an age , a stellar-mass of –3, and an upper mass limit for single stars of about . We have newly estimated the reddening value near the association and found a probable local extinction of in addition to the very modest Galactic reddening of .
The optical counterpart of the ULX was identified by the presence of a broad, high-excitation He II4686 line that testifies to X-ray reprocessing in the system. The counterpart appears to be the most luminous object in the association. Using stellar evolutionary tracks, we have constrained the mass of the companion star to be , even if the accretion disk contributes significantly to the optical luminosity. HoIX X-1 displays a UV photometric excess compared to the surrounding population of stars. Its colors are not consistent with a star, and this prevents any spectral classification of the counterpart. The optical spectrum shows a blue continuum, consistent with the colors, with only high-excitation emission lines, similar to X-ray active LMXBs. Comparison of our photometric results with binary models suggest that the donor star may be as massive as –.
Another interesting result of this work is the variability of the ULX counterpart, by , clearly detected in the HST/ACS data set. However, we have insufficient information to determine if this variability comes from ellipsoidal variations, stochastically variable irradiation of the accretion disk or donor star, or some combination.
Finally, although no stringent constraints can be put on the mass of the black hole from these data, we can, as for the ULX NGC 1313 X-2 (G08), emphasize that the formation of an intermediate-mass black hole () in the environment of HoIX X-1 is very unlikely, given the stellar-mass of the association and its unbound nature. This is consistent with recent X-ray results showing that this source can be modeled by what appears to be super-Eddington emission, hence a small () black hole.
|
|
| Filter | Exposure Time | Number of Exposures | Observation Date | Seeing |
| (s) | () | |||
| 300 | 2 | 2003 Jan 25/26 | 0.73/0.44 | |
| 300 | 4 | 2003 Jan 25/26/26/Feb 09 | 0.73/0.42/0.48/0.43 | |
| 300 | 2 | 2003 Jan 25/26 | 0.73/0.39 | |
| Hα | 900 | 1 | 2003 Jan 26 | 0.51 |
| O III | 900 | 1 | 2003 Jan 26 | 0.53 |
| Spectrum | 1800/900 | 2 | 2003 Jan 26 | 0.5 |
 |
 |
 |
| ID | Instrument | Filter | Date | MJD at Mid-exposure | Exposure Time (s) |
|---|---|---|---|---|---|
| j8ola2010 | HRC | 2004 Feb 7 | 53042.51347 | 2760 | |
| j8ol02040 | WFC | 2004 Feb 7 | 53042.46162 | 2520 | |
| j8ol02030 | WFC | 2004 Feb 7 | 53042.42239 | 1160 | |
| j8ol02010 | WFC | 2004 Feb 7 | 53042.41364 | 1160 | |
| j8ol06010 | WFC | 2004 Mar 25 | 53089.45604 | 2400 |
|
|
| Filter | Exposure Time (s) | Date | Magnitude | Absolute Magnitude |
|---|---|---|---|---|
| 300 | 2003 Jan 26 | 22.72 0.04 | -6.1 | |
| 300 | 2003 Jan 26 | 22.71 0.04 | -5.9 | |
| 300 | 2003 Jan 26 | 22.64 0.02 | -5.8 |
[b] Filter Exposure Time Date Aperture Correction VEGAmag Johnson Magnitude 2760 s 2004 Feb 7 0.790 20.833 0.023 … 2520 s 2004 Feb 7 0.427 22.541 0.015 22.604 1160 s 2004 Feb 7 0.403 22.632 0.024 22.609 1160 s 2004 Feb 7 0.716 22.334 0.034 22.328 2400 s 2004 Mar 25 0.384 22.768 0.013
-
•
Note. Magnitudes are expressed both in the HST/ACS Vegamag system and in the Johnson-Cousins (UBVRI) system, when possible.
| ID | MJD | Exposure Time | Cash Stat./dof | |||
|---|---|---|---|---|---|---|
| Mid-exposure | (ks) | () | ||||
| 4751 | 53042.45496 | 5 | 1.0 | 5.8/9 | ||
| 4752 | 53089.41938 | 5 | 1.0 | 6.6/7 |
| Telescope/Instrument | Right Ascension | Declination |
|---|---|---|
| Chandra | ||
| HST/ACS | ||
| HST/ACS | ||
| HST/ACS | ||
| XMM-Newton |
|
|
[b] Filter/Magnitude Observed Magnitude/Color Dereddened Magnitude/Color 22.604 0.015 21.536 0.015 22.609 0.024 21.780 0.024 22.328 0.034 21.844 0.034 B V -0.005 0.028 -0.247 0.049 – 0.281 0.042 -0.064 0.058
-
•
Note. Values are expressed in the Johnson-Cousins (UBVRI) system.
|
|
|
|
 |
 |

| Telescope | Date | |||
|---|---|---|---|---|
| SUBARU/FOCAS | 2003 Jan 25 | … | … | 22.62 0.02 |
| SUBARU/FOCAS | 2003 Jan 26 | 22.71 0.037 | 24.81 0.26 | 22.56 0.26 |
| SUBARU/FOCAS | 2003 Jan 26 | 22.68 0.015 | … | … |
| SUBARU/FOCAS | 2003 Feb 9 | 22.67 0.025 | 24.49 0.12 | 22.48 0.12 |
| HST/ACS | 2004 Feb 4 | 22.609 0.024 | 24.54 0.03 | 22.44 0.04 |
| HST/ACS | 2004 Mar 25 | 22.745 0.013 | 24.50 0.02 | 22.55 0.02 |
-
•
Note. Magnitudes are expressed in the Johnson-Cousins system ().
This paper is based in part on data collected at SUBARU Telescope, which is operated by the National Astronomical Observatory of Japan and on observations made with the NASA/ESA Hubble Space Telescope, obtained from the data archive at the Space Telescope Institute. STScI is operated by the association of Universities for Research in Astronomy, Inc. under the NASA contract NAS 5-26555. This paper is based also on observations obtained at the Gemini Observatory (acquired through the Gemini Science Archive), which is operated by the Association of Universities for Research in Astronomy, Inc., under a cooperative agreement with the NSF on behalf of the Gemini partnership: the National Science Foundation (United States), the Science and Technology Facilities Council (United Kingdom), the National Research Council (Canada), CONICYT (Chile), the Australian Research Council (Australia), Ministério da Ciência e Tecnologia (Brazil) and Ministerio de Ciencia, Tecnología e Innovación Productiva (Argentina). This research has made use of data obtained from the Chandra Data Archive, and software provided by the Chandra X-ray Center (CXC) in the application packages CIAO (v.4.1.2).
References
- Abolmasov et al. (2007) Abolmasov, P., Fabrika, S., Sholukhova, O., & Afanasiev, V. 2007, Astrophysical Bulletin, 62, 36
- Abolmasov & Moiseev (2008) Abolmasov, P., & Moiseev, A. V. 2008, in Revista Mexicana de Astronomia y Astrofisica, Vol. 44, 301–309
- Adelman-McCarthy et al. (2008) Adelman-McCarthy, J. K., et al. 2008, ApJS, 175, 297
- Arnaud (1996) Arnaud, K. A. 1996, in Astronomical Society of the Pacific Conference Series, Vol. 101, Astronomical Data Analysis Software and Systems V, ed. G. H. Jacoby & J. Barnes, 17–+
- Brouillet et al. (1992) Brouillet, N., Henkel, C., & Baudry, A. 1992, A&A, 262, L5
- Cardelli et al. (1989) Cardelli, J. A., Clayton, G. C., & Mathis, J. S. 1989, ApJ, 345, 245
- Copperwheat et al. (2005) Copperwheat, C., Cropper, M., Soria, R., & Wu, K. 2005, MNRAS, 362, 79
- Copperwheat et al. (2007) —. 2007, MNRAS, 376, 1407
- Cox (2000) Cox, A. N. 2000, Allen’s astrophysical quantities, ed. Cox, A. N.
- Davidge (2008) Davidge, T. J. 2008, PASP, 120, 1145
- Davis (2001) Davis, J. E. 2001, ApJ, 562, 575
- de Mello et al. (2008) de Mello, D. F., Smith, L. J., Sabbi, E., Gallagher, J. S., Mountain, M., & Harbeck, D. R. 2008, AJ, 135, 548
- Ebisuzaki et al. (2001) Ebisuzaki, T., et al. 2001, ApJ, 562, L19
- Fabbiano (1988) Fabbiano, G. 1988, ApJ, 325, 544
- Feng & Kaaret (2008) Feng, H., & Kaaret, P. 2008, ApJ, 675, 1067
- Freedman et al. (1994) Freedman, W. L., et al. 1994, ApJ, 427, 628
- Girardi et al. (2010) Girardi, L., et al. 2010, ApJ, 724, 1030
- Gladstone et al. (2009) Gladstone, J. C., Roberts, T. P., & Done, C. 2009, MNRAS, 397, 1836
- Grisé et al. (2006) Grisé, F., Pakull, M. W., & Motch, C. 2006, in IAU Symposium, Vol. 230, Populations of High Energy Sources in Galaxies, ed. E. J. A. Meurs & G. Fabbiano, 302–303
- Grisé et al. (2009) Grisé, F., Pakull, M. W., Soria, R., & Motch, C. 2009, in American Institute of Physics Conference Series, Vol. 1126, American Institute of Physics Conference Series, ed. J. Rodriguez & P. Ferrando, 201–203
- Grisé et al. (2008) Grisé, F., Pakull, M. W., Soria, R., Motch, C., Smith, I. A., Ryder, S. D., & Böttcher, M. 2008, A&A, 486, 151
- Holmberg et al. (1974) Holmberg, E. B., Lauberts, A., Schuster, H.-E., & West, R. M. 1974, A&AS, 18, 463
- Hook et al. (2004) Hook, I. M., Jørgensen, I., Allington-Smith, J. R., Davies, R. L., Metcalfe, N., Murowinski, R. G., & Crampton, D. 2004, PASP, 116, 425
- Kaaret (2005) Kaaret, P. 2005, ApJ, 629, 233
- Kaaret & Corbel (2009) Kaaret, P., & Corbel, S. 2009, ApJ, 697, 950
- Kaaret & Feng (2009) Kaaret, P., & Feng, H. 2009, ApJ, 702, 1679
- Kaaret et al. (2006) Kaaret, P., Simet, M. G., & Lang, C. C. 2006, ApJ, 646, 174
- Kashikawa et al. (2002) Kashikawa, N., et al. 2002, PASJ, 54, 819
- Koekemoer et al. (2002) Koekemoer, A. M., Fruchter, A. S., Hook, R. N., & Hack, W. 2002, in The 2002 HST Calibration Workshop : Hubble after the Installation of the ACS and the NICMOS Cooling System, ed. S. Arribas, A. Koekemoer, & B. Whitmore, 337–+
- Langer & Maeder (1995) Langer, N., & Maeder, A. 1995, A&A, 295, 685
- Leitherer et al. (1999) Leitherer, C., et al. 1999, ApJS, 123, 3
- Liu et al. (2004) Liu, J., Bregman, J. N., & Seitzer, P. 2004, ApJ, 602, 249
- Madhusudhan et al. (2008) Madhusudhan, N., Rappaport, S., Podsiadlowski, P., & Nelson, L. 2008, ApJ, 688, 1235
- Makarova et al. (2002) Makarova, L. N., et al. 2002, A&A, 396, 473
- Marigo et al. (2008) Marigo, P., Girardi, L., Bressan, A., Groenewegen, M. A. T., Silva, L., & Granato, G. L. 2008, A&A, 482, 883
- Miller (1995) Miller, B. W. 1995, ApJ, 446, L75+
- Miller & Hodge (1994) Miller, B. W., & Hodge, P. 1994, ApJ, 427, 656
- Miller et al. (2004) Miller, J. M., Fabian, A. C., & Miller, M. C. 2004, ApJ, 607, 931
- Motch et al. (2010) Motch, C., Pakull, M. W., Grisé, F., & Soria, R. 2010, ArXiv 1011.4215
- Pakull & Grisé (2008) Pakull, M. W., & Grisé, F. 2008, in American Institute of Physics Conference Series, Vol. 1010, A Population Explosion: The Nature & Evolution of X-ray Binaries in Diverse Environments, ed. R. M. Bandyopadhyay, S. Wachter, D. Gelino, & C. R. Gelino, 303–307
- Pakull et al. (2006) Pakull, M. W., Grisé, F., & Motch, C. 2006, in IAU Symposium, Vol. 230, Populations of High Energy Sources in Galaxies, ed. E. J. A. Meurs & G. Fabbiano, 293–297
- Pakull & Mirioni (2002) Pakull, M. W., & Mirioni, L. 2002, arXiv:0202488
- Pakull & Mirioni (2003) Pakull, M. W., & Mirioni, L. 2003, in Revista Mexicana de Astronomia y Astrofisica Conference Series, Vol. 15, Revista Mexicana de Astronomia y Astrofisica Conference Series, ed. J. Arthur & W. J. Henney, 197–199
- Patruno & Zampieri (2008) Patruno, A., & Zampieri, L. 2008, MNRAS, 386, 543
- Patruno & Zampieri (2010) —. 2010, MNRAS, 403, L69
- Podsiadlowski et al. (2003) Podsiadlowski, P., Rappaport, S., & Han, Z. 2003, MNRAS, 341, 385
- Portegies Zwart & McMillan (2002) Portegies Zwart, S. F., & McMillan, S. L. W. 2002, ApJ, 576, 899
- Ramsey et al. (2006) Ramsey, C. J., Williams, R. M., Gruendl, R. A., Chen, C.-H. R., Chu, Y.-H., & Wang, Q. D. 2006, ApJ, 641, 241
- Rappaport et al. (2005) Rappaport, S. A., Podsiadlowski, P., & Pfahl, E. 2005, MNRAS, 356, 401
- Roberts (2007) Roberts, T. P. 2007, Ap&SS, 311, 203
- Roberts et al. (2010) Roberts, T. P., Gladstone, J. C., Goulding, A. D., Swinbank, A. M., Ward, M. J., Goad, M. R., & Levan, A. J. 2010, ArXiv 1011.2155
- Sabbi et al. (2008) Sabbi, E., Gallagher, J. S., Smith, L. J., de Mello, D. F., & Mountain, M. 2008, ApJ, 676, L113
- Schlegel et al. (1998) Schlegel, D. J., Finkbeiner, D. P., & Davis, M. 1998, ApJ, 500, 525
- Schmidt-Kaler (1982) Schmidt-Kaler, T. 1982, in The Physical Parameters of the Star, ed. K. S. . H. H. Voigt, Vol. 2 (Berlin: Springer-Verlag), 1
- Sirianni et al. (2005) Sirianni, M., et al. 2005, PASP, 117, 1049
- Skrutskie et al. (2006) Skrutskie, M. F., et al. 2006, AJ, 131, 1163
- Stetson et al. (1990) Stetson, P. B., Davis, L. E., & Crabtree, D. R. 1990, in Astronomical Society of the Pacific Conference Series, Vol. 8, CCDs in astronomy, ed. G. H. Jacoby, 289–304
- Straižys (1992) Straižys, V. 1992, Multicolor stellar photometry, ed. Straižys, V., 300, 565
- Tsunoda et al. (2006) Tsunoda, N., Kubota, A., Namiki, M., Sugiho, M., Kawabata, K., & Makishima, K. 2006, PASJ, 58, 1081
- van Paradijs & McClintock (1995) van Paradijs, J., & McClintock, J. E. 1995, Optical and ultraviolet observations of X-ray binaries., ed. W. H. G. Lewin, J. van Paradijs, & E. P. J. van den Heuvel (Cambridge Univ. Press), 58–125
- Vierdayanti et al. (2010) Vierdayanti, K., Done, C., Roberts, T. P., & Mineshige, S. 2010, MNRAS, 403, 1206
- Watson et al. (2009) Watson, M. G., et al. 2009, A&A, 493, 339
- Yun et al. (1994) Yun, M. S., Ho, P. T. P., & Lo, K. Y. 1994, Nature, 372, 530
- Zampieri & Roberts (2009) Zampieri, L., & Roberts, T. P. 2009, MNRAS, 400, 677