Enhanced [CII] emission in a =4.76 submillimetre galaxy
We present the detection of bright [CII] emission in the =4.76 submillimetre galaxy LESS J033229.4-275619 using the Atacama Pathfinder EXperiment. This represents the highest redshift [CII] detection in a submm selected, star-formation dominated system. The AGN contributions to the [CII] and far-infrared (FIR) luminosities are small. We find an atomic mass derived from [CII] comparable to the molecular mass derived from CO. The ratio of the [CII], CO and FIR luminosities imply a radiation field strength 103 and a density 104 cm-3 in a kpc-scale starburst, as seen in local and high redshift starbursts. The high =2.410-3 and the very high 104 are reminiscent of low metallicity dwarf galaxies, suggesting that the highest redshift star-forming galaxies may also be characterised by lower metallicities. We discuss the implications of a reduced metallicity on studies of the gas reservoirs, and conclude that especially at very high redshift, [CII] may be a more powerful and reliable tracer of the interstellar matter than CO.
Key Words.:
galaxies: high-redshift – galaxies: ISM – submillimetre – infrared: galaxies1 Introduction
Blank field submillimetre (submm) surveys have uncovered a population of distant galaxies undergoing a major epoch of star formation. To date, hundreds of these submm galaxies (SMGs) are known (e.g. Coppin et al., 2006; Weiß et al., 2009). However, we only have basic knowledge of the star formation process in SMGs, and how it compares with star formation regions in the local universe. The most obvious tracer of the cold molecular gas from which stars form is CO, which has been extensively observed in SMGs (e.g. Greve et al., 2005; Tacconi et al., 2006), and has now also been detected in other high redshift galaxies (e.g. Daddi et al., 2009; Tacconi et al., 2010). These CO observations have shown that SMGs are gas rich systems (M⊙), providing sufficient fuel to sustain massive star formation rates exceeding 1000 M⊙yr-1. While the CO lines offers numerous advantages, notably their brightness allowing their emission to be spatially resolved (e.g. Tacconi et al., 2008), there are also some complications. First, there are uncertainties of a factor five in the CO to H2 conversion factor , especially when integrated over an entire galaxy where significant variations in are expected (Shetty et al., 2011). Second, the derived gas masses depend on the excitation conditions, and a well sampled CO spectral line energy distribution is required to determine the full distribution of temperature and density components (e.g. Weiß et al., 2007; Danielson et al., 2011). Third, significant dust optical depth effects (Papadopoulos et al., 2010) may suppress the high excitation lines, while contributions from shock excitation (Papadopoulos et al., 2008) may boost them.
The [CII] 157.74 m line has recently emerged as a powerful alternative line to study the interstellar medium in high redshift objects. It arises from photodissociation regions (PDRs) associated with star-forming regions and is the dominant cooling line, representing up to 1% of the total luminosity (e.g. Crawford et al., 1985; Stacey et al., 1991). The [CII] line is nearly always optically thin, though it may also be attenuated by dust extinction. [CII] detections have now been reported in five objects (Maiolino et al., 2005; Iono et al., 2006; Maiolino et al., 2009; Wagg et al., 2010; Ivison et al., 2010), and 12 galaxies at (Hailey-Dunsheath et al., 2010; Stacey et al., 2010). The first high-redshift [CII] observations seemed to confirm the trend seen in local galaxies, where the ratio of [CII] and far-infrared (FIR) luminosity is lower by about an order of magnitude for sources with L⊙ (Luhman et al., 1998, 2003). However, subsequent observations revealed that about half of high redshift [CII] lines have equal relative brightness than nearby normal galaxies. Recently, Graciá-Carpio et al. (2011) showed that 1 and local galaxies overlap when using ratio instead of as a proxy for , probably because is more closely related to the properties of the clouds than alone. The improved [CII] statistics also allowed Stacey et al. (2010) to conclude that starburst dominated systems have similar than local normal galaxies, while AGN dominated systems have lower ratios like those in local ultra-luminous infrared galaxies (ULIRGs). Both classes imply kpc-size emitting regions, but the AGN-dominated sources appear to have 8 times more intense far-UV radiation fields, which Stacey et al. (2010) speculate results from an AGN-triggered population of very young stars. Maiolino et al. (2009) suggested that lower metallicities may explain the increased relative [CII] brightness in the highest redshift sources compared to similarly bright FIR sources in the local universe.
Clearly, the presence of an AGN complicates the determination of the physical conditions in the star-forming regions of their host galaxies, as the AGN may contribute to both the FIR continuum and [CII]. AGNs may also enrich the ISM with metals (e.g. Juarez et al., 2009), which would complicate studying the impact of metallicity in SMGs. In a recent Herschel study, Santini et al. (2010) found that 12 SMGs have higher dust masses than local ULIRGs, while their derived gas metallicities are lower. It is as yet unclear if this apparent discrepancy continues to the highest redshift SMGs, who are expected to have lower metallicities. In this letter, we present [CII] observations of LESS J033229.4-275619 at =4.755 (hereinafter LESS J033229.4; Coppin et al., 2009). After AzTEC-3 (=5.298; Riechers et al., 2010; Capak et al., 2011), this is the most distant SMG currently known. We detect bright [CII] emission and show it to be consistent with an extended starburst region, and having close characteristics to local sub-solar metallicity regions. Throughout, we assume , , and . We define the far-IR luminosity as integrated over 42.5-122.5 m, to allow an easy comparison with Hailey-Dunsheath et al. (2010) and Stacey et al. (2010).
2 Observations and Results
LESS J033229.4 was observed with the Swedish Heterodyne Facility Instrument (SHFI; Vassilev et al., 2008) on the Atacama Pathfinder EXperiment (APEX111APEX is a collaboration between the Max-Planck-Institut fur Radioastronomie, the European Southern Observatory, and the Onsala Space Observatory.; Güsten et al., 2006) 12 m telescope in six observing runs, from 2010 April 16 to August 24 (run ID 085.A-0584(A)), for a total of 14.5 h of observations, including sky observations, calibrations and overheads. The weather conditions were generally very good with precipitable water vapour 0.4PWV1.0 mm. We used the APEX-2 receiver tuned to 330.242937 GHz (in lower sideband), which is the expected frequency of the [CII]157.741 m line at the redshift z=4.762 provided by the CO(2-1) detection (Coppin et al., 2010). The two units of the Fast Fourier Transfer Spectrometer (FFTS) backend were offset by 200 km s-1 to increase the velocity coverage. However, as the line was well centred at the expected position, we discarded the outer 200 km s-1 covered only by a single FFTS as we found them to be noisier and dominated by baseline subtraction effects. Observations were done in wobbler-switching mode, with a symmetrical azimuthal throw of 20″ and a frequency of 0.5 Hz. Pointing was checked on the nearby source R-For every 1 h and found to be better than 3″ (with a beam size of 20″). The focus was checked on the available planets, especially after sunrise when the telescope deformations are largest.
The data were analyzed by using CLASS (within the GILDAS-IRAM package), following the procedures described by Maiolino et al. (2009). In short, we determined the noise in the individual spectra using a zero order baseline, and removed the noisiest 20%. We subtracted a first order baseline to the combined spectrum by interpolating the channels in the line-free velocity ranges 850600 km s-1 and 25050 km s-1. The final spectrum includes a total of 2.5 h on-source integration time.
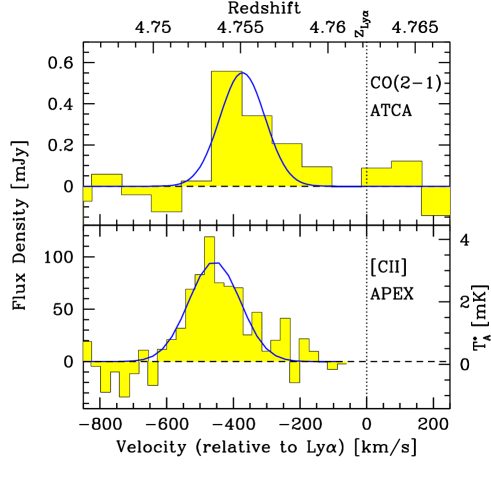
Figure 1 shows the resulting spectrum. The [CII] line is detected at the 7.6 level. The significance of our detection is further strengthened by the correspondence in line width with the CO(2-1) detection. Table 1 compares the redshifts of the Ly, [OII], CO(2-1) and [CII] lines, derived from single Gaussian fits. The [CII] is offset by 8874 km s-1, 130280 km s-1 and 470120 km s-1 from CO(2-1), [OII] and Ly, respectively. The red velocity offset of the Ly line has been observed in many high redshift objects (e.g. Steidel et al., 2010), and can be explained by HI absorption in the interstellar medium surrounding the galaxy. The other 3 lines are more likely to trace the systemic redshift. Because (i) the velocity offset between [CII] and CO is only 1.2, and (ii) none of the 1 [CII] detections show significant offsets, we ascribe the offset in LESS J033229.4 to the poor S/N of the CO data rather than to a real physical velocity offset between the [CII] and CO emitting regions.
| Parameter | Value | Reference |
|---|---|---|
| 4.7620.002 | Coppin et al. (2009) | |
| 4.7510.005 | Alaghband-Zadeh et al., in prep. | |
| 4.7550.001 | Coppin et al. (2010) | |
| 4.75340.0009 | this paper | |
| 16065 km s-1 | Coppin et al. (2010) | |
| 16145 km s-1 | this paper | |
| 0.090.02 Jy km s-1 | Coppin et al. (2010) | |
| 14.72.2 Jy km s-1 | this paper | |
| L⊙ | this paper | |
| L⊙ | Coppin et al. (2010) | |
| L⊙ | Coppin et al. (2009) |
†Converted using (Stacey et al., 2010).
3 Discussion
The [CII] emission from LESS J033229.4 is among the brightest observed at 2, in particular when compared to the CO emission. The observed =2.410-3 is similar to local normal galaxies rather than local ULIRGs. Even when considering222We use the =1.61010 M⊙ from Coppin et al. (2010), derived using =0.8 . =260, LESS J033229.4 still falls well above the relation defined by local and high redshift objects (Figure 1 of Graciá-Carpio et al., 2011). We now use the CO, [CII] and FIR luminosities to examine the physical conditions of the ISM in LESS J033229.4 and try to explain the bright [CII] emission relative to other populations at both low and high redshift.
The versus diagram is a particularly powerful tool as the two ratios are sensitive to gas density and the incident far-ultraviolet (FUV; 6 eV13.6 eV) flux (Stacey et al., 1991; Hailey-Dunsheath et al., 2010). Figure 2 compares LESS J033229.4 with other objects and the solar metallicity PDR model curves of Kaufman et al. (1999). This diagram can be used to roughly distinguish both the and appropriate for a source, but with some important caveats. First, the CO luminosity is expressed in terms of the ground-state transition of CO, while for LESS J033229.4 and BRI 13350417333The [CII] detection of this source was published after Stacey et al. (2010); we add the data of this target to Figure 2., only the (2-1) transition has been observed. For consistency with Stacey et al. (2010), we assume =7.2 (90% of the thermalised, optically thick value) to calculate the . Second, Figure 2 assumes that the contributions to the [CII] flux from the diffuse ionised medium and from cosmic rays (CR) heated gas are small compared to the ones from PDRs. Using PDR models, Meijerink et al. (2011) predict that the C0 and C+ abundances increase rapidly with the CR rates, especially when compared to CO. If the CR rate is related to the star formation rate (Papadopoulos, 2010), this should thus be reflected in a higher [CII]/CO ratio, while powerful starbursts have similar ratios than normal galaxies (see Fig. 2). Any contribution from CR ionisation therefore does not appear to dominate the [CII]/CO ratio. Third, we assume that the AGN does not contribute significantly to the FIR and [CII] luminosity. LESS J033229.4 does contain a moderate luminosity AGN, revealed by (i) ultra-deep X-ray spectroscopy revealing a Compton-thick AGN (Gilli et al., 2011), and (ii) the detection of [NV] 1240Å emission (Coppin et al., 2009). From their SED fitting, Gilli et al. (2011) derive an AGN bolometric luminosity of 7 erg s-1, which represents between 20 and 30% of the total luminosity derived between 8 and 1000 m (and probably lower if the real has been underestimated). It is therefore safe to assume that the FIR emission in LESS J033229.4 is starburst dominated. The [CII] emission could also contain a contribution from the AGN through the X-ray Dominated Regions (XDRs) in the molecular torus surrounding the AGN. Stacey et al. (2010) estimate the XDR contributions using a scaling relation =2. Using the intrisic (de-absorbed) rest-frame 2-10 keV luminosity 2.5 erg s-1 (Gilli et al., 2011), we find that the predicted XDR contribution is 1.3% of the observed [CII] lumonisity.
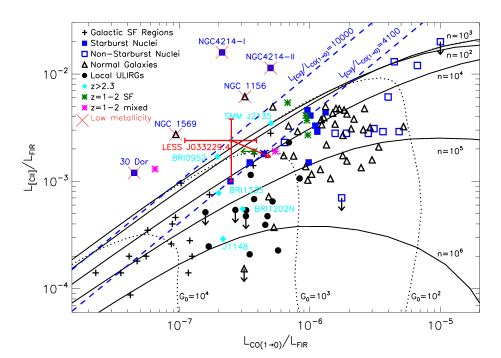
In our PDR model analysis444We used the PDR toolbox code at http://dustem.astro.umd.edu/, we multiply the CO flux by a factor of two to correct for geometry effects, and scale the [CII] flux by a factor 0.7 to remove non-PDR contributions (shown by a vector in Fig. 2; Hailey-Dunsheath et al., 2010). The geometry correction applies to all external galaxies where the FUV illumination comes from all sides, so this will not impact the relative position of LESS J033229.4 compared to other galaxies. We derive cm-3 and . Such a FUV field is on the high end of those seen in low redshift normal galaxies, and both nearby and 12 starforming galaxies. However, it is significantly less intense than observed in Galactic OB star forming regions, three 4 AGNs, and local ULIRGs (though the latter may also be influenced by dust-bounded HII regions; Abel et al., 2009; Graciá-Carpio et al., 2011). The uncertainties on the [CII]/FIR and CO/FIR ratios are large, but they are dominated by the uncertainty in , which may be 1.5 times higher (Coppin et al., 2009). Such an increase in would shift the LESS J033229.4 point to the lower left, along the line of constant =104. Similarly, an (unlikely) higher AGN contribution to would shift the point to the top right. Neither shift would change or to a level that would change our conclusions. Our results are thus broadly consistent with the findings of Stacey et al. (2010) who concluded that AGN dominated systems have 8 times higher FUV radiation fields than starburst dominated systems. The cm-3 and imply a PDR surface temperature of 300 K (Kaufman et al., 1999). Using formula 1 of Hailey-Dunsheath et al. (2010), we estimate the atomic mass associated with the C+ region =1.00.3 M⊙, i.e. similar to the =1.60.3 M⊙ (Coppin et al., 2010).
The very high 104 places LESS J033229.4 near the upper envelope of the solar metallicity plane-parallel slab PDR models in Figure 2. Only spherical PDR models can explain ratios, in particular when the metallicity in reduced (e.g. Bolatto et al., 1999; Röllig et al., 2006). Observational evidence is also building up that the high [CII]/CO region contains mainly low metallicity systems, where the [CII] is enhanced relative to CO and the FIR dust continuum. Extreme ratios up to 7104 have only been observed in low metallicity dwarf galaxies (e.g. Madden, 2000), and recently in star-forming regions of the low metallicity irregular galaxy NGC 4214 (see Fig. 2; Cormier et al., 2010). These high [CII]/CO ratios have been explained by the reduced dust abundance in low metallicity environments, which increases the mean free path of the FUV photons. This will not only decrease the FIR intensity and size of the CO cores, but also increase the size of the [CII] emitting regions as the photodissociating photons traverse a larger volume of the molecular cloud. This extended [CII] region may also contain self-shielded H2, which can boost the CO-to-H2 conversion factor by up to 100 times as seen in IC10 which has 1/5 solar metallicity (Madden et al., 1997). The total gas mass based only on CO observations may thus be substantially underestimated in these low metallicity systems. In contrast, the atomic gas mass derived from the [CII] line only scales linearly with the abundance, and is less affected. While the ratio in LESS J033229.4 is not as extreme as in dwarf galaxies, such high ratios are still only observed in low metallicity environments. We therefore propose low metallicity as a natural explanation also in LESS J033229.4. It is also remarkable that three of the six 2 [CII] detections have similarly high (Fig. 2), including BRI 09520115555The lensing amplification in BRI 09520115 also implies a less luminous AGN, which may explain why BRI 09520115 is closer to the starburst rather than AGN dominated systems in Fig. 2. where Maiolino et al. (2009) already proposed low metallicity as an explanation for the large ratio. Unfortunately, we do not have independent measurements of the global metallicity in LESS J033229.4 or any of the high- objects with [CII] detections, though lower gas metallicities have indeed been observed in 3 star forming galaxies (Maiolino et al., 2008). If, as expected, the highest redshift galaxies indeed have lower metallicities, their longer FUV mean free path lengths imply that for a constant FUV flux and density, the will be lower due to an increased geometrical dilution of the FIR flux (Israel & Maloney, 2011). The [CII]/FIR ratio will thus also increase (Fig. 2). We conclude that [CII] rather than CO should be the prime tracer of the ISM in the highest redshift (non AGN-dominated) galaxies, because [CII] will not only be brighter, but also provides a more reliable determination of the total gas mass.
The high redshift star-formation dominated objects have similar fields than local star forming regions (Fig. 2), but much higher FIR luminosities. So the former appear to be scaled up versions of local starbursts. As the FUV emission is absorbed by the dust in the molecular clouds, and re-radiated in the FIR, the extent of the emitting region for a given will increase for smaller . Stacey et al. (2010) use two scaling laws from Wolfire et al. (1990) to constrain this size: if the mean free path of a FUV photon is very small and if the mean free path is very large. Applied to LESS J033229.4, and assuming 103, this yields a physical size =1.6–3.7 kpc. As argued above, in low metallicity environments, the larger FUV mean free path approximation would be more appropriate, so the actual value is probably at the higher end of this range. This scale size is remarkably similar to the 4 kpc full width half maximum of the stellar population derived from band imaging (Coppin et al., 2010), and shows that the starburst in LESS J033229.4 is affecting the entire galaxy. Such kpc-scale starburst have been found by several authors (e.g. Biggs & Ivison, 2008; Carilli et al., 2010), with individual components as small as 100 pc (Swinbank et al., 2010), and sometimes part of a merging system separated by a few kpc (Tacconi et al., 2008). However, the presence of a compact AGN, and differential lensing amplification of these different regions has complicated the interpretation. High spatial resolution [CII] and FIR observations of unlensed starburst dominated systems with the Atacama Large Millimeter and submillimeter Array will provide a major progress in this field.
4 Conclusions
We have detected bright [CII] emission in a =4.76 SMG, where the AGN contributes little the FIR and [CII] luminosities. We find an atomic mass derived from [CII] comparable to the molecular mass derived from CO. By similarity to local dwarf galaxies, the high 104 ratio suggests a low metallicity in the highest redshift star-forming galaxies. The enhanced [CII] suggests that, as long as the AGN contribution is small, the [CII] line may be the most powerful and reliable tracer of the ISM.
Acknowledgements.
We thank the anonymous referee for useful comments which have improved the paper, and the APEX/ESO staff for their expert help with the observations. KC acknowledges support from the the endowment of the Lorne Trottier Chair in Astrophysics and Cosmology at McGill, the National Science and Engineering Research Council of Canada, and the Centre of Research in Astrophysics of Québec for a fellowship.References
- Abel et al. (2009) Abel, N., Dudley, C., Fischer, J., Satyapal, S., & van Hoof, P. 2009, ApJ, 701, 1147
- Biggs & Ivison (2008) Biggs, A. D., & Ivison, R. J. 2008, MNRAS, 385, 893
- Bolatto et al. (1999) Bolatto, A., Jackson, J., & Ingalls, J. 1999, ApJ, 513, 275
- Capak et al. (2011) Capak, P. L., et al. 2011, Nature, 470, 233
- Carilli et al. (2010) Carilli, C. L., et al. 2010, ApJ, 714, 1407
- Coppin et al. (2006) Coppin, K., et al. 2006, MNRAS, 372, 1621
- Coppin et al. (2009) Coppin, K. E. K., et al. 2009, MNRAS, 395, 1905
- Coppin et al. (2010) Coppin, K. E. K., et al. 2010, MNRAS, 407, L103
- Cormier et al. (2010) Cormier, D., et al. 2010, A&A, 518, L57
- Crawford et al. (1985) Crawford, M., Genzel, R., Townes, C., & Watson, D. 1985, ApJ, 291, 755
- Daddi et al. (2009) Daddi, E., et al. 2009, ApJ, 694, 1517
- Danielson et al. (2011) Danielson, A. L. R., et al. 2011, MNRAS, 410, 1687
- Gilli et al. (2011) Gilli, R., et al. 2011, arXiv:1102.4714
- Graciá-Carpio et al. (2011) Graciá-Carpio, J., et al. 2011, ApJ, 728, L7
- Greve et al. (2005) Greve, T. R., et al. 2005, MNRAS, 359, 1165
- Güsten et al. (2006) Güsten, R., et al. 2006, Proc. SPIE, 6267,
- Hailey-Dunsheath et al. (2010) Hailey-Dunsheath, S., Nikola, T., Stacey, G. J., et al. 2010, ApJ, 714, L162
- Iono et al. (2006) Iono, D., et al. 2006, ApJ, 645, L97
- Israel & Maloney (2011) Israel, F. P., & Maloney, P. R., 2011, A&A, in press, arXiv:1104.2047
- Ivison et al. (2010) Ivison, R. J., et al. 2010, A&A, 518, L35
- Juarez et al. (2009) Juarez, Y., Maiolino, R., Mujica, R., et al. 2009, A&A, 494, L25
- Kaufman et al. (1999) Kaufman, M., Wolfire, M., Hollenbach, D., & Luhman, M. 1999, ApJ, 527, 795
- Luhman et al. (1998) Luhman, M. L., et al. 1998, ApJ, 504, L11
- Luhman et al. (2003) Luhman, M. L., Satyapal, S., Fischer, J., et al. 2003, ApJ, 594, 758
- Madden et al. (1997) Madden, S., Poglitsch, A., Geis, N., Stacey, G., & Townes, C. 1997, ApJ, 483, 200
- Madden (2000) Madden, S. C. 2000, New A Rev., 44, 249
- Maiolino et al. (2005) Maiolino, R., et al. 2005, A&A, 440, L51
- Maiolino et al. (2008) Maiolino, R., et al. 2008, A&A, 488, 463
- Maiolino et al. (2009) Maiolino, R., Caselli, P., Nagao, T., et al. 2009, A&A, 500, L1
- Meijerink et al. (2011) Meijerink, R., Spaans, M., Loenen, A., & van der Werf, P. 2011, A&A, 525, A119
- Papadopoulos et al. (2008) Papadopoulos, P., Kovacs, A., Evans, A. S., & Barthel, P. 2008, A&A, 491, 483
- Papadopoulos et al. (2010) Papadopoulos, P., van der Werf, P., Isaak, K., & Xilouris, E. 2010, ApJ, 715, 775
- Papadopoulos (2010) Papadopoulos, P. P. 2010, ApJ, 720, 226
- Riechers et al. (2008) Riechers, D., Walter, F., Carilli, C., Bertoldi, F., & Momjian, E. 2008, ApJ, 686, L9
- Riechers et al. (2010) Riechers, D. A., et al. 2010, ApJ, 720, L131
- Röllig et al. (2006) Röllig, M., Ossenkopf, V., Jeyakumar, S., Stutzki, J., & Sternberg, A. 2006, A&A, 451, 917
- Santini et al. (2010) Santini, P., et al. 2010, A&A, 518, L154
- Shetty et al. (2011) Shetty, R., Glover, S. C., Dullemond, C. P., & Klessen, R. S. 2011, MNRAS, 11
- Stacey et al. (1991) Stacey, G. J., Geis, N., Genzel, R., et al. 1991, ApJ, 373, 423
- Stacey et al. (2010) Stacey, G., Hailey-Dunsheath, S., Ferkinhoff, C., Nikola, T., et al. 2010, ApJ, 724, 957
- Steidel et al. (2010) Steidel, C. C., Erb, D. K., Shapley, A. E., et al. 2010, ApJ, 717, 289
- Swinbank et al. (2010) Swinbank, A. M., et al. 2010, Nature, 464, 733
- Tacconi et al. (2006) Tacconi, L. J., et al. 2006, ApJ, 640, 228
- Tacconi et al. (2008) Tacconi, L. J., et al. 2008, ApJ, 680, 246
- Tacconi et al. (2010) Tacconi, L. J., et al. 2010, Nature, 463, 781
- Vassilev et al. (2008) Vassilev, V., et al. 2008, A&A, 490, 1157
- Wagg et al. (2010) Wagg, J., Carilli, C. L., Wilner, D. J., et al. 2010, A&A, 519, L1
- Weiß et al. (2007) Weiß, A., Downes, D., Neri, R., et al. 2007, A&A, 467, 955
- Weiß et al. (2009) Weiß, A., et al. 2009, ApJ, 707, 1201
- Wolfire et al. (1990) Wolfire, M. G., Tielens, A. G. G. M., & Hollenbach, D. 1990, ApJ, 358, 116