The 2010 May Flaring Episode of Cygnus X-3 in Radio, X-Rays, and -Rays
Abstract
In 2009, Cygnus X-3 (catalog ) (Cyg X-3) became the first microquasar to be detected in the GeV -ray regime, via the satellites Fermi and AGILE. The addition of this new band to the observational toolbox holds promise for building a more detailed understanding of the relativistic jets of this and other systems. We present a rich dataset of radio, hard and soft X-ray, and -ray observations of Cyg X-3 (catalog ) made during a flaring episode in 2010 May. We detect a 3-d softening and recovery of the X-ray emission, followed almost immediately by a 1-Jy radio flare at 15 GHz, followed by a 4.3 -ray flare (E 100 MeV) 1.5 d later. The radio sampling is sparse, but we use archival data to argue that it is unlikely the -ray flare was followed by any significant unobserved radio flares. In this case, the sequencing of the observed events is difficult to explain in a model in which the -ray emission is due to inverse Compton scattering of the companion star’s radiation field. Our observations suggest that other mechanisms may also be responsible for -ray emission from Cyg X-3 (catalog ).
Subject headings:
black hole physics — X-rays: binaries — X-rays: individual (Cygnus X-3)1. Introduction
The X-ray binary (XRB) system Cygnus X-3 (catalog ) (hereafter Cyg X-3 (catalog )), discovered by Giacconi et al. (1967), is notable for its Wolf-Rayet (WR) companion (van Kerkwijk et al., 1996), short (4.8 h) orbital period (Bonnet-Bidaud & Chardin, 1988), and dramatic radio variability (Waltman et al., 1994). The relativistic jets that it produces (Geldzahler et al., 1983) classify the source as a “microquasar” system. The distance to Cyg X-3 (catalog ) is 7 or 9 kpc, depending on the method used (Predehl et al., 2000; Ling et al., 2009). It is also uncertain whether the compact object is a black hole (e.g. Cherepashchuk & Moffat, 1994) or neutron star (e.g. Stark & Saia, 2003).
Cyg X-3 (catalog ) became more notable in 2009 when it became the first microquasar to be detected in the GeV -ray regime, via the satellites Fermi (Abdo et al., 2009) and AGILE (Tavani et al., 2009). A 4.8-h modulation in the Fermi data makes the detection definitive. Emission of -rays has been detected by both observatories during every “high/soft” X-ray state to occur since they began science operations (Abdo et al., 2009; Tavani et al., 2009; Corbel & Hays, 2010; §3). The high/soft state is also associated with radio flaring and is closely tied to the launching of relativistic jets (e.g. Fender et al., 2004; Koljonen et al., 2010).
Various physical processes are expected to be involved in the emission and propagation of high-energy photons in Cyg X-3 (catalog ). Inverse Compton (IC) upscattering of the intense (105 erg cm-3) radiation field of the WR companion by high-energy () electrons in the relativistic jet is the most efficient source of GeV emission (Abdo et al., 2009; Dubus et al., 2010). If the density of relativistic protons in the jet is sufficiently high, inelastic collisions between these and protons in the stellar wind will produce neutral pions that decay into -rays (among other products) as well (Romero et al., 2003). In this case, there will be further -ray emission due to secondary leptons created during the hadronic interactions (Orellana et al., 2007). The typical hadronic content of microquasar jets is unknown: large numbers of hadrons impose significant energetic constraints, but there is direct evidence of their presence in at least one system, SS 433 (catalog ) (Kotani et al., 1994, 1996; Migliari et al., 2002).
A -ray flare due to IC upscattering by jet electrons will be followed by a radio flare a few days later as those electrons cool, rarify, and become transparent to their radio synchrotron emission. This phenomenon has been observed repeatedly but not invariably (Abdo et al., 2009; Tavani et al., 2009). If the -ray emission is primarily hadronic, the result will be substantially the same, as secondary processes will create a similar population of energetic leptons. Abdo et al. (2009) determine an approximate d lag between radio and -ray emission. Inspection of their Fig. 2 and the data presented by Tavani et al. (2009) suggests that this uncertainty is primarily systematic rather than statistical; i.e., that the radio/-ray lag varies significantly from event to event. Blazar observations often show lag variability, both between sources and in the same source over time, with theoretical support for sign changes in the lag between -ray and other bands (Aller et al., 2010).
In 2010 May, multiple monitoring programs detected that Cyg X-3 (catalog ) was becoming more active in -rays and was entering the high/soft state (Bulgarelli et al., 2010; Corbel & Fermi Large Area Telescope Collaboration, 2010; Kawai et al., 2010; Corbel & Hays, 2010). We describe multiband observations of Cyg X-3 (catalog ) made during this episode (§2) and present our results (§3). Our data show a -ray flare apparently lagging a radio flare, a sequencing opposite of that expected in the typical interpretation. We discuss and interpret this result (§4) and, finally, present our conclusions (§5).
2. Observations & Data Analysis
We observed Cyg X-3 (catalog ) during its 2010 May flaring episode with a variety of instruments. Below, we describe the observations and their analysis. Many dates and times we mention are near MJD 55,340. For brevity, we express these in an offset MJD, defining . Thus OJD 0 is JD 2,455,300.5 or 2010 Apr 14.0 UT, and the -ray flare was detected on OJD 43 = 2010 May 27 UT.
2.1. Radio
The Arcminute Microkelvin Imager (AMI) arrays (Cambridge, UK) are two aperture synthesis telescopes mainly used to study the cosmic microwave background (Zwart et al., 2008). The observations described herein were made with the Large Array (AMI-LA), the reconfigured and reequipped Ryle Telescope, consisting of eight 13-m antennas with a maximum baseline of about 120 m, observing in the band 12–18 GHz. The angular resolution is typically 25″. Monitoring of small-diameter sources is undertaken as described in Pooley & Fender (1997); observations are interleaved with those of a phase-reference calibrator, and after calibration the data for individual baselines are vector-averaged. The in-phase component then provides an unbiased estimate of the target source’s flux density. The amplitude scale was calibrated by (at least) daily observations of 3C 48 and 3C 286, both of which are believed to be very nearly constant on long timescales.
Should there be emission on a scale resolved by some of the baselines, the flux density estimate would be incorrect. There is an extended region of low-brightness emission around Cyg X-3 (catalog ) (Sánchez-Sutil et al., 2008) which is detected on the shortest baselines at extreme hour angles with the AMI-LA, and is sufficiently bright to need separate treatment when the central source in Cyg X-3 (catalog ) is “quenched” (flux density 10 mJy at 15 GHz). No such correction was required in the observations described here.
Observations of Cyg X-3 (catalog ) were also made with the RATAN-600 telescope (Nizhnij Arkhyz, Russia) as part of an ongoing microquasar monitoring campaign (Trushkin, 2000; Trushkin et al., 2006). The observations and data analysis were performed as described in Trushkin et al. (2006). In this work we show results at 11.2 GHz; near-simultaneous observations were made at 4.8 and 7.7 GHz as well.
Cyg X-3 (catalog ) was observed by the Allen Telescope Array (ATA; Northern California, USA; Welch et al., 2009) six times in the period OJD 26–43 as part of a larger transient search. Continuum images at 3.09 GHz were made after subtraction of model of the static sky. Source fluxes were determined in 10-minute segments by fitting point source models in the image domain.
2.2. X-Ray
Our study includes hard X-ray observations made with the International Gamma-Ray Astrophysics Laboratory (INTEGRAL) satellite (Winkler et al., 2003). We used the INTEGRAL Soft Gamma-Ray Imager (ISGRI; Lebrun et al., 2003) instrument and included two observations that were part of a program to observe Cyg X-1 (catalog ) (PI: Wilms). Although the primary target of the observations was Cyg X-1 (catalog ), the ISGRI FOV is large enough to include the entire Cygnus region, and our target was in the FOV throughout the observations. The first observation occurred during revolution 929, starting at OJD 40.625 and ending at OJD 41.940. The second observation occurred during revolution 938, starting at OJD 67.469 and ending at OJD 68.805. A preliminary report of the first observation was given in Tomsick et al. (2010).
We reduced the ISGRI data using the Off-line Scientific Analysis (OSA v9.0) software package. The program ibis_science_analysis is the primary tool for extracting the standard data products. We produced and inspected the ISGRI image in the 20–40 keV band, and then made energy spectra and light curves for all of the bright sources in the field. After correcting for instrumental deadtime, the total exposure times for Cyg X-3 (catalog ) from the first and second observations are 62,420 s and 66,540 s, respectively. We produced 20–40 keV light curves with a time resolution of 1 ks.
We also obtained one-day average quick-look measurements from the All-Sky Monitor on the Rossi X-Ray Timing Explorer (RXTE/ASM; Levine et al., 1996) and transient monitor results from the Burst Alert Telescope on the Swift -ray burst mission (Swift/BAT; Barthelmy et al., 2005). These results are provided publicly by the RXTE/ASM and Swift/BAT teams, respectively.
2.3. -Ray
Fermi Science Tools 9.17 and HEASoft 6.9 were used to reduce and analyze all Fermi-LAT (Atwood et al., 2009) observations within 10° of Cyg X-3 (catalog ) that took place in the range OJD –150 (2010 Feb 14 – 2010 Sep 11 UT), providing a baseline of 100 d before and after the flare of OJD 43–44. Cyg X-3 (catalog ) is within the LAT FOV for 15 ks per day. Given this and the typical flux of Cyg X-3 (catalog ) in the LAT band, we were compelled to use 1-day time bins in the following analysis.
Thirty arcminutes away from Cyg X-3 (catalog ) is a comparatively bright pulsar, PSR J2032+4127 (catalog ). Using gtephem and gtpphase, we added the phase from the most recent ephemeris available (Abdo et al., 2009) to the events file. Then, we extracted events corresponding to the off-pulse phases (0–0.12, 0.2–0.6, and 0.72–1; Camilo et al., 2009). This removed 20% of the live time, so the exposure time of the off-pulse events file was corrected accordingly.
With gtselect and gtmktime, good time intervals from the off-pulse events file were selected in the 0.1–10 GeV energy range. At high energies (10 GeV), Cyg X-3 (catalog ) is expected to have negligible emission. The events class was set to “3” which selects only high-quality diffuse-background photons. To minimize background albedo photons from the Earth’s limb, zenith and rocking angles were restricted to less than 105° and 52°, respectively.
Exposure maps were generated by gtexpcube and gtexpmap while gtbin created photon counts maps in the region of interest. Emission from Cyg X-3 (catalog ) was not apparent on the counts maps, which is unsurprising given that Cyg X-3 (catalog ) is a faint source whose peak emission is at the low end of the LAT band where the point spread function is 5–10°. Complicating matters is the high level of diffuse background emission.
Following the procedure described in Abdo et al. (2009), unbinned likelihood analysis was performed for the daily bins with gtlike considering photons inside a 7° radius of Cyg X-3 (catalog ) from all 1FGL (Abdo et al., 2010) sources up to 5° away, and all bright (detection significance and flux [100 MeV] ph cm-2 s-1) 1FGL sources up to 20° away. The instrument response function was “Pass 6 v3” (P6_V3_DIFFUSE), and the convergence relied on the NEWMINUIT method. Spectral models and input parameters from the 1FGL catalog were used except for pulsars 1FGL J2021.0+3651 (catalog ) and 1FGL J2021.5+4026 (catalog ) which had exponential cutoffs in addition to their power laws. Besides Cyg X-3 (catalog ), whose photon index and normalization were free, all sources had spectral parameters fixed to the 1FGL values. We included models for the galactic (gll_iem_v02) and extragalactic (isotropic_iem_v02) diffuse emission. The normalizations were left free to vary, as was the photon index of the galactic component.
3. Results
Long-term lightcurves of Cyg X-3 (catalog ) in soft and hard X-ray bands are presented in the top panel of Figure 1. The system was in a soft X-ray state during OJD 20–55, with an episode of particular softness occurring during OJD 39–41.
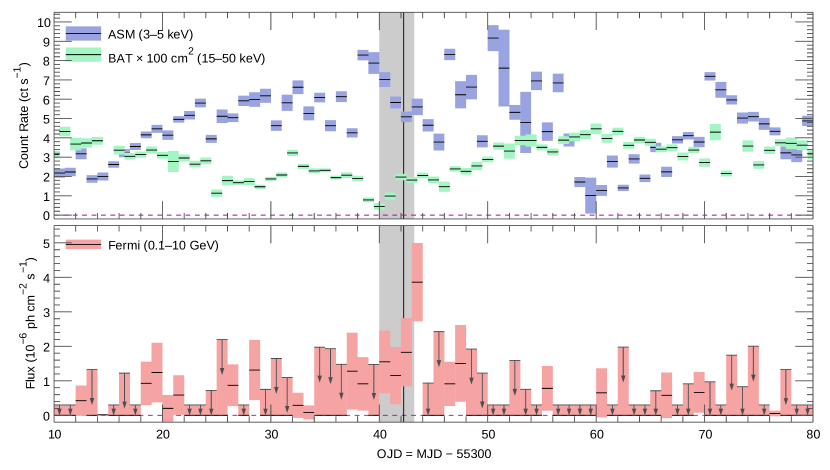
The Fermi source flux integrated over 0.1–10 GeV is presented in the lower panel of Figure 1. In bins where the test statistic (TS , where is the ratio of the likelihood of models without and with the source) is less than one, we compute and plot a 1 upper limit. A peak is seen starting on OJD 43. The TS value in this bin is 18.4, which translates approximately to 4.3, and the flux is ph cm-2 s-1. We are unable to achieve a more precise timing of the flare. Shifting the binning by half a day results in lower-significance and lower-flux detections in the range OJD 42.5–44.5. Analysis using higher-cadence binning does not yield significant detections of the peak.
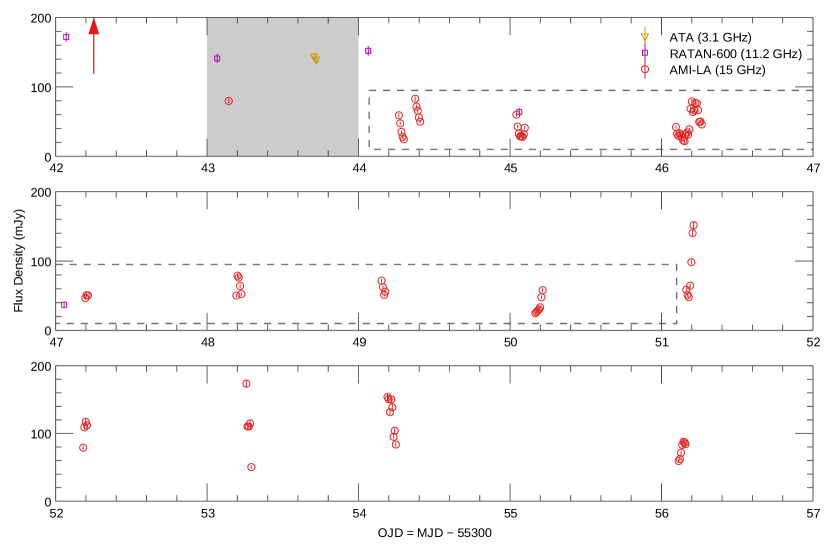
Radio measurements from just before the -ray flare are presented in the top panel of Figure 2. A 1 Jy radio flare occurred on OJD 42.25. There is evidence of an earlier flare on OJD 41.11, with a maximum observed flux density of 366 mJy, but only the rising portion of the flare is observed, so its properties are poorly-constrained. As is shown in Figure 3, the 15 GHz flux density of Cyg X-3 (catalog ) is depressed in the seven days following the -ray flare, with a mean flux density of 48 mJy and an 80-percentile observed flux density of 66 mJy. (That is, 80% of the measurements during this period are mJy.) Starting on OJD 51, the typical radio flux density increases by a factor of 2 to 100 mJy.
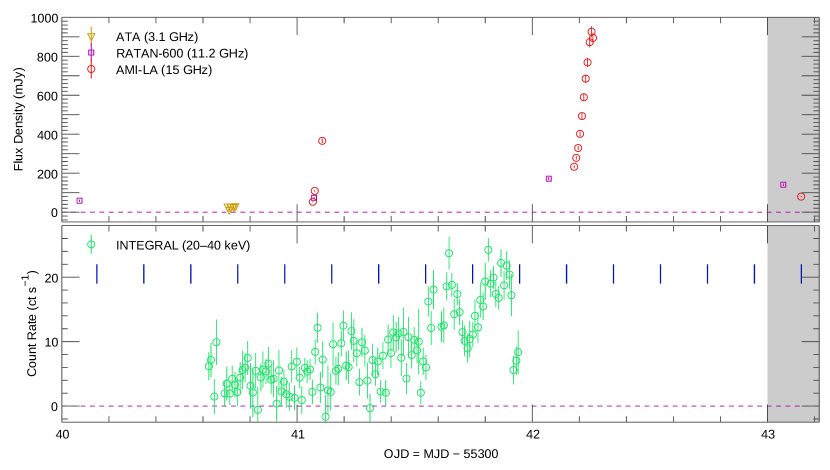
The bottom panel of Figure 2 shows high-cadence hard X-ray measurements from before the -ray flare, made as Cyg X-3 (catalog ) exited the softest portion of its soft state. They show the recovery of the hard X-ray flux, subject to orbital modulation. The modulation makes it difficult to determine the significance of the drop in flux seen in the last three measurements; it may be evidence of a significant reduction in hard X-ray emission precursing the radio flare. Combining the Swift/BAT and INTEGRAL measurements, the hard X-ray flux has recovered by OJD 42.0, about 5 h before the observed radio flare. The -ray flare then occurred 1–2 d later.
4. Discussion
If our observations are taken at face value — that is, one assumes no significant radio activity during coverage gaps and that the flaring stems from one ejection event — the sequencing of the radio and -ray emission is inconsistent with the companion IC model discussed in §1. Emission in -rays following a radio flare could be interpreted as a reenergization of the relativistic jet electrons by a shock (Dubus et al., 2010). With a typical jet speed of 0.5 (Tudose et al., 2007) and a delay of 1 d, the reenergization would occur 100 AU from the system. This is much larger than the orbital separation but three orders of magnitude smaller than the distance at which the jet is expected to interact significantly with the ISM (1 pc). Such reenergization could be due to a collision between the jet and a dense clump of the WR wind (Araudo et al., 2009). In this scenario, the absence of -ray emission at the time of ejection can be explained by absorption within the system (Cerutti et al., 2011), although this model must be reconciled with the observations of Tavani et al. (2009) and Abdo et al. (2009). The reenergization would lead to additional radio emission as the -ray-emitting electrons cool, although the ambient magnetic field, and hence synchrotron luminosity, will be much weaker than that found close to the system.
If the -ray flare is interpreted as the result of a discrete ejection event, the lack of a notable subsequent radio flare could be explained by the ejected material being largely hadronic. While hadronic -ray emission is not as efficient as IC upscattering, it does yield a higher ratio of -ray to radio luminosity (Romero & Vila, 2008). The secondary leptons due to hadronic interactions would, however, radiate, and detailed studies typically find that their bolometric luminosity is comparable to that of the primaries (e.g. Vila & Romero, 2010).
Should our data be taken at face value? Application of a simple synchrotron-cloud model (van der Laan, 1966) supports the intuition that radio flares with sizes comparable to that of the largest observed could have occurred without detection, with the modeled lifetimes being 0.2 d. While this model has had ambiguous success when applied to Cyg X-3 (catalog ) (Fender et al., 1997), its simplicity is advantageous for our sparse data, and it has been successfully applied to observations of other systems (e.g. Fender et al., 1997; Wilms et al., 2007; Prat et al., 2010). To obtain a better understanding of the radio behavior of Cyg X-3 (catalog ) we compared the 2010 May data to 15 years of archived AMI-LA / Ryle Telescope observations. The 1 Jy radio flare is unusual: no flux densities mJy are detected in a 500 d span around the observations we describe.
In light of the predictions of the companion IC model, we consider particularly the radio observations after the observed -ray flare. The duty cycle of the observations is only 6.8% in the seven-day post-flare quiescent interval. We identified 51 epochs similar to this in the archives, each lasting at least 7 days and having an 80-percentile observed flux less than 70 mJy (cf. §3). These archival measurements have a duty cycle comparable to that of the 2010 May data (4.9%), but a much larger time on-source (55.5 days). Because this time is large compared to the total duration of the 2010 May post--flare quiescence, a search for flares in the archival dataset can constrain the likelihood of there having been an unobserved flare in the 2010 May dataset, assuming no long-term evolution in the behavior of the quiescent state and stochastic flaring.
The epochs were identified by exhaustively searching for seven-day segments meeting the aforementioned criteria, then lengthening these segments as much as possible without violating the 80-percentile constraint. Segments separated by less than three days were merged, in a few cases shortening the segment somewhat to preserve the statistical constraint. This method of construction does not bias against epochs containing rapid flares, no matter their size. Qualitatively, the lightcurve of the typical epoch starts high, drops to very low flux densities, and then becomes high again, possibly with rapid flares in the middle.
The largest flux density seen in the selected archival data was 524 mJy, in the context of a single rapidly-evolving (risetime 0.1 d) flare that would not have necessarily been detected in the 2010 May observing. (Here we exclude slow, large, epoch-terminating flares that would have been easily seen in the 2010 May data.) Approximating the rate of such flares as one per 55.5 days of observing, we derive an 11% chance that such a flare occurred in the 7 days after the gamma-ray peak without being observed. Ignoring the epoch beginnings and endings, which contain high flux values by construction, we find that the flux density of Cyg X-3 (catalog ) is larger than 250 mJy only 0.3% of the time during its quiescent state.
5. Summary & Conclusions
We have presented observations of a 2010 May Cyg X-3 (catalog ) flaring episode in the radio, soft and hard X-ray, and -ray bands. Our data show a sequence of three notable events: a particular softening and partial recovery of the X-ray emission, a rapid 1 Jy radio flare, and a -ray flare. Interpretation of the data is made more challenging by the sparse sampling of the radio data and the low cadence of the high-energy observations as compared to the rapidity with which the radio emission can evolve. Nonetheless, the observations we do have and comparisons to historical data challenge the interpretation that the -ray emission is due to IC upscattering of the companion radiation field by high-energy electrons leaving the system in a relativistic jet, because there is no evidence for the subsequent radio emission that one would expect to see from these electrons.
While the companion IC model of -ray emission from microquasars is clear and compelling, the lack of consistent radio/-ray timing lags call into question its completeness. There could be more than one mechanism responsible for the -ray emission of Cyg X-3 (catalog ), becoming more or less relevant in different circumstances, or the reprocessing of the -ray emission by effects such as pair production could be more significant than commonly assumed. Detections of or limits to very high-energy -rays (100 GeV; e.g. Aleksić et al., 2010) or neutrinos from Cyg X-3 (catalog ) would aid in the understanding of the processes relevant to the emission in the Fermi band.
The power of multiband monitoring of Cyg X-3 (catalog ) promises to increase significantly with the addition of -ray data to the set of available observations. As Cyg X-3 (catalog ) inevitably produces more flares, frequent observations at all wavelengths are important to build a detailed understanding of the launching and propagation of its relativistic jets. Radio observations of 2 h cadence with near-continuous coverage would be ideal for establishing an unambiguous relationship between radio and -ray flaring. Based on the phenomenology we observe, intensive radio observations should be triggered at the ends of very soft X-ray states without waiting for the detection of -ray flares.
References
- Abdo et al. (2009) Abdo, A. A., et al. 2009, Science, 326, 840
- Abdo et al. (2010) Abdo, A. A., et al. 2010, Astrophys. J. Supp., 188, 405
- Aleksić et al. (2010) Aleksić, J., et al. 2010, Astrophys. J., 721, 843
- Aller et al. (2010) Aller, M. A., Hughes, P. A., & Aller, H. D. 2010, in Fermi Meets Jansky — AGN in Radio and Gamma-Rays, ed. T. Savolainen, E. Ros, R. W. Porcas, & J. A. Zensus, 65
- Araudo et al. (2009) Araudo, A. T., Bosch-Ramon, V., & Romero, G. E. 2009, Astron. Astrophys., 503, 673
- Atwood et al. (2009) Atwood, W. B., et al. 2009, The Astrophysical Journal, 697, 1071
- Barthelmy et al. (2005) Barthelmy, S. D., et al. 2005, Space Sci. Rev., 120, 143
- Bonnet-Bidaud & Chardin (1988) Bonnet-Bidaud, J. M., & Chardin, G. 1988, Phys. Rep., 170, 325
- Bulgarelli et al. (2010) Bulgarelli, A., et al. 2010, The Astronomer’s Telegram, 2609, 1
- Camilo et al. (2009) Camilo, F., et al. 2009, The Astrophysical Journal, 705, 1
- Cerutti et al. (2011) Cerutti, B., Dubus, G., Malzac, J., Szostek, A., Belmont, R., Zdziarski, A., & Henri, G. 2011, Astronomy and Astrophysics, in press, arXiv:1103.3875
- Cherepashchuk & Moffat (1994) Cherepashchuk, A. M., & Moffat, A. F. J. 1994, The Astrophysical Journal, 424, L53
- Corbel & Fermi Large Area Telescope Collaboration (2010) Corbel, S., & Fermi Large Area Telescope Collaboration. 2010, The Astronomer’s Telegram, 2611, 1
- Corbel & Hays (2010) Corbel, S., & Hays, E. 2010, The Astronomer’s Telegram, 2646, 1
- Dubus et al. (2010) Dubus, G., Cerutti, B., & Henri, G. 2010, Mon. Not. Roy. Astron. Soc., 404, L55
- Fender et al. (2004) Fender, R. P., Belloni, T. M., & Gallo, E. 2004, Mon. Not. Roy. Astron. Soc., 355, 1105
- Fender et al. (1997) Fender, R. P., Burnell, S. J. B., Waltman, E. B., Pooley, G. G., Ghigo, F. D., & Foster, R. S. 1997, Mon. Not. Roy. Astron. Soc., 288, 849
- Fender et al. (1997) Fender, R. P., Pooley, G. G., Brocksopp, C., & Newell, S. J. 1997, Mon. Not. Roy. Astron. Soc., 290, L65
- Geldzahler et al. (1983) Geldzahler, B. J., et al. 1983, Astrophys. J. Lett., 273, L65
- Giacconi et al. (1967) Giacconi, R., Gorenstein, P., Gursky, H., & Waters, J. R. 1967, The Astrophysical Journal, 148, L119
- Kawai et al. (2010) Kawai, N., et al. 2010, The Astronomer’s Telegram, 2635, 1
- Koljonen et al. (2010) Koljonen, K. I. I., Hannikainen, D. C., McCollough, M. L., Pooley, G. G., & Trushkin, S. A. 2010, Mon. Not. Roy. Astron. Soc., 406, 307
- Kotani et al. (1996) Kotani, T., Kawai, N., Matsuoka, M., & Brinkmann, W. 1996, Pub. Astron. Soc. Japan, 48, 619
- Kotani et al. (1994) Kotani, T., et al. 1994, Pub. Astron. Soc. Japan, 46, L147
- Lebrun et al. (2003) Lebrun, F., et al. 2003, Astron. Astrophys., 411, L141
- Levine et al. (1996) Levine, A. M., Bradt, H., Cui, W., Jernigan, J. G., Morgan, E. H., Remillard, R., Shirey, R. E., & Smith, D. A. 1996, Astrophys. J. Lett., 469, L33
- Ling et al. (2009) Ling, Z., Zhang, S. N., & Tang, S. 2009, The Astrophysical Journal, 695, 1111
- Migliari et al. (2002) Migliari, S., Fender, R., & Méndez, M. 2002, Science, 297, 1673
- Orellana et al. (2007) Orellana, M., Bordas, P., Bosch-Ramon, V., Romero, G. E., & Paredes, J. M. 2007, Astron. Astrophys., 476, 9
- Pooley & Fender (1997) Pooley, G. G., & Fender, R. P. 1997, Mon. Not. Roy. Astron. Soc., 292, 925
- Prat et al. (2010) Prat, L., Rodriguez, J., & Pooley, G. G. 2010, Astrophys. J., 717, 1222
- Predehl et al. (2000) Predehl, P., Burwitz, V., Paerels, F., & Trümper, J. 2000, Astronomy & Astrophysics, 357, L25
- Romero et al. (2003) Romero, G. E., Torres, D. F., Kaufman Bernadó, M. M., & Mirabel, I. F. 2003, Astron. Astrophys., 410, L1
- Romero & Vila (2008) Romero, G. E., & Vila, G. S. 2008, Astron. Astrophys., 485, 623
- Sánchez-Sutil et al. (2008) Sánchez-Sutil, J. R., Martí, J., Combi, J. A., Luque-Escamilla, P., Muñoz Arjonilla, A. J., Paredes, J. M., & Pooley, G. 2008, Astronomy and Astrophysics, 479, 523
- Singh et al. (2002) Singh, N. S., Naik, S., Paul, B., Agrawal, P. C., Rao, A. R., & Singh, K. Y. 2002, Astronomy and Astrophysics, 392, 161
- Stark & Saia (2003) Stark, M. J., & Saia, M. 2003, The Astrophysical Journal Letters, L101
- Tavani et al. (2009) Tavani, M., et al. 2009, Nature, 462, 620
- Tomsick et al. (2010) Tomsick, J. A., et al. 2010, The Astronomer’s Telegram, 2644, 1
- Trushkin (2000) Trushkin, S. A. 2000, Astronomical and Astrophysical Transactions, 19, 525
- Trushkin et al. (2006) Trushkin, S. A., Bursov, N. N., Nizhelskij, N. A., Majorova, E. K., & Voitsik, P. A. 2006, in VI Microquasar Workshop: Microquasars and Beyond, ed. T. Belloni
- Tudose et al. (2007) Tudose, V., et al. 2007, Mon. Not. Roy. Astron. Soc., 375, L11
- van der Laan (1966) van der Laan, H. 1966, Nature, 211, 1131
- van Kerkwijk et al. (1996) van Kerkwijk, M. H., Geballe, T. R., King, D. L., van der Klis, M., & van Paradijs, J. 1996, Astronomy & Astrophysics, 314, 521
- Vila & Romero (2010) Vila, G. S., & Romero, G. E. 2010, Mon. Not. Roy. Astron. Soc., 403, 1457
- Waltman et al. (1994) Waltman, E. B., Fiedler, R. L., Johnston, K. L., & Ghigo, F. D. 1994, Astron. J., 108, 179
- Welch et al. (2009) Welch, J., et al. 2009, IEEE Proceedings, 97, 1438
- Wilms et al. (2007) Wilms, J., Pottschmidt, K., Pooley, G. G., Markoff, S., Nowak, M. A., Kreykenbohm, I., & Rothschild, R. E. 2007, Astrophys. J. Lett., 663, L97
- Winkler et al. (2003) Winkler, C., et al. 2003, Astron. Astrophys., 411, L1
- Zwart et al. (2008) Zwart, J. T. L., et al. 2008, Mon. Not. Roy. Astron. Soc., 391, 1545