Swift Observations of MAXI J1659152: A Compact Binary with a Black Hole Accretor
Abstract
We report on the detection and follow-up high cadence monitoring observations of MAXI J1659152, a bright Galactic X-ray binary transient with a likely black-hole accretor, by Swift over a 27 day period after its initial outburst detection. MAXI J1659152 was discovered almost simultaneously by Swift and MAXI on 2010 September 25, and was monitored intensively from the early stages of the outburst through the rise to a brightness of Crab by the Swift X-ray, UV/Optical, and the hard X-ray Burst Alert Telescopes. We present temporal and spectral analysis of the Swift observations. The broadband light-curves show variability characteristic of black-hole candidate transients. We present the evolution of thermal and non-thermal components of the keV combined X-ray spectra during the outburst. MAXI J1659152 displays accretion state changes typically associated with black-hole binaries, transitioning from its initial detection in the Hard State, to the Steep Power-Law State, followed by a slow evolution towards the Thermal State, signified by an increasingly dominant thermal component associated with the accretion disk, although this state change did not complete before Swift observations ended. We observe an anti-correlation between the increasing temperature and decreasing radius of the inner edge of the accretion disk, suggesting that the inner edge of the accretion disk in-falls towards the black-hole as the disk temperature increases. We observed significant evolution in the absorption column during the initial rise of the outburst, with the absorption almost doubling, suggestive of the presence of an evolving wind from the accretion disk. We detect quasi-periodic oscillations that evolve with the outburst, as well as irregular shaped dips that recur with a period of hours, strongly suggesting an orbital period that would make MAXI J1659152 the shortest period black-hole binary yet known.
Subject headings:
X-rays: binaries1. Introduction
The majority of stellar mass black-hole candidate binaries (BHB) in our Galaxy emit mainly in a low level quiescent state. These systems occasionally go through bright X-ray and optical transient outbursts that typically last days to months (Chen et al., 1997). Although BHB outbursts are known to be recurrent, the time between outbursts has been reported to be as long as 60 years (Eachus et al., 1976), suggesting many systems remain undiscovered. With the use of wide field X-ray monitoring, we are able to detect and localize these bright transient outbursts, leading to the discovery of previously undetected BHBs. The X-ray signatures of BHBs are well known and categorized into distinct states, defined by the presence of quasi-periodic oscillations (QPOs), the total rms variability of their power-spectra, and the fitted parameters and relative strengths of thermal and non-thermal components of their X-ray spectra. A review of BHB systems is given by Remillard & McClintock (2006) and for consistency we use the nomenclature presented in that review to classify emission states.
The combination of Swift (Gehrels et al., 2004), with its wide field hard X-ray detector and broadband narrow field instruments, and the regular almost all-sky X-ray scanning performed by “Monitor of All-sky X-ray Image” (MAXI; Matsuoka et al. 2009), allows for rapid detection and accurate localization of BHBs as they enter outburst. Swift’s low-overhead observing and rapid autonomous follow-up capabilities allow us to obtain high cadence monitoring observations in X-ray and Optical/UV wavelengths quickly after initial detection, allowing the study of the earliest stages of BHB outbursts with new clarity.
MAXI J1659152 was first reported after detection by the Swift Burst Alert Telescope (BAT; Barthelmy et al. 2005) at 08:05 UT, 2010 September 25 (MJD 55464.337, all times from this point are quoted using MJD format in UTC). Follow up observations performed by the Swift X-ray Telescope (XRT; Burrows et al. 2005a) and UV/Optical Telescope (UVOT; Roming et al. 2005) 31 minutes later localized the transient (Mangano et al., 2010), although it was initially misidentified as a Gamma-Ray Burst and named GRB 100925A. Based on its detection by the MAXI Nova Alert System (Negoro, 2009) at MJD 55464.104 (02:30UT, hours before the BAT trigger), MAXI J1659152 was determined to be a previously unknown Galactic X-ray transient (Negoro et al., 2010).
IR spectroscopy was obtained which confirmed that the optical counterpart showed emission lines consistent with that of an X-ray Binary (de Ugarte Postigo et al., 2010). The transient was also detected in radio (van der Horst et al., 2010), by INTEGRAL (Vovk et al., 2010), XMM-Newton (Kuulkers et al., 2010a) and RXTE, which detected a 1.6 Hz type-C QPO in the power-spectrum, indicating that MAXI J1659152 is a BHB (Kalamkar et al., 2011). Kuulkers et al. (2010b) reported evidence for periodicity in the 2.4–2.5 hour range from XMM-Newton data, suggesting that this is the shortest period BHB yet known. Belloni et al. (2010) reported a refined the period measurement from RXTE data of hours. The XMM-Newton light-curve revealed irregular structure dips lasting min, and suggest that dips analogous to those often seen in Low Mass X-ray Binaries (LMXBs) are the source of the hour period, rather than eclipses from the companion star (Kuulkers et al., 2010b).
We report here on broadband observations of MAXI J1659152 utilizing all three instruments on Swift during the first 27 days of the outburst after its initial detection. We present spectral and temporal analysis, including the broadband UV/optical, X-ray and hard X-ray light-curves, analysis of QPOs, time resolved spectral evolution utilizing broadband spectral fits across the XRT and BAT energy ranges, and search for periodicities in the X-ray data.
2. Observations and Analysis
Observations with Swift began after the rising hard X-ray brightness of MAXI J1659152 triggered the BAT at MJD 55464.337. This prompted the standard GRB follow-up mode (e.g. Gehrels et al. 2004) in which the transient was observed as an “Automated Target” (AT) every minute orbit with exposures of 0.5–2.5 ks per orbit. From MJD 55468 onwards the observation cadence was lowered two 1–2 ks observations a day, approximately spaced by 12 hours. Observations of the source continued with this cadence until the final observation ended at MJD 55491.259, days after the initial BAT detection, after which MAXI J1659152 became too close to the Sun for Swift to observe. Between MJD 55480 and MJD 55482 MAXI J1659152 was not observable by XRT or UVOT due to the proximity of the Moon. XRT observed in Windowed Timing (WT) mode for all observations except for a 1 ks observation taken on MJD 55466 in Photon Counting (PC) mode, which was performed to obtain an accurate localization. UVOT data were typically collected utilizing all 6 UVOT filters, apart from a period between MJD 55468 and MJD 55479 when observations were taken utilizing a daily rotation of the 3 UV filters and . MAXI J1659152 was observed by Swift for 1 ks on MJD 55598, 107 days after the initial monitoring observations ended, with XRT data collected in PC mode, and UVOT utilizing all 6 filters.
BAT data from the observations during which Swift was pointed at MAXI J1659152 were processed using the HEASOFT batsurvey script to produce eight-channel light curves which were then converted to spectra covering the energy range keV. BAT light-curves were produced automatically by the BAT Transient Monitor web page (Krimm et al., 2006).
XRT light-curves and spectra were extracted utilizing the methods described by Evans et al. (2009), with full corrections for pile-up and hot columns applied to the data based on a PSF fitted position of MAXI J1659152 obtained from PC mode observations. XRT spectra were extracted over time intervals strictly simultaneous with the BAT survey spectra, and binned to a minimum of 20 counts per energy bin.
UVOT photometry was derived from images via uvotmaghist, using an extraction region of radius 5″. Magnitudes are based on the UVOT photometric system (Poole et al., 2008) and were uncorrected for the Galactic extinction in the direction of MAXI J1659152 of (Schlegel et al., 1998). Taking this value as an upper limit to the extinction of the counterpart and using the effective wavelengths of the Swift filters (Poole et al., 2008) and the parameterization of Pei (1992), the extinctions in the Swift bands are: , , , , , . Magnitudes of the UVOT photometric system are indicated by lower-case letters of the filter used (e.g. ), and catalog magnitudes by upper-case letters of the filter (e.g. ). However within UVOT measurement errors, we can assume that UVOT , and magnitudes are equivalent to , and .
All quoted uncertainties are given at confidence level for one interesting parameter unless otherwise stated.
3. Results
3.1. Localization
Utilizing a short XRT observation in PC mode taken on MJD 55598, we derived a position of RA, Dec = , (J2000, 1.4″ error radius). This position was corrected for systematic errors in astrometry utilizing UVOT data taken simultaneously with the XRT data, utilizing the methods described by Goad et al. (2007). This position is improved over the previously reported XRT position (Kennea et al., 2010), which was based on PC mode data taken on MJD 55466 when MAXI J1659152 was bright and the data were highly affected by pile-up. During the later observation MAXI J1659152 was much fainter and the data where not affected by pile-up, thus allowing for a more accurate localization.
The UVOT position of the counterpart was derived from a deep (7170 s) band image summed between MJD 55464.6 and 55467.6, using the uvotdetect command, as RA, Dec = , (J2000; 0.70″ error radius), 0.4″ from the center XRT position and within the XRT error circle, and 0.19″ from the EVLA detected radio counterpart (Paragi et al., 2010), unambiguously confirming that the UVOT source is the optical counterpart of the MAXI J1659152. The UVOT location of MAXI J1659152 does not correspond with any known catalog object. The non-detection of the companion in the USNO-B catalog allows us to place an upper limit on the optical brightness of MAXI J1659152 in quiescence of (Monet et al., 2003).
3.2. Broadband Outburst Light-curve
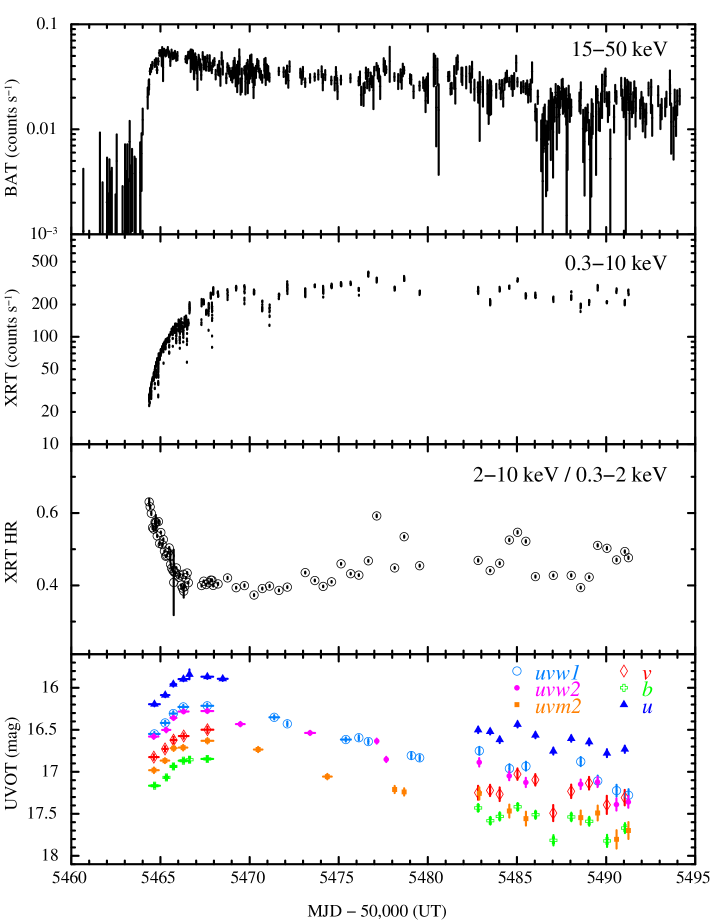
Figure 1 shows the XRT, BAT and UVOT light-curves for MAXI J1659152 during the initial stages of the outburst. Examination of data from the Swift/BAT hard X-ray transient monitor show that the outburst light-curve has the typical fast-rise/exponential decay (FRED) shape seen in many X-ray transients. The source had risen very sharply from non-detection on MJD 55462 to a weak detection on MJD 55463 ( counts cm-2 s-1, keV) and then a detection ( counts cm-2 s-1) in the daily average on MJD 55464. There was no detection of the source dating back to January 2006 with a upper limit of counts cm-2 s-1. The BAT light-curve is well modeled by a sharp rise from a low level detection to peak rate of counts cm-2 s-1 on MJD 55465, followed by a slow exponential decay, until it became undetectable in the BAT keV energy range after MJD 55529, with a upper limit of counts s cm2.
The XRT WT light-curve starts on MJD 55464, at a level of counts s-1, which corresponds to a flux of erg s-1 cm-2 ( keV). The light-curve continues to rise to peak around MJD 55476, approximately 11 days after the peak of the BAT light-curve, after which MAXI J1659152 begins a slow decline. We have plotted the ratio of two hard and soft XRT bands, keV and keV, respectively. This hardness ratio plot shows that for the initial phase of the outburst of MAXI J1659152 there is a rapid spectral softening which reaches a soft extremum on MJD 55657, after which the hardness shows a slow increase, with some short term variability. The abrupt change in the hardness ratio on MJD 55657 is most likely a indication of the evolution of the source from the Hard State, to the Steep Power-Law state, which is followed by a slow evolution into the Thermal State.
The UVOT counterpart shows significant variability over all (, , , , , ) bands. The UVOT light-curve shows a correlated rise with the X-ray light-curve, peaking around MJD 55465 at , followed by a slower decline.
The observation performed on MJD 55598 (not shown in Figure 1) finds the source at a greatly lowered flux level than seen during outburst, approximately counts s-1, corresponding to a flux of . The observed hardness ratio () during this observation suggests that the source had returned to the Hard State. The UVOT data show that the optical counterpart had faded to mag, a drop of approximately 1.3 magnitude from the previous measurement 107 days earlier, and magnitudes fainter than the peak outburst brightness. As discussed earlier, we assume that the quiescent optical brightness is , and therefore on MJD 55598 MAXI J1659152 is still in outburst.
3.3. Spectral evolution
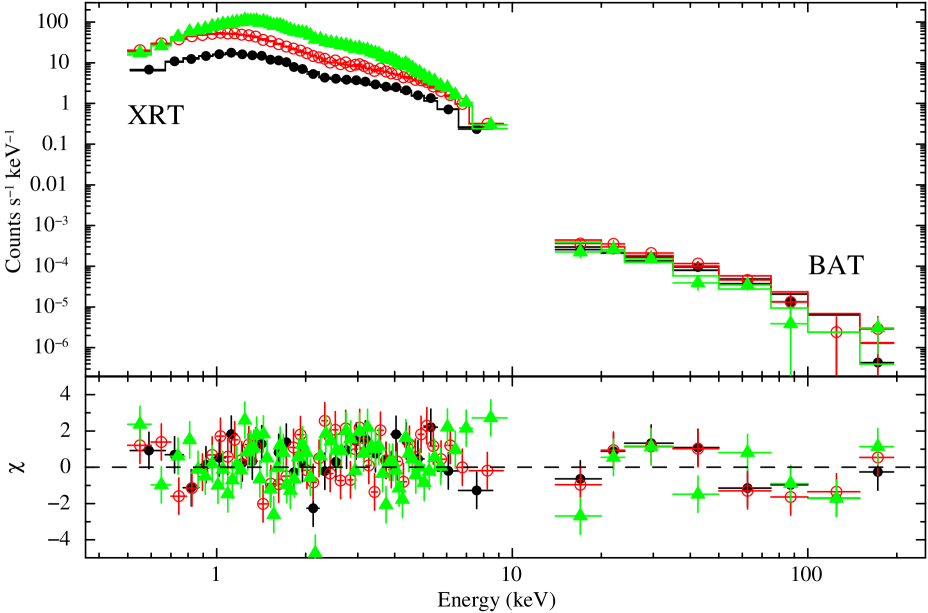
We fit the simultaneous BATXRT spectra in the keV and keV energy bands for XRT and BAT, respectively. Factors were included in the fitting to allow for normalization uncertainties between the two instruments, which are constrained within their usual ranges (0.9–1.1). Each spectrum was fit with a three-component model consisting of a power-law model (powerlaw), a model of thermal emission from the accretion disk (diskbb, Makishima et al. 1986), and a model of the total absorption (tbabs) with the abundance set to the values given by Wilms et al. (2000). We calculated the fraction of flux contribution from the diskbb model, , by finding the ratio of the model fitted keV flux from the diskbb component with the combined flux from both the diskbb and powerlaw components. Example XRTBAT spectra at three different epochs are shown in Figure 2.
In order to test the requirement of the disk component over a simple absorbed power-law model, we performed an F-test comparison between fits of the two models for every fitted spectra throughout the outburst. For fits before MJD 55465, which coincides with the peak of the BAT flux (Figure 1), we find an F-test probability of for approximately of the fitted spectra, suggesting that during this period, a disk component is not needed with a high significance to fit the X-ray spectrum, as expected for a BHB in the Hard State. After MJD 55465, we find that of the fitted spectra have an F-test probability of , showing that the addition of a disk component significantly improves the fit for the majority of cases. We therefore conclude that the disk component is statistically significant for all times during the Swift observations of the outburst other than during the very early part (earlier than MJD 55465).
The fitted spectral parameters as a function of time are shown in Figure 3. As inferred from the hardness ratio changes, MAXI J1659152 shows significant spectral evolution during the outburst. During the initial detection the spectrum is well fit by an absorbed power-law model with , indicating a BHB in the Hard State. As MAXI J1659152 brightens the spectrum softens and continues to be dominated by power-law emission with a on MJD 55468, signaling the transition to the Steep Power-Law state. During this time, the disk blackbody component is a small (%), but statistically significant and evolving ( rising from keV to keV), component of the spectrum.

After MJD 55469 the source appears to evolving to the Thermal State, indicated by the disk fraction increasing from on MJD 55465 to by MJD 55485 and remaining approximately constant until the proximity of MAXI J1659152 to the Sun forced the end of Swift monitoring observations on MJD 55491. In this period is in the range of keV, typical for BHB in the Thermal State. Therefore we do not observe the full state transition between the Steep Power-Law and Thermal states, defined by Remillard & McClintock (2006) as occurring when , with the source remaining in an intermediate state.
In order to assess the possible presence of a spectral break, we fit a model to the data consisting of a diskbb plus cut-off power-law (cutoffpl) model to data from MJD 55484.57 (see Figure 2) chosen as this data correspond to the peak BAT flux of MAXI J1659152. The fitted value of the cut-off energy is poorly constrained, keV, with a measured photon index of . An F-test shows that there is little evidence of an improvement in the fit if a spectral break is added (F=2.02, giving a null-hypothesis probability of 0.16), and therefore the cut-off power-law is not required to fit the XRTBAT data. We note that there are currently no analysis tools available that allow integration of BAT spectra over longer periods than an individual Swift observation snapshot, which would be required to improve the accuracy of the spectral measurement. Given this and the brightness of the BAT data, if a spectral break is present, the XRTBAT data are not sensitive to it.
The expected Galactic line-of-sight absorption for MAXI J1659152 is cm-2 (Kalberla et al., 2005), however the fitted absorption column is higher and variable, indicating an additional intrinsic absorption component. The fitted increases rapidly during the initial stages of the outburst, beginning at on MJD 55464 and rising to a mean value of on MJD 55465. Measured absorption remains consistent with this value until observations ceased on MJD 55491. Fitting more complex models for absorption such as a warm absorber or partial covering model, with a fixed Galactic absorption also provide good fits to the increasing absorption, although given the spectral resolution of the XRT data, these more complex models are not required over a simple single-parameter variable absorption model.
A later follow-up observation taken on MJD 55598 after MAXI J1659152 had faded significantly to a flux of (0.5-10 keV) and entered the Hard State (, no significantly detected disk component), gives a fitted absorption of , consistent with the post-outburst value, suggesting that the additional absorption component is still present despite the lowered X-ray flux.
With moderate resolution spectral fitting, variable absorption may be due to a statistical correlation between spectral parameters. To investigate this we examined confidence contours in (, ) parameter space, and find that the low spectra (MJD 55464) are distinct from the higher spectra (MJD 55465) with confidence. Joint BAT and XRT spectral fits allow to constrain and more independently than by fitting XRT alone. Care was taken to remove the effects of pile-up from the spectra, as pile-up can considerably affect continuum spectra fitting (Miller et al., 2010). The fitted values of and do not vary in lock-step either, given the fast initial rise in between MJD 55464 and MJD 55465, compared with an linear rise in ending around MJD 55470. The consistency of the measured absorption in the later follow-up observation of MAXI J1659152 provides further evidence that the measured is not related to the fitted model or source brightness. We therefore conclude that the variable absorption is physical and not an artifact of the fit.
3.4. Time series analysis
We searched for QPOs using a fast Fourier transform method, adopting the power-spectral normalization of Leahy et al. (1983) and the search technique described by van der Klis (1989). For each orbit of XRT data, power density spectra (PDS) were generated for continuous sections of data of 4096 bins duration, with a bin size of 0.01 s, and averaged. The averaged PDS from each orbit was then rebinned in frequency so that continuous frequencies were averaged, using a geometrical series binning scheme.
Each rebinned/averaged PDS was fit with a model consisting of a power-law for the low frequency noise, a Lorentzian for the QPO (whose width was fixed to preserve a quality factor of 5) and a constant for the Poisson noise level. The QPO was considered detected if the Lorentzian amplitude exceeded the local detection level, (given by the integral probability of a chi-squared distribution for d.o.f,. scaled by a factor of 1/MW) minus the mean noise level, which is 2 for the Leahy et al. (1983) normalization. Example PDS for 4 epochs are shown in Figure 4.
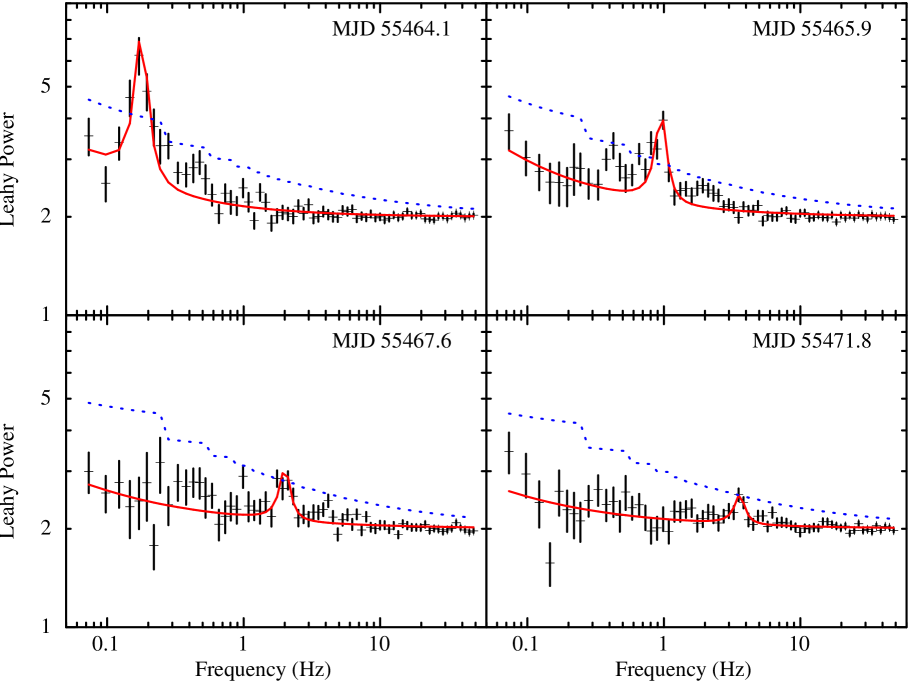
Figure 5 shows in two energy bands ( keV and keV), the QPO frequency, the fractional rms variability of the fitted Lorentzian for PDS in which QPO were detected at greater than , and the broadband continuum rms for Hz, including the QPO and low-frequency noise components.
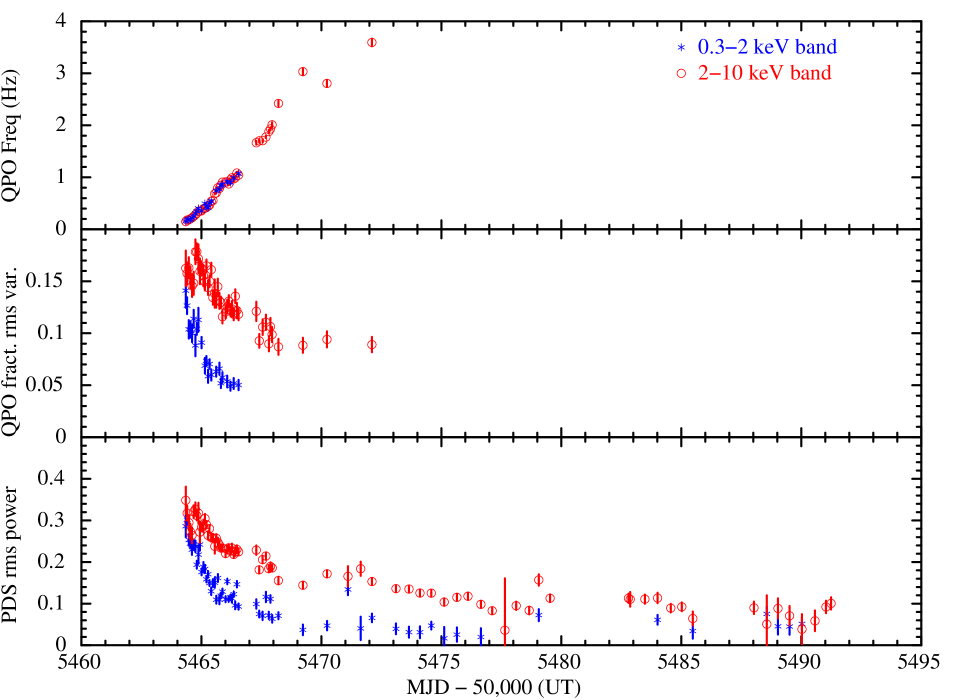
The QPO frequency and detection energy evolves with the QPO peak frequency increasing approximately linearly with time. After MJD 55466 QPOs are not detected in the keV band, but are still detected in the keV band until MJD 55472. The QPO frequency is correlated with the fitted value of , which has been observed previously in BHBs (e.g. 4U 1543-47, Kalemci et al. 2005).
The PDS rms power for both energy bands fall rapidly during the initial outburst, as expected given the transition between the Hard State and the Steep Power-Law State which occurs on MJD 55467. In the Thermal State, QPOs are generally weak or absent (Remillard & McClintock, 2006), therefore the non-detection of QPOs after MJD 55474 is consistent with the evolution towards that state.
The XRT detected QPOs are consistent with those seen by RXTE (Kalamkar et al., 2011). Due to being on-source earlier than than RXTE, we detect lower frequency QPOs in the range of Hz to Hz in the time period of MJD 55464.35 to MJD 55467.88. The evolution in frequency over time of these QPOs is consistent with the extrapolation of the trend seen during RXTE observations between MJD 55467 and approximately MJD 55478.
UVOT data were also obtained in event mode between MJD 55472.1–55475.4 in , , and bands. Unbinned source light curves (not background subtracted), for each of these, were used to produce PDS and to calculate the rms variability with the HEASOFT tools powspec and lcstats respectively. Within each of these the binning was set to be times the minimum bin size (11.0322 ms) where for the PDS and (88.2576 ms) for the rms variability, giving frequency ranges of 0.006–90 Hz and 0.006–1 Hz respectively. Both the PDS and the rms imply a level of variability consistent with zero, though can only place a loose constraint of .
The XRT light-curve shows frequent dips, which do not appear to have a consistent shape or spectral signature. An example of a dipping episode, seen on MJD 55469, is shown in Figure 6, although it should be noted that this is not necessarily representative of other dips. The dipping shows two components that we differentiate by their spectral signature: a series of dips of varying timescales, with no apparent associated spectral change (non-hard dips), and a narrower sharp dip with an associated spectral hardening (hard-dip). Analysis of UVOT event data taken during dips do not show any evidence of correlated optical variability, although no event mode data was taken during a hard dip.

If, as Kuulkers et al. (2010b) suggest, the dips are analogous to those seen in a LMXB dipping source, we expect the spectral changes during dips can be explained by the addition of an absorbing component in the spectrum (e.g. Díaz Trigo et al. 2006). To check this we fit the hard dip spectrum for the event shown in Figure 6 utilizing the same spectral parameters for the power-law, disk and absorption components for MJD 55469 as shown in Figure 3, with the addition of a partial covering absorber (XSPEC pcfabs model). We find that the hard dip spectrum is well fit ( for degrees of freedom) by the addition of an additional partial covering absorber with cm-2 and a covering fraction of . We note that replacing the partial covering with a warm absorber model (XSPEC absori model) provides a slightly worse fit to the data ( for 34 degrees of freedom), suggesting that higher spectral resolution data would be required to determine the nature of the absorbing material. We therefore conclude that the spectral hardness changes seen during some of the dips events are likely caused by localized absorbing material in the disk.
To search for longer timescale periodicities, we used the Lomb-Scargle method (Lomb, 1976; Scargle, 1982), which is effective when analyzing unevenly sampled data. Longer term light-curve trends were removed by fitting a 3rd order polynomial. The resultant periodogram, derived from XRT WT data in the keV band, shows a strong peak at hours. This period is times the minute Swift orbital period, however given the closeness of our result to the RXTE measured periodicity (Belloni et al., 2010), we conclude that it is not an aliasing effect. No periodicity was detected in the UVOT data from this source, although as UVOT data were taken in non-event mode for the majority of the observations, the UVOT data are not sensitive to a 2.4 hr period.
Although periodic, the dip shapes are highly variable, suggesting that they may be caused by obscuration by optically thick clumps in the accretion flow, or an evolving bulge in the disk, rather than eclipsing by the companion star. Given this scenario, the 2.4 hour periodicity is likely the orbital period of MAXI J1659152.
4. Discussion
Without a measurement of for MAXI J1659152 it is difficult to place strong limits on the orbital parameters of the system from the Swift data alone. However, with knowledge of the period and other system parameters we can attempt to estimate distance and system geometry from theoretical and empirically derived relationships that have been established for LMXBs.
Given that in the X-ray light-curve we see dips but not eclipses, from the standard model of X-ray binary geometry of Frank et al. (1987), MAXI J1659152 is analogous to a “Pure Dipper”, which constrains the inclination to .
Frank et al. (2002) derive a simple relationship for the mass of the secondary star and the orbital period, , assuming that the companion star is filling its Roche Lobe and is an unevolved low-mass star. This gives us an estimate of the companion mass of . Smith & Dhillon (1998) also derive an empirical linear mass-period relationship, which for hours, gives , close to the previously derived value. Assuming a black-hole primary, , we estimate an upper limit on the mass ratio of .
The faintest optical magnitude of MAXI J1659152 seen by UVOT is mag on MJD 55598. As the out-of-outburst optical magnitude is fainter than , based on the non-detection in USNO-B catalog, this suggests that the optical counterpart has not been observed by UVOT in quiescence. Therefore we can make no estimate, from the UVOT data alone, of the brightness of the secondary star in this system. However, if we assume a main sequence companion, the relationship of spectral type versus period of Smith & Dhillon (1998) allows us to estimate that the companion is a M5 star.
M5 stars have typical absolute visual magnitudes of . Patterson (1984) derive a relationship for absolute visual magnitude of the companion star for a cataclysmic variable system as a function of the period, , assuming this relationship is valid for a BHB system, we estimate the brightness of the companion star to be . Given that in quiescence, this places a lower-limit on the distance of pc. Note that this distance does not include and any extinction correction, which would make this distance estimate lower.
However, the brightness of the X-ray outburst suggests that MAXI J1659152 is much more distant than this, as the peak outburst flux of relates to luminosity of at 631 pc for a black-hole mass of , and it is unlikely that the peak outburst would be so highly sub-Eddington. If we assume the peak flux of MAXI J1659152 equates to a BHB emitting at , we obtain a lower-limit on the distance of kpc.
van Paradijs & McClintock (1994) derive a relationship between the absolute visual magnitude of a LMXB as a function of the orbital period and the X-ray luminosity as a fraction of the Eddington Luminosity, , where . If we assume at maximum X-ray luminosity, , we calculate the maximum absolute visual magnitude based on this relationship as . The peak observed optical brightness for MAXI J1659152 is , which gives estimated distances in the range of kpc (assuming Galactic extinction, ) to kpc (no extinction).
As an alternative measure of distance, we use the Shahbaz & Kuulkers (1998) distance-period relationship for X-ray transients. With a peak outburst optical magnitude of , an estimated line-of-sight extinction of , and assuming the fraction of the optical emission in quiescence that comes from the companion star, , is , we obtain a lower-limit on the distance to MAXI J1659152 of kpc, consistent with the kpc derived above.
Given that the Galactic latitude of MAXI J1659152 is relatively high, , this would place the black-hole approximately at kpc, which is above average, but not unprecedented (for example XTE J1118480 is at kpc, Jonker & Nelemans 2004) and would place MAXI J1659152 in a sub-class of high- short period galactic BHB, along with XTE J1118480, GRO J042232 (e.g. Filippenko et al. 1995) and Swift J1753.60127 (e.g. Zurita et al. 2008) in the Galactic Halo.
Kong et al. (2010) suggest a counterpart for MAXI J1659152 with , based on archival data taken before the outburst. Given a color correction of for an M5 star, and the expected extinction of (Schlegel et al., 1998), we find an estimated magnitude for this counterpart of corrected for extinction. If we assume kpc, we derive an absolute magnitude for the companion of , too bright for an M5 star.
Shahbaz & Kuulkers (1998) find a relationship between the magnitude of the change in optical brightness of an X-ray transient in outburst and the orbital period, which predicts for a hour orbital period. The maximum UVOT observed -band brightness of MAXI J1659152 was , which would predict a quiescent optical brightness of . Correcting for extinction and assuming a distance of kpc, gives an absolute magnitude estimate for the quiescent optical emission of , consistent with the estimate that the companion star is an M5 dwarf, but inconsistent with the suggested -band counterpart. We therefore believe that the counterpart proposed by Kong et al. (2010) is likely an unrelated foreground object.
The rise to peak and slow decay of the optical emission appears to be anti-correlated with the measurement of the spectral hardness of the source, suggesting a strong link between the optical brightness and the emission state of MAXI J1659152. This, along with the similar outburst profile of the hard X-ray BAT and UVOT light-curves, suggests that the majority of the optical emission is correlated to the Comptonized component of the spectrum (e.g. from an optically thin jet that becomes fainter as the X-ray spectrum becomes more thermally dominated, Markoff et al. 2001), rather than thermal optical emission from the disk itself. The correlated X-ray/optical behavior seen in MAXI J1659152 is similar to the behavior observed previously in GX 3394 (Homan et al., 2005), although no rapid drop in the optical emission was detected as in that BHB. As the drop in optical flux in GX 3394 was consistent with the state transition to the Thermal State, the lack of such a drop in MAXI J1659152 is consistent with the fact that no such state transition was observed, and that the source remained in an intermediate state for the remainder of the Swift observations.
MAXI J1659152 shows a rapid rise of the measured absorption in the initial part of the outburst, which we believe is the evolution of a localized absorbing medium, rather than a statistical artifact of the fitting. This observed increase of intrinsic absorption in the early stage outburst may be an indication of absorption by a thermally driven wind from the accretion disk (e.g. Proga & Kallman 2002) or possibly a magnetic driven wind (e.g. Miller et al. 2006a). An evolving disk wind, has also been suggested as a mechanism for variable absorption seen in AGN (Gierliński & Done, 2004). However, we note that high resolution X-ray spectral studies of the BHB have suggested that disk winds are not present in BHBs in the Hard State (e.g. Blum et al. 2010), casting doubt on the disk-wind hypothesis during the early part of the outburst.
Variable absorption has been seen during the initial part of the outburst of the transient GS 2023338 (Życki et al., 1999), who suggested a powerful outflowing wind was the cause of the intrinsic emission. Unfortunately Swift/XRT data are not of sufficiently high spectral energy resolution to resolve the expected absorption features of a wind. If the source of the emission is due to ionized plasma above the disk, which has been suggested to be a common feature of LMXBs from observations of dipping sources (Díaz Trigo et al., 2006), it may also be the case that such an intrinsic absorption change may only be seen in sources with relatively high inclinations.
The fact that this absorption increase is seen only in the very earliest part of the rapid rise to outburst, means that it is likely a poorly studied phenomenon, given the difficulty in catching this early part of the outburst with an X-ray telescope with sufficient low-energy sensitivity to measure absorption, and the relatively short-lived timescale of the change ( days). Therefore we believe that even if this is a common feature of BHB outbursts, it would not be common to observe this feature without the rapid triggering and slewing capabilities of an soft X-ray observatory such as Swift, even if the rise of intrinsic absorption is a common feature in BHBs that are entering outburst. In this case, the Swift dataset on MAXI J1659152 represents a unique high cadence monitoring of the initial stages of a newly discovered BHB in outburst. For comparison another BHB that triggered BAT, Swift J1753.50127, was only observed once for a short 1.3 ks observation with XRT (Burrows et al., 2005b) in the first 6 days after it was discovered by BAT (Palmer et al., 2005).
The disk component of the spectrum shows significant evolution during the outburst, both in the fitted temperature and normalization. The normalization of the diskbb model is equivalent to , where is in units of kilometers, and is in units of 10 kpc, therefore although we cannot directly measure the inner radius without making assumptions about the inclination and distance to MAXI J1659152, changes in the normalization during the outburst give a direct measure of the magnitude of the change of the inner disk radius as a function of both time and temperature.
Between MJD 55465 and MJD 55475 the value of , the inner disk temperature, rises from to keV. In that time the normalization reduces from on MJD 55466 to , suggesting that the inner disk radius reduces by a factor of in approximately 3 days. Studies of the inner disk radius of BHBs during in different emission states have suggested a correlation of the fitted and , and the suggested dependence of radius and temperature is given by (Cabanac et al., 2009).
In Figure 7, we plot versus the , to demonstrate this correlation between the fitted temperature and the inner disk radius for MAXI J1659152. The best fit power-law model to these data is , lower than the expected , although the data are broadly consistent with the expected trend in the keV range. We clearly observe a trend of a decrease in the inner disk radius both with rising and with time, suggesting that accretion disk is undergoing a rapid in-fall during the outburst of MAXI J1659152.

In the period where the flux from the accretion disk is the dominant spectral component (MJD 55485 - MJD 55491, the latter date being due to the end of Swift observations), the average diskbb normalization is , and is statistically consistent with being constant during this time. If we assume that this minimum normalization corresponds an accretion disk with an at the innermost stable circular orbit (ISCO) of a non-spinning black-hole, then , where . We can estimate the mass of the black-hole by re-arranging Equation 4 of Cabanac et al. (2009) as . Utilizing this equation, the assumption that the inner disk radius is at the ISCO, our previously obtained lower-limit on the distance to MAXI J1659152 of kpc, and the allowed range of inclinations of , we find an estimated black-hole mass of to . This estimated mass is strongly dependent on the assumed radius of the ISCO, which in the case of a maximally spinning black-hole, can be as small as , therefore if we assume , this increases the estimated BH mass to to .
Larger distances increase the estimate of the black-hole mass. However, given the high galactic latitude, larger distances become increasingly unlikely due to the derived large distance of MAXI J1659152 above the Galactic Plane, e.g. kpc for kpc.
5. Conclusion
Swift and MAXI have discovered a new BHB, MAXI J1659152. Broadband high-cadence Swift monitoring of the outburst revealed the key spectral and timing signatures of BHBs, including the presence of time variable QPOs and spectral evolution of the transient through canonical states associated with BHBs. MAXI J1659152 has similarities to other BHBs, for example Swift J1753.50127, which has a similar outburst light-curve (Soleri et al., 2010) and the presence of a low-temperature disc component, with keV, during the Hard State (Miller et al., 2006b). The increasing flux contribution of the thermal disk component and rise of to keV suggests evolution to the Thermal State from the Steep Power-Law State, although no full state transition was seen before observations ended. As the disk component becomes more prominent and hotter, the radius of the inner disk edge of the accretion disk shrinks, approximately following the expected dependence predicted by Cabanac et al. (2009).
During the first day of observations, we recorded a rapid increase in the fitted , likely caused by localized absorption from an evolving disk wind. Optically, MAXI J1659152 shows a correlated rise with X-ray during the Hard State with brightness peaking at the transition between the Hard and Steep Power-Law states, followed by a decrease in the optical brightness while in an intermediate state.
We detect a hour periodicity in the X-ray light-curve. The structure of the associated dips is highly variable from orbit to orbit, suggesting periodic obscuration from the accretion disk or stream. If we assume this is the orbital period, it would make MAXI J1659152 the shortest orbital period BHB yet known, the previous being Swift J1753.50127 at 3.2 hours (Zurita et al., 2008). Given the likely distance of kpc, and the high galactic latitude, it is likely that MAXI J1659152, similar to Swift J1753.50127 and other short period BHBs, is a Galactic Halo BHB.
References
- Barthelmy et al. (2005) Barthelmy, S. D., et al. 2005, Space Sci. Rev., 120, 143
- Belloni et al. (2010) Belloni, T. M., Motta, S., Muñoz-Darias, T. 2010, The Astronomer’s Telegram, 2926
- Blum et al. (2010) Blum, J. L., Miller, J. M., Cackett, E., Yamaoka, K., Takahashi, H., Raymond, J., Reynolds, C. S., & Fabian, A. C. 2010, ApJ, 713, 1244
- Burrows et al. (2005a) Burrows, D. N., et al. 2005, Space Sci. Rev., 120, 165
- Burrows et al. (2005b) Burrows, D. N., Racusin, J., Morris, D. C., Roming, P., Chester, M., Verghetta, R. L., Markwardt, C. B., & Barthelmy, S. D. 2005, The Astronomer’s Telegram, 547
- Cabanac et al. (2009) Cabanac, C., Fender, R. P., Dunn, R. J. H., Körding, E. G. 2009, MNRAS, 396, 1415
- Chen et al. (1997) Chen, W., Shrader, C. R., & Livio, M. 1997, ApJ, 491, 312
- de Ugarte Postigo et al. (2010) de Ugarte Postigo, A., Flores, H., Wiersema, K., Thoene, C. C., Fynbo, J. P. U., & Goldoni, P. 2010, GRB Coordinates Network, Circular Service, 11307
- Díaz Trigo et al. (2006) Díaz Trigo, M., Parmar, A. N., Boirin, L., Méndez, M., & Kaastra, J. S. 2006, A&A, 445, 179
- Eachus et al. (1976) Eachus, L. J., Wright, E. L., & Liller, W. 1976, ApJ, 203, L17
- Evans et al. (2009) Evans, P. A., et al. 2009, MNRAS, 397, 1177
- Filippenko et al. (1995) Filippenko, A. V., Matheson, T., & Ho, L. C. 1995, ApJ, 455, 614
- Frank et al. (1987) Frank, J., King, A. R., & Lasota, J.-P. 1987, A&A, 178, 137
- Frank et al. (2002) Frank, J., King, A., & Raine, D. J. 2002, Accretion Power in Astrophysics (3rd Edition), Cambridge, UK: Cambridge University Press
- Gehrels et al. (2004) Gehrels, N., et al. 2004, ApJ, 611, 1005
- Gierliński & Done (2004) Gierliński, M., & Done, C. 2004, MNRAS, 349, L7
- Goad et al. (2007) Goad, M. R., et al. 2007, A&A, 476, 1401
- Homan et al. (2005) Homan, J., Buxton, M., Markoff, S., Bailyn, C. D., Nespoli, E., & Belloni, T. 2005, ApJ, 624, 295
- Jonker & Nelemans (2004) Jonker, P. G., & Nelemans, G. 2004, MNRAS, 354, 355
- Kalamkar et al. (2011) Kalamkar, M., Homan, J., Altamirano, D., van der Klis, M., Casella, P., & Linares, M. 2011, ApJ, 731, L2
- Kalberla et al. (2005) Kalberla, P. M. W., Burton, W. B., Hartmann, D., Arnal, E. M., Bajaja, E., Morras, R., Pöppel, W. G. L. 2005, A&A, 440, 775
- Kalemci et al. (2005) Kalemci, E., Tomsick, J. A., Buxton, M. M., Rothschild, R. E., Pottschmidt, K., Corbel, S., Brocksopp, C., & Kaaret, P. 2005, ApJ, 622, 508
- Kennea et al. (2010) Kennea, J. A., et al. 2010, The Astronomer’s Telegram, 2877
- King et al. (1996) King, A. R., Kolb, U., & Burderi, L. 1996, ApJ, 464, L127
- Kong et al. (2010) Kong, A. K. H., et al. 2010, The Astronomer’s Telegram, 2976
- Krimm et al. (2006) Krimm, H., et al. 2006, The Astronomer’s Telegram, 904
- Kuulkers et al. (2010a) Kuulkers, E., Kouveliotou, C., van der Horst, A. J. 2010a, The Astronomer’s Telegram, 2887
- Kuulkers et al. (2010b) Kuulkers, E., et al. 2010b, The Astronomer’s Telegram, 2912
- Leahy et al. (1983) Leahy, D. A., Darbro, W., Elsner, R. F., Weisskopf, M. C., Kahn, S., Sutherland, P. G., & Grindlay, J. E. 1983, ApJ, 266, 160
- Lomb (1976) Lomb, N. R. 1976, Ap&SS, 39, 447
- Mangano et al. (2010) Mangano, V., Hoversten, E. A., Markwardt, C. B., Sbarufatti, B., Starling, R. L. C., & Ukwatta, T. N. 2010, GRB Coordinates Network, Circular Service, 11296
- Makishima et al. (1986) Makishima, K., Maejima, Y., Mitsuda, K., Bradt, H. V., Remillard, R. A., Tuohy, I. R., Hoshi, R., & Nakagawa, M. 1986, ApJ, 308, 635
- Markoff et al. (2001) Markoff, S., Falcke, H., & Fender, R. 2001, A&A, 372, L25
- Matsuoka et al. (2009) Matsuoka, M., et al. 2009, PASJ, 61, 999
- Miller et al. (2006a) Miller, J. M., Raymond, J., Fabian, A., Steeghs, D., Homan, J., Reynolds, C., van der Klis, M., & Wijnands, R. 2006a, Nature, 441, 953
- Miller et al. (2006b) Miller, J. M., Homan, J., & Miniutti, G. 2006b, ApJ, 652, L113
- Miller et al. (2010) Miller, J. M. et al. 2010, ApJ, 724, 1441
- Monet et al. (2003) Monet, D. G., et al. 2003, AJ, 125, 984
- Negoro (2009) Negoro, H. 2009, Astrophysics with All-Sky X-Ray Observations, 60
- Negoro et al. (2010) Negoro H., et al. 2010, The Astronomer’s Telegram, 2873
- Palmer et al. (2005) Palmer, D. M., Barthelmey, S. D., Cummings, J. R., Gehrels, N., Krimm, H. A., Markwardt, C. B., Sakamoto, T., & Tueller, J. 2005, The Astronomer’s Telegram, 546
- Paragi et al. (2010) Paragi, Z., et al. 2010, The Astronomer’s Telegram, 2906
- Patterson (1984) Patterson, J. 1984, ApJS, 54, 443
- Pei (1992) Pei, Y. C. 1992, ApJ, 395, 130
- Poole et al. (2008) Poole, T. S., et al. 2008, MNRAS, 383, 627
- Proga & Kallman (2002) Proga, D., & Kallman, T. R. 2002, ApJ, 565, 455
- Roming et al. (2005) Roming, P. W. A., et al. 2005, Space Sci. Rev., 120, 95
- Remillard & McClintock (2006) Remillard, R. A., & McClintock, J. E. 2006, ARA&A, 44, 49
- Scargle (1982) Scargle, J. D. 1982, ApJ, 263, 835
- Schlegel et al. (1998) Schlegel, D. J., Finkbeiner, D. P., & Davis, M. 1998, ApJ, 500, 525
- Shahbaz & Kuulkers (1998) Shahbaz, T., & Kuulkers, E. 1998, MNRAS, 295, L1
- Smith & Dhillon (1998) Smith, D. A., & Dhillon, V. S. 1998, MNRAS, 301, 767
- Soleri et al. (2010) Soleri, P., et al. 2010, MNRAS, 406, 1471
- van der Horst et al. (2010) van der Horst, A. J., et al. 2010, The Astronomer’s Telegram, 2874
- van der Klis (1989) van der Klis, M. 1989, Timing Neutron Stars, 27
- van Paradijs & McClintock (1994) van Paradijs, J., & McClintock, J. E. 1994, A&A, 290, 133
- Vovk et al. (2010) Vovk, I., et al. 2010, The Astronomer’s Telegram, 2875
- Wilms et al. (2000) Wilms, J., Allen, A., & McCray, R. 2000, ApJ, 542, 914
- Zurita et al. (2008) Zurita, C., Durant, M., Torres, M. A. P., Shahbaz, T., Casares, J., & Steeghs, D. 2008, ApJ, 681, 1458
- Życki et al. (1999) Życki, P. T., Done, C., & Smith, D. A. 1999, MNRAS, 309, 561