Symmetry preserving lattice collapse in tetragonal SrFe2-xRuxAs2 ( = 0, 0.2) –
a combined experimental and theoretical study
Abstract
In a joint experimental and theoretical study, we investigate the isostructural collapse from the ambient pressure tetragonal phase to a collapsed tetragonal phase for non-superconducting metallic SrFe2As2 and SrFe1.8Ru0.2As2. The crystallographic details have been studied using X-ray powder diffraction up to 20 GPa pressure in a diamond anvil cell. The structural phase transition occurs at 10 GPa and 9 GPa for SrFe2As2 and SrFe1.8Ru0.2As2, respectively. The changes in the unit cell dimensions are highly anisotropic with a continuous decrease of the lattice parameter with pressure, while the -axis length increases until the transition to a collapsed tetragonal phase and then continues to decrease. Across the phase transition, we observe a volume reduction of 5% and 4% for SrFe2As2 and SrFe1.8Ru0.2As2, respectively. We are able to discern that Ru substitution on the Fe-site acts like ‘chemical pressure’ to the system. Density-functional theory-based calculations of the electronic structure and electron localizability indicator are consistent with the experimental observations. Detailed analysis of the electronic structure in -space and real space reveals As 4 interlayer bond formation as the driving force of the collapse with a change in the As-As bond length of about 0.35Å.
I Introduction
The surprising discovery of superconductivity in Fe-based pnictides and chalcogenides has steered and revived the interest in high-temperature superconductivity.Kamihara et al. (2008) Most of the superconducting members discovered in the past 3 years can be grouped into five families named by their parent compounds: (i) 1111 family – OFeAs/FeAsF ( = rare-earth, =alkaline-earth metal); (ii) 122 family – Fe2As2 ( = alkaline-earth or divalent rare-earth metal); (iii) 111 family – FeAs ( = alkali-metal); (iv) 11 family – FeSe(Te); (v) P22 family – Fe2As2 ( = perovskite-oxide like Sr4Sc2O6). The basic common feature of these new parent compounds is the FeAs building block separated by spacer layers comprising of the above mentioned alkali, alkaline-earth, rare-earth oxide/fluoride or a perovskite-oxide.Kamihara et al. (2008); Rotter et al. (2008); Jeevan et al. (2008a); Hsu et al. (2008); Ogino et al. (2009) Superconductivity is obtained by suitable doping of the parent compounds. For selected recent exhaustive overviews, we refer the readers to Refs. Johnston, 2010; Mizuguchi and Takano, 2010. The thickness of the spacer layers governs the extent of the quasi-two dimensional (2D) nature of the electronic structure. Using plasma frequencies as a tool to identify the ‘effective dimensionality’ among these systems, it has been shown that the 1111 systems are considerably more 2D than the 122 systems.Kasinathan et al. (2009) Interestingly, within these two families a correlation between the dimensionality and the superconducting transition temperature () can be construed, with the more 2D-like 1111 systems exhibiting a larger than the less anisotropic 122 systems.Kasinathan et al. (2009) Superconductivity in these systems upon the suppression of spin-density-wave (SDW) antiferromagnetic order of Fe can be realized via hole-doping, electron-doping, isovalent substitution, or pressure.Jeevan et al. (2008b); Rotter et al. (2008); Sefat et al. (2008); Leithe-Jasper et al. (2008a); Schnelle et al. (2009); Sharma et al. (2010); Miclea et al. (2009) In contrast to doping, high pressure techniques provide a cleaner route to modify the electronic structure without the added effects of chemical complexity.Chu and Lorenz (2009) Many of the high-pressure experiments were focused on investigating the suppression of the Fe-SDW order and the enhancement of . Recently, pressure-induced isostructural transitions from a paramagnetic tetragonal phase (T) to a collapsed tetragonal (cT) phase have been reported for several members of the 122 family: CaFe2As2, BaFe2As2, EuFe2As2, and EuCo2As2 (Refs. Kreyssig et al., 2008; Mittal et al., 2010; Uhoya et al., 2010a, b; Bishop et al., 2010; Goldman et al., 2009). The high electronic flexibility of compounds with the ThCr2Si2-type crystal structure can be related to the subtle interplay of covalent, ionic and metallic bonding contributions as has been outlined in several previous studies.Hoffmann and Zheng (1985); Gustenau et al. (1997a, b); Johrendt et al. (1997); Singh (2008, 2009); Subedi and Singh (2008); An et al. (2009) Hoffmann and ZhengHoffmann and Zheng (1985) also pointed out that in certain cases this might lead to structural phase transitions (see below). Indeed, these structural phase transitions of first and second order have been observed in many P2 compoundsHuhnt et al. (1998) between two crystallographically isostructural modifications with significantly different P-P distances along the tetragonal axis. Common to them are the dramatic and highly anisotropic changes in unit cell dimensions (changes of the tetragonal parameter by -10% and counteracting changes of by +2%, leading to a collapse of the unit cell volume) depending on temperature,Huhnt et al. (1997a) pressure,Huhnt et al. (1997b, 1998); Chefki et al. (1998); Ni et al. (2001) composition,Wurth et al. (1997) and chemical pressure.Jia et al. (2009) Curiously, the order of the phase transition (first or second-order) was suggested to be dependent on the transition metal atom (LaFe2P2 - first-order, LaCo2P2 - second-order).Huhnt et al. (1998) In contrast, recent experiments report the transition to be of second order for the arsenides EuAs2 ( = Fe, Co). More systematic studies are necessary to clarify the nature of these transitions, as well as to understand the underlying physics that accompany the formation of the cT-phase.
In our joint theoretical and experimental study on SrFe2As2 and the isovalent Ru substituted sample SrFe1.8Ru0.2As2, we attempt to address a multitude of issues. First we analyze the possibility of a T cT phase transition in these systems as has been suggested for many other compounds with ThCr2Si2-type crystal structure. Previous theoretical studiesKasinathan et al. (2009); Zhang et al. (2009a) have predicted a phase transition from the magnetically-ordered orthorhombic SDW phase to a tetragonal phase, but theoretical studies on T cT phase are rather cursory. Secondly, we address the nature of the chemical bonding in the 122-arsenides and compare it to the well studied 122-phosphides. Finally, we challenge the concept of chemical pressure by isovalent substitution of Fe by Ru and study the nature of the isostructural phase transition and the bonding situation of the pnictide. For an isovalent substitution on the Fe site, the As layers remain intact and unaffected from impurities arising from the substitution elements.
II Methods
Polycrystalline samples have been synthesized using solid-state reactions, similar to those described in Refs. Kasinathan et al., 2009; Schnelle et al., 2009. Samples were obtained in the form of sintered pellets. X-ray diffraction measurements (XRD) were performed at the high-pressure beam-line ID09 of the ESRF up to 20 GPa at room temperature for SrFe2As2 and SrFe1.8Ru0.2As2. For best possible hydrostatic conditions we used a membrane diamond anvil cell (DAC) with helium as pressure transmitting medium. The pressure was determined using the ruby fluorescence method. The measured powder rings were integrated using the program FIT2D.Hammersley et al. (1996) After a background correction the lattice parameters were determined with the FullProfRodríguez-Carvajal (1993) package.
Density-functional theory (DFT) based band-structure calculations were performed using a full-potential all-electron local-orbital code FPLOKoepernik and Eschrig (1999); Opahle et al. (1999) within both local density approximation (LDA) and as well as generalized gradient approximation (GGA). Relativistic effects were incorporated on a scalar-relativistic level. A well converged -mesh with 243 points in the full Brillouin zone was used. The crystal structures were optimized at different levels to investigate or isolate effects that may depend sensitively to certain structural features. The full-relaxation of the unit cell involves optimizing the ratios in addition to relaxing the (As) coordinate. The electron localizability indicator/function (ELI/ELF) was evaluated according to Ref. Kohout, 2004 with an ELI/ELF module implemented within the FPLO program package.Ormeci et al. (2006) The topology of ELI was analyzed using the program Basin Kohout (2008) with consecutive integration of the electron density in basins, which are bound by zero-flux surfaces in the ELI gradient field. This procedure, similar to the one proposed by Bader for the electron density Bader (1990) allows to assign an electron count for each basin.
III Results and Discussion
III.1 Symmetry preserving lattice collapse
III.1.1 Experiment: SrFe2As2
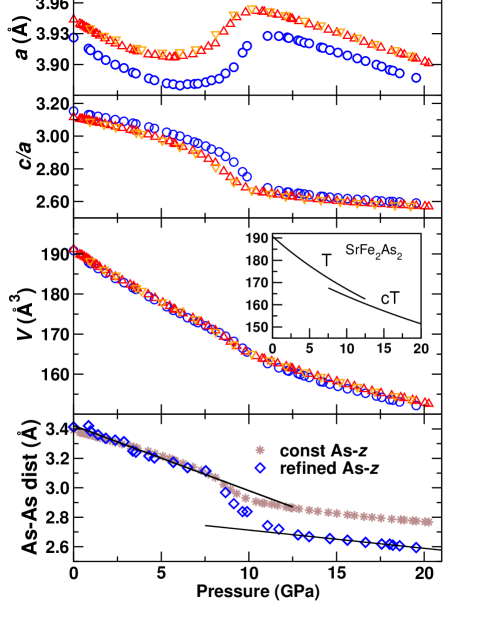
Collected in Fig. 1 are the measured tetragonal lattice parameters a and c, the axial ratio c/a and the unit cell volume as a function of pressure for the parent compound SrFe2As2 (the 10% Ru-doped SrFe1.8Ru0.2As2 will be addressed later in this report). For SrFe2As2, the lattice parameters a and c show an initial decrease with pressure up to 5 GPa. Upon further increase in pressure, anomalous compression effects are observed with the lattice parameter expanding rapidly up to around 10 GPa, while the lattice parameter continues to decrease. At this juncture a strong decrease is witnessed in the c lattice parameter to smaller values (a transition from a TcT phase), after which a normal compression behavior is observed up to 20 GPa. The c/a ratio as a function of pressure shows the onset of the structural phase transition around 101 GPa from a T-phase (with c/a 2.85) to a cT-phase (with c/a 2.65). Please refer to Table. 1 and 2 in the supplementary information for more details.
Similarly, an abrupt change in the interlayer As-As distance was observed. However, this change of the interlayer distance can be acounted for only partially by the change of the lattice parameter (see Fig. 1, lower panel). This distance decreases from the rather large value of 3.41 Å (at ambient pressure) to a value of 2.59 Å (at the highest measured pressure of 19.6 GPa). Similar interatomic distances are found for example in skutterudite CoAs3 (2.49/2.56 Å)Mandel and Donohue (1971) or filled skutterudite LaFe4As12 (2.57/2.58 Å).Braun and Jeitschko (1980) These values are only slightly larger than the single-bond distance of 2.52 Å occurring in -As.Donohue (1974) The collapse of the lattice is in turn, also accompanied by a simultaneous pronounced decrease of the Sr-As distances and Fe-As distances by about 12% and 4%, respectively, as well as the angles in the FeAs4 tetrahedron (see supplementary information). Electronic structure calculations have shown that even minute shifts in (As) and thus the resulting Fe-As distances have strong impact on the occupation of the Fe 3 orbitals, and therefore, the magnetic behavior in the Fe2As2 phases.Krellner et al. (2008); Goldman et al. (2009) These effects should become even more magnified during the observed phase transition. In contrast, under applied external pressures up to 6 GPa, a pronounced robustness of the Fe-As bonds is recognized for BaFe2As2Kimber et al. (2009) which crystallizes with a significantly larger ratio of 3.35. However, the Ba-As distances significantly contract (about 3%). Nevertheless, no indications of an onset of a lattice collapse were detected for this compound.
The measured pressure-volume data were fit using a Birch-Murnaghan equation of state for the two separate phases (shown as an inset in Fig. 1). The obtained equilibrium volume , bulk modulus and its pressure derivative for the tetragonal phase (0 - 8.6 GPa) are = 190.7 Å3, = 63.63 GPa and = 2.51, respectively, and for the collapsed tetragonal phase (11 - 19.5 GPa) are = 180.8 Å3, = 89.57 GPa and = 2.51, respectively. Our observation of the T cT-phase transition in SrFe2As2 along with the anisotropic compressibility phenomena is akin to the reports on other 122 arsenides As2 ( = Ca, Ba, Eu; = Fe, Co).Kreyssig et al. (2008); Mittal et al. (2010); Uhoya et al. (2010a, b); Bishop et al. (2010); Goldman et al. (2009)
III.1.2 Calculations: SrFe2As2
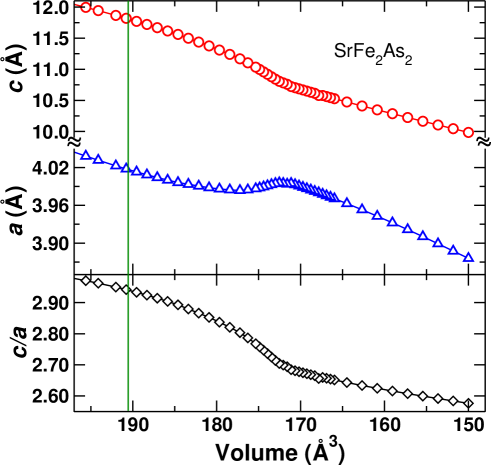
Previous work on the tetragonal collapse in other members of the Fe2As2 family ( = Ca, Ba, and Eu) have mostly been experimental studies.Uhoya et al. (2010b); Mittal et al. (2010); Uhoya et al. (2010a); Bishop et al. (2010) Analysis of the electronic structure of the Fe-As-based systems using band structure calculations has been quite successful in describing certain ‘general trends’ like the tetragonal to orthorhombic structural distortion, reduction in the magnetic moment as a function of doping, etc., though DFT is less accurate in reproducing certain details like the Fe-As bond length.Kasinathan et al. (2009) In 2009, Yildirim reported on results from first-principles calculations for CaFe2As2 and noted that the formation of the cT-phase is controlled by the Fe-spin state.Yildirim (2009) He suggested that pressure reduces the Fe-spin moment which in turn weakens Fe-As bonding and strengthens As-As interaction and therefore causes the collapse of the lattice parameters. Here, also using first-principles calculations, we de-couple Fe magnetism from the chemical bonding scenario and elucidate the bond formation as the key feature. To realize this, we calculated the change in the ground state energy as a function of volume employing both LDA and GGA and using the tetragonal symmetry without invoking spin degrees of freedom explicitly. At each volume two kinds of optimization were performed, one in which only the ratio was optimized and another in which a simultaneous optimization of the (As) position was additionally carried out. Collected in Fig. 2 are the and lattice parameter and the ratio as a function of volume obtained using the LDA with only optimization (refer to Fig. 1. in the supplementary information for details regarding the GGA calculations and the effects of (As) optimization). The calculations reproduce the experimental results including the transition from the ambient pressure T-phase to the cT-phase for SrFe2As2 in accord with a dramatic jump in the axial ratio from 2.85 2.65. Our calculations also reproduce the observed anomalous expansion of the lattice parameter under pressure. This is the first theoretical observation of the anomalous expansion phenomena for the FeAs family of materials. By fitting the energy-volume () curves to two separate Birch-Murnaghan equations of state (EOS) fits (not shown here), we obtain a transition pressure of 111 GPa. The pressure () is obtained from the volume derivative of the EOS, which is inverted to get . Equating the enthalpies of the two phases gives the transition pressure. The calculated value is in good agreement with the experimental value of 101 GPa. Calculations using GGA (refer to Fig. 1. in supplementary information) with only optimization give essentially the same trend for , and as described above for LDA.
Relaxing additionally the (As) position worsens the quantitative description for both LDA and GGA. This behavior is not surprising because, as mentioned previously, the Fe-As bond length is quite sensitive and DFT fails in accurately reproducing the experimental Fe-As bond length even for ambient conditions.Mazin et al. (2008); Johannes and Mazin (2010) Another inadequacy of DFT that is worth mentioning here is the equilibrium volume. It is well known that LDA and GGA usually underestimate and overestimate, respectively, the equilibrium volume by just a few percent as compared to experiments. For SrFe2As2 both LDA and GGA underestimate the equilibrium volume by 17% and 10%, respectively. This is quite unusual and at present there exists no conclusive reasoning for such a behavior. One possible explanation that is gaining more acceptance is the presence of a nematic order, which is unaccessible using the present-day DFT tools.Mazin and Johannes (2009)
III.1.3 Experiment: SrFe1.8Ru0.2As2
Similar to hydrostatic external pressure, studies on the effects of substitution on the transition metal Fe-site also show anisotropic changes in the lattice parameters, with a significant contraction of the -axis length as compared to .Schnelle et al. (2009); Leithe-Jasper et al. (2008a); Sefat et al. (2008); Li et al. (2009) For example, substitution of Fe with the isovalent, but larger Ru atom does not introduce any additional charge into the system and is suggested to simulate the effect of ‘chemical pressure’, alluding to the possibility of observing a T cT-phase transition in this substitution series. For the substitution series SrFe2-xRuxAs2 (), a significant but monotonous contraction of the lattice parameter was reported, though no clear phase transition from a T cT-phase was observed.Schnelle et al. (2009) The lack of a phase transition in SrFe2-xRuxAs2 could be a consequence of substitutional disorder in the samples and the model of a chemically induced pressure volume effect is most likely an oversimplified assumption.Rotter et al. (2010) Nevertheless, we wanted to discern the idea of Ru substitution acting as a ‘chemical pressure’. To this end, we have collected the pressure dependence of the structural parameters , , and unit cell volume for a 10% Ru-doped sample SrFe1.8Ru0.2As2 (see Fig. 1). We have chosen a rather small Ru content to keep the impurity/disorder effects to a minimum. At room temperature and pressure, SrFe1.8Ru0.2As2 is in the T-phase with a 3.1. Similar to the parent compound, this sample is also metallic and non-superconducting at ambient pressure. Upon application of pressure, the system also shows a transition to a cT-phase, though the transition pressure is shifted downwards ( 91 GPa) as compared to SrFe2As2 (please refer to Table. 3 and 4 in supplementary information for more details). A fit to a Birch-Murnaghan equation of state was done for the tetragonal and the collapsed tetragonal phases. The obtained equilibrium volume, bulk modulus and its pressure derivative for the tetragonal phase (0-7.3 GPa) are = 191.2 Å3, = 63.3 GPa and = 2.85, respectively, and for the collapsed tetragonal phase (9-20 GPa) are = 183.1 Å3, = 83.6 GPa and = 2.86, respectively. Comparing the experimental results of SrFe2As2 and SrFe1.8Ru0.2As2, we can now perceive that the 10% Ru substitution did indeed act as a ‘chemical pressure’ in the sample and reduced the external pressure needed for inducing a T cT-phase transition in SrFe1.8Ru0.2As2 to 9 GPa as compared to the 10 GPa pressure needed for the (Ru-free) SrFe2As2 sample.
III.1.4 Calculations: SrRu2As2
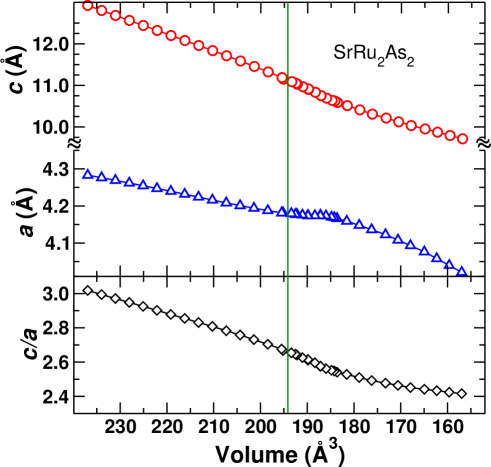
The bonding scenario for Ru in the end member of the substitution series, SrRu2As2 is similar to that of Fe in SrFe2As2. Moreover, SrRu2As2 is non-magnetic at ambient conditions in contrast to the paramagnetic SrFe2As2. Analyzing the effects of external pressure in SrRu2As2 will therefore isolate all other parameters and provide a purely chemical picture of the transition. The ratio of SrFe2As2 is 3.15 at ambient conditions, and is 2.65 for the cT phase. On the contrary, SrRu2As2 has a ratio 2.68 at room temperatureNath et al. (2009) and ambient pressure, and therefore is already in the cT-phase at ambient conditions. Therefore, the effect of external pressure on SrRu2As2 must be much weaker compared to SrFe2As2. Collected in Fig. 3 are the changes in the lattice parameters , and obtained from LDA calculations as a function of volume. Both and decrease rather monotonously with the decrease in volume and do not show any intermediate anamolous expansion of the lattice parameter. Moreover, in contrast to the calculated results obtained above for SrFe2As2 and in accordance to the generally accepted trend, LDA slightly underestimates and GGA (Fig. 2. in supplementary information) slightly overestimates the equilibrium volume with respect to the experiment.Nath et al. (2009); Schnelle et al. (2009)
Since this phase transition is not connected with a change in the symmetry, the nature of the transition can be first, second order, or even a continuous crossover. Moreover, the transition might be first order at = 0, but if the critical end point terminating the cT() phase boundary line is below 300 K, one would only observe a continuous crossover at 300 K. The signatures expected for a first order transition, a second order one, and a crossover are respectively a jump, a jump in the derivative, and an S-shaped behavior in the relevant property, in the present case, the ratio. The data presented in Fig. 1 do not evidence a sharp jump, instead they clearly suggest a jump in the derivative , especially for pure SrFe2As2. Thus the present data indicate the transition in SrFe2As2 to be of second order type, instead of the well-established first order type in CaFe2As2.Kreyssig et al. (2008) This difference between CaFe2As2 and SrFe2As2 is in line with LDA calculations for the difference in the evolution of the total energy as a function of decreasing volume and , where a second local minimum in is much more pronounced in CaFe2As2 than in SrFe2As2.Kasinathan et al. (2009)
III.2 Chemical bonding
Ternary compounds crystallizing with the tetragonal ThCr2Si2 type of structureBan and Sikirica (1965) are numerousVillars (1997); Just and Paufler (1996) and have been the focus of experimental and theoretical studies in solid state sciences since several decades.Szytuła and Leciejewicz (1989) This research originated with investigations on the Si and Ge-based family of compounds,Ban and Sikirica (1965); Bodak et al. (1965); Parthé and Chabot (1984) and later embraced pnictogens as elements.Schlenger et al. (1971); Mewis (1977); Marchand and Jeitschko (1978); Jeitschko and Jaberg (1980); Pfisterer and Nagorsen (1983) That pnictogen-based members of this family of compounds are always good for a surprise has already been recognized with the discovery of superconducting LaRu2P2 (= 4.1 K) more than two decades ago.Jeitschko et al. (1987) The crystal structure comprises of layers with edge-sharing tetrahedra parallel to the plane. These layers are additionally separated by planes of metal atom (as can be seen in Fig. 7). Systematic structural and chemical observations early on have resulted in classifying the A compounds adopting the ThCr2Si2 structure type into two branches: (i) One, with a three-dimensional network built up of tetrahedral layers, held together by bonds along the axis (two apex atoms from 2 adjacent layers form the bond), with the atoms embedded between these layers. This structural peculiarity has been mainly observed for silicides and germanides.Just and Paufler (1996) This branch is usually described as the ThCr2Si2 or CeGa2Al2 type. (ii) The other branch exhibits a rather two-dimensional layered structure with large separations between the atoms along the axis. This branch is described as the TlCu2Se2 type. Interestingly, depending on the transition metal , compounds containing pnictogens (well documented for phosphides) have been found to belong to both branches and to intermediate cases. Variation and substitution of the transition metal (increasing the number of electrons) or the metal atom have been discovered as a means of tuning this structural peculiarity by causing a shrinkage of the distances and bringing species in close bonding contacts. Furthermore, it had also been discerned that the geometrical constraints due to the changes in the sizes of the constituent atoms alone was not adequate to facilitate the bond formation. These analyses early on evoked questions about the electronic structure governing the underlying bonding situationsMewis (1980); Jeitschko and Jaberg (1980) and the observed physical properties.Jeitschko and Reehuis (1987); Pfisterer and Nagorsen (1983); Reehuis et al. (1998) Absence of pnictogen-pnictogen bonds indicated by large rations leads to a composite-like structural arrangement of the [] layers held together by more or less ionic interactions mediated by the electropositive cations. Members of the TlCu2Se2 branch could therefore be qualitatively described within the Zintl conceptSchaefer et al. (1973) by assigning a formal oxidation number -3 to the most electronegative element (pnictogen) resulting in a polyanion []2- counterbalanced by a cation (e.g. Sr2+Fe2+Fe2+P3-P3-). In contrast, compounds of the TlCu2Se2 family exhibiting pnictogen-pnictogen bonds are preferentially formed by the late transition metals. The corresponding qualitative view in light of the Zintl concept is now based on diatomic []4- entities (e.g. Ca2+Ni1+Ni1+[P2]4- as discussed in Refs. Jeitschko et al., 1987; Jeitschko and Reehuis, 1987). However, regarding the bonding interactions a slightly different trend was inferred from atomic distances and occupation of simple and idealized molecular orbital schemes, suggesting a more pronounced covalency for Fe-Fe bonds than for Ni-Ni bonds (Refs. Hofmann and Jeitschko, 1984; Jeitschko et al., 1985; Hofman and Jeitschko, 1985). In a similar way of reasoning the chemical bonding was qualitatively rationalized in As-based compounds.Jeitschko and Reehuis (1987); Pfisterer and Nagorsen (1983) Hoffmann highlighted this genuine occurrence of making and breaking of a diatomic () bond in the solid state for the A structures, and pioneered the investigation of the chemical bonding situation in phosphides based on extended Hückel calculations, discovering structural flexibility due to a subtle interplay between pnictogen-pnictogen and pnictogen-metal bonding with the additional ingredient of packing requirements of the large atoms.Hoffmann and Zheng (1985)
III.2.1 Chemical bonding in -space
In order to investigate the development of an interlayer chemical bond between As orbitals in SrFe2As2 as we go from the ambient pressure T-phase to the cT-phase, we analyze the orbital character of the band structure (“fat bands”). Usually, fat bands are obtained by suitable projection of the extended wave function onto test orbitals with a certain character, which in a local-orbital code naturally are chosen to be the local orbitals themselves. Atom-centered projectors do not probe the phase relations between different sites, though. In order to obtain this phase information, which contains the chemical interpretation in terms of bonding characteristics, projectors are needed, which contain several sites. We choose projectors, which include As 4 orbitals of a pair of As atoms sitting on top of each other across the Sr interlayer spacer. The two combinations are bonding and antibonding within the pair. Here, the negative sign gives bonding because of the odd parity of the -orbitals. The corresponding fat bands probe the phase correlation between the two As orbitals but do not probe the phase between pairs of As atoms within the layer. Due to the unitarity of the transformation from orbitals to projectors the resulting bonding and anti-bonding orbital weights sum up to the “standard” orbital-projected weights, which opens not only the possibility to analyse the band structure but also the projected density of states according to bonding characteristics.
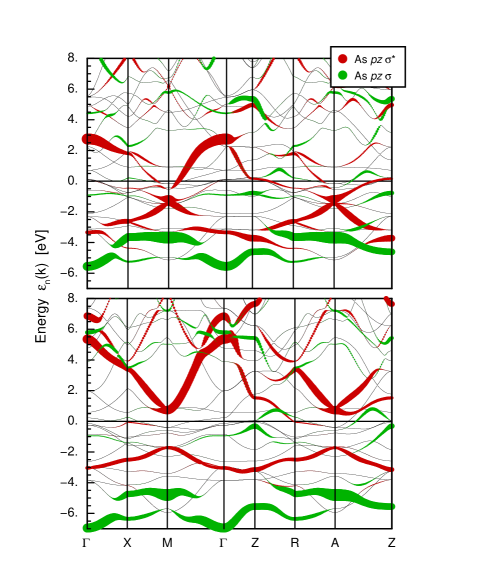
Fig. 4 shows the and fat bands for the ambient pressure T-phase and for the high pressure cT-phase of SrFe2As2. In both phases the bonding part of the 4 bands (green or light grey) are mostly occupied. In the T-phase the antibonding bands are significantly occupied, while they get pushed up close to and above the Fermi level in the cT-phase. There is one antibonding band remaining below the Fermi level, however the total weight of occupied antibonding bands is strongly reduced for the cT-phase as compared to the T-phase.
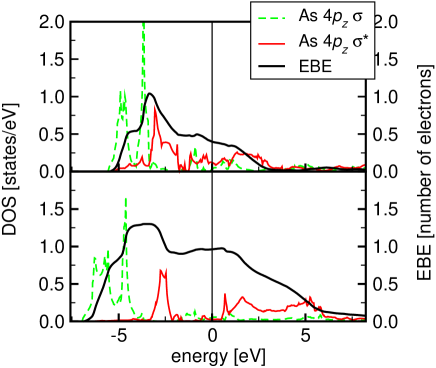
In order to quantify the bond strength we plot the difference of the integrated and projected density of states (DOS) along with the projected DOS in Fig. 5. In an idealized case of completely occupied bonding and completely unoccupied antibonding states this difference of energy-resolved occupations will be monotonously increasing up to a value of two (spin degeneracy) at the chemical potential, signifying that two electrons form the bond, and will monotonously decrease with increasing energy away from the Fermi level, to reach zero if all bands are filled with a total number of four electrons. The value of this difference occupation at the Fermi level is an estimate of chemical binding in terms of excess bonding electrons (EBE). Fig. 5 shows that the number of EBE is only 0.4 in the T-phase but is reaching nearly 1 in the collapsed phase. It turns out that the number of EBE increases by immediately before the collapse occurs, showing that the driving force of the collapse is the onset of 4 interlayer bond formation.
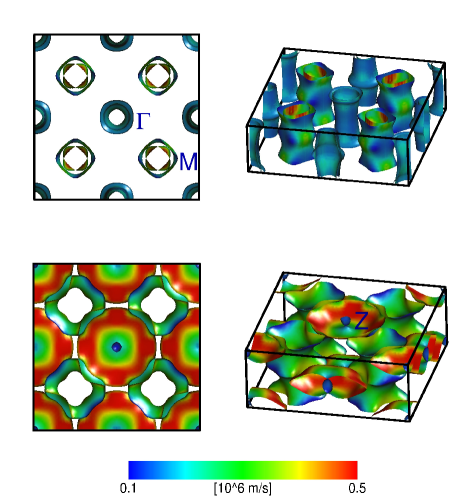
Returning to the band structure, besides the increased band width in the cT-phase compared to T-phase, there are additional changes occuring at the Fermi level. In the T-phase there is a strongly antibonding band starting at -0.5 eV at the M-point going to 3 eV at the -point. This band is hybridized with the Fe 3 orbitals. In the cT-phase this particular band now begins at around 1eV above the Fermi level and has a larger dispersion going up to 7 eV. Most importantly, this band that formed a Fermi surface in the T-phase, gets removed from the Fermi level for the cT-phase, which results in a change of the Fermi surface topology (Fig. 6). In general the Fe bands do not change as drastically as the As bands across the transition. Most notably the Fe band width is not following the strong increase of the As band width. From a chemical point of view, the Fe layer stays inactive in the collapse. However, from a physical point of view, the Fe bands, especially the Fermi surface, changes from a 2D to a 3D system. Of the two cylindrical sheets around the M-point (T-phase) only one remains after the collapse, while of the three cylinders around one vanishes, the second becomes a very small pocket, and the third forms a large pocket around the Z-point. This large pocket shows a quite 3-dimensional distribution of Fermi velocities. The plasma frequencies change from eV and eV in the T-phase to eV and eV in the cT-phase. In fact the ratio between in-plane and out-of-plane plasma frequencies goes from to . Interestingly, the individual bands behave rather differently. The still more cylindrical band around M has a ratio while the pocket around Z has , which makes this band actually tend to be more one-dimensional along the axis, which is another aspect in the formation of interlayer As-As bonds.
III.2.2 Chemical bonding in real space
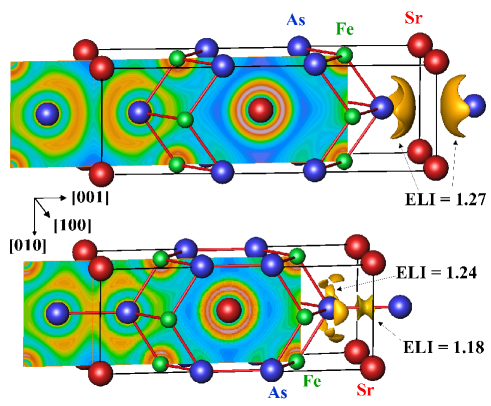
The electron localizability indicator (ELI, ) was evaluated in the ELI-D representation according to Refs. Kohout, 2004, 2007 with an ELI-D module. The ELI-D distribution for the ambient condition T-phase shown in the upper panel of Fig. 7 has four distinct features. The valence (5th) shell of the Sr atoms is absent suggesting the formation of the Sr cation and the transfer of these electrons to the [Fe2As2] anion. The penultimate (fourth) shell of Sr is not specially structuredWagner et al. (2007); Kohout et al. (2002) indicating that the electrons of this shell do not participate in the bonding interactions in the valence region. Between the As atoms, two distinct maxima of ELI-D are observed illustrating the absence of As-As bonds and the non-bonding (lone-pair-like) interaction between the neighboring [Fe2As2] anions. The structuring of the penultimate (third) shell of the Fe atoms towards the closest As is the fingerprint of the Fe-As bonding within this anion. For the high-pressure cT-phase (lower panel of Fig. 7) in addition to the Coulomb interaction between the Sr cations and the [Fe2As2] anions, there is also bonding by the electrons of the penultimate (fourth) Sr shell (cf. structuring of this shell in Fig. 7, lower panel). This observation is similar to the one for Eu in EuRh2Ga8.Sichevych et al. (2009). The distinct maxima found close to the Fe-As contacts (ELI-D isosurface with =1.24) shows the formation of covalent bonds within the [Fe2As2] anion. The formation of the As-As bonds between the neighboring anions is visualized in real space by a concentration of ELI-D close to the middle point of the As-As contact (ELI-D isosurface with =1.18), which is very similar in topology to the ELI-D distribution in the simple example of the F2 molecule.Wagner et al. (2008); Bezugly et al. (2010)
IV Summary
In conclusion, we have studied the transition under high pressure from a tetragonal (T) to a collapsed tetragonal (cT) phase in SrFe2As2 and SrFe1.8Ru0.2As2, using diamond anvil cells and powder XRD measurements up to 20 GPa at room temperature. We observe an isostructural phase transition from a T-phase to a cT-phase at 10 GPa for SrFe2As2 and at 6 GPa for SrFe1.8Ru0.2As2. Both materials show an anomalous compression behavior (anisotropic changes in the unit cell dimensions) under pressure with the lattice parameter decreasing continuously while the lattice parameter increases for a certain pressure range. Our observation is akin to previous reportsKreyssig et al. (2008); Mittal et al. (2010); Uhoya et al. (2010a, b); Bishop et al. (2010) on other 122 systems As2 ( = Ca, Ba, Eu; = Fe, Co). From our experiments, we note that Ru substitution of the Fe-site works as ‘chemical pressure’ thereby reducing the amount of external pressure needed to obtain the T cT-phase transition in SrFe1.8Ru0.2As2. Band structure calculations reproduce the isostructural phase transition observed in experiments, including the anisotropic changes in the unit cell dimensions. Detailed analyses in -space (Fermi surfaces, band structure and density of states) and as well as in real space (ELI-D) of the bonding scenario within and between the FeAs layers in both the T and cT-phases presently provides a comprehendible picture of the driving force behind the observed lattice collapse. The actual phase transition can be rationalized in the following way. Since the covalently bonded rather rigid transition metal-pnictogen layers are separated by the large cations (e.g. Sr2+), short As-As bonds along the axis cannot be formed due to geometric reasons in the ambient pressure T-phase. The predominantly ionic interaction between the cations and the polyanion makes these layered compounds soft along the stacking axis. Thus, applying pressure leads to a decrease of the distance between the layers and therefore the As-As separation. When a critical As-As distance is reached to enable a sufficiently high enough orbital overlap of the 4 orbitals, promptly the bonding interactions dominate and the phase transition occurs. Similar to the case previously studied for phosphorus-based compounds,Johrendt et al. (1997); Huhnt et al. (1997a) electronic structure calculations outline a scenario where a stabilization of the As-As bonding states stabilize Fe-As antibonding states which have lifted up the former ones to energies near the Fermi level. Consequently, the Fe-As bonds become weaker and the lattice parameter increases whereas decreases at the phase transition.
Acknowledgement
We acknowledge stimulating discussions with W. Schnelle. This research has been partly funded by DFG within SPP 1458. We thank H. Borrmann and U. Burkhardt for performing powder X-ray diffraction and metallographic characterization as well as EPMA of the samples used in this study.
References
- Kamihara et al. (2008) Y. Kamihara, T. Watanabe, M. Hirano, and H. Hosono, J. Am. Chem. Soc 130, 3296 (2008).
- Rotter et al. (2008) M. Rotter, M. Tegel, and D. Johrendt, Phys. Rev. Lett. 101, 107006 (2008).
- Jeevan et al. (2008a) H. S. Jeevan, Z. Hossain, D. Kasinathan, H. Rosner, C. Geibel, and P. Gegenwart, Phys. Rev. B 78, 092406 (2008a).
- Hsu et al. (2008) F. C. Hsu, J. Y. Luo, K. W. Yeh, T. K. Chen, T. W. Huang, P. M. Wu, Y. C. Lee, Y. L. Huang, Y. Y. Chu, D. C. Yan, et al., Proc. Natl. Acad. Sci. USA 105, 14262 (2008).
- Ogino et al. (2009) H. Ogino, Y. Matsumura, Y. Katsura, K. Ushiyama, S. Horii, K. Kishio, and J. Shimoyama, Supercond. Sci. Technol. 22, 075008 (2009).
- Johnston (2010) D. C. Johnston, Adv. Phys. 59, 803 (2010).
- Mizuguchi and Takano (2010) Y. Mizuguchi and Y. Takano, J. Phys. Soc. Jpn. 79, 102001 (2010).
- Kasinathan et al. (2009) D. Kasinathan, A. Ormeci, K. Koch, U. Burkhardt, W. Schnelle, A. Leithe-Jasper, and H. Rosner, New J. Physics 11, 025023 (2009).
- Jeevan et al. (2008b) H. S. Jeevan, Z. Hossain, D. Kasinathan, H. Rosner, C. Geibel, and P. Gegenwart, Phys. Rev. B 78, 052502 (2008b).
- Sefat et al. (2008) A. S. Sefat, R. Jin, M. A. McGuire, B. C. Sales, D. J. Singh, and D. Mandrus, Phys. Rev. Lett. 101, 117004 (2008).
- Leithe-Jasper et al. (2008a) A. Leithe-Jasper, W. Schnelle, C. Geibel, and H. Rosner, Phys. Rev. Lett. 101, 207004, (2008a).
- Schnelle et al. (2009) W. Schnelle, A. Leithe-Jasper, R. Gumeniuk, U. Burkhardt, D. Kasinathan, and H. Rosner, Phys. Rev. B 79, 214516 (2009).
- Sharma et al. (2010) S. Sharma, A. Bharati, S. Chandra, V. R. Reddy, S. Paulraj, A. T. Satya, V. S. Sastry, A. Gupta, and C. S. Sundar, Phys. Rev. B 81, 174512 (2010).
- Miclea et al. (2009) C. F. Miclea, M. Nicklas, H. S. Jeevan, D. Kasinathan, Z. Hossain, H. Rosner, P. Gegenwart, C. Geibel, and F. Steglich, Phys. Rev. B 79, 212509 (2009).
- Chu and Lorenz (2009) C. W. Chu and B. Lorenz, Physica C 469, 385 (2009).
- Kreyssig et al. (2008) A. Kreyssig et al., Phys. Rev. B 78, 184517 (2008).
- Mittal et al. (2010) R. Mittal, S. K. Mishar, S. L. Chaplot, S. V. Ovsyannikov, E. Greenberg, D. M. Trots, L. Dubrovinsky, Y. Su, T. Brueckel, S. Matshishi, et al. (2010), arXiv:1007.2320.
- Uhoya et al. (2010a) W. Uhoya et al., Phys. Rev. B 82, 144118 (2010a).
- Uhoya et al. (2010b) W. Uhoya, G. Tsoi, Y. K. Vohra, M. A. McGuire, A. S. Sefat, B. C. Sales, D. Mandrus, and S. T. Weir, J. Phys.: Condens. Matter 22, 292202 (2010b).
- Bishop et al. (2010) M. Bishop, W. Uhoya, G. Tsoi, Y. K. Vohra, A. S. Sefat, and B. C. Sales, J. Phys.: Condens. Matter 22, 425701 (2010).
- Goldman et al. (2009) A. I. Goldman et al., Phys. Rev. B 79, 024513 (2009).
- Hoffmann and Zheng (1985) R. Hoffmann and C. Zheng, J. Phys. Chem. 89, 4175 (1985).
- Gustenau et al. (1997a) E. Gustenau, P. Herzig, and A. Neckel, J. Solid State Chem. 129, 147 (1997a).
- Gustenau et al. (1997b) E. Gustenau, P. Herzig, and A. Neckel, J. Alloys Compounds 262-263, 516 (1997b).
- Johrendt et al. (1997) D. Johrendt, C. Felser, O. Jepsen, O. K. Andersen, A. Mewis, and J. Rouxel, J. Solid State Chem. 130, 254 (1997).
- Singh (2008) D. J. Singh, Phys. Rev. B 78, 094511 (2008).
- Singh (2009) D. J. Singh, Phys. Rev. B 79, 153102 (2009).
- Subedi and Singh (2008) A. Subedi and D. J. Singh, Phys. Rev. B 78, 132511 (2008).
- An et al. (2009) J. An, A. S. Sefat, D. J. Singh, and M.-H. Du, Phys. Rev. B 79, 075120 (2009).
- Huhnt et al. (1998) C. Huhnt, W. Schlabitz, A. Wurth, A. Mewis, and M. Reehuis, Physica B 252, 44 (1998).
- Zhang et al. (2009a) Yu-Zhong Zhang, Hem C. Kandpal, Ingo Ophale, Harald O. Jeschke, Roser Valenti, Phys. Rev. B 80, 094530 (2009).
- Huhnt et al. (1997a) C. Huhnt, G. Michels, M. Roepke, W. Schlabitz, A. Wurth, D. Johrendt, and A. Mewis, Physica B 240, 26 (1997a).
- Huhnt et al. (1997b) C. Huhnt, W. Schlabitz, A. Wurth, A. Mewis, and M. Reehuis, Phys. Rev. B 56, 13796 (1997b).
- Chefki et al. (1998) M. Chefki, M. M. Abd-Elmeguid, H. Micklitz, C. Huhnt, W. Schlabitz, M. Reehuis, and W. Jeitschko, Phys. Rev. Lett. 80, 802 (1998).
- Ni et al. (2001) B. Ni, M. M. Abd-Elmeguid, H. Micklitz, J. P. Sanchez, P. Vullier, and D. Johrendt, Phys. Rev. B 63, 100102R (2001).
- Wurth et al. (1997) A. Wurth, D. Johrendt, C. Huhnt, G. Michels, M. Roepke, and W. Schlabitz, Z. Anorg. Allg. Chem. 623, 1418 (1997).
- Jia et al. (2009) S. Jia, A. J. Williams, P. W. Stephens, and R. J. Cava, Phys. Rev. B 80, 165107 (2009).
- Hammersley et al. (1996) A. P. Hammersley, S. O. Svensson, M. Hanfland, A. Fitch, and D. Haeusermann, High Press. Res. 14, 235 (1996).
- Rodríguez-Carvajal (1993) J. Rodríguez-Carvajal, Physica B 192, 55 (1993).
- Koepernik and Eschrig (1999) K. Koepernik and H. Eschrig, Phys. Rev. B 59, 1743 (1999).
- Opahle et al. (1999) I. Opahle, K. Koepernik, and H. Eschrig, Phys. Rev. B 60, 14035 (1999).
- Kohout (2004) M. Kohout, Int. J. Quantum Chem. 97, 651 (2004).
- Ormeci et al. (2006) A. Ormeci, H. Rosner, F. R. Wagner, M. Kohout, and Y. Grin, J. Phys. Chem. A 110, 1100 (2006).
- Kohout (2008) M. Kohout, BASIN, version 4.7, (2008).
- Bader (1990) R. F. W. Bader, Atoms in Molecules: A Quantum Theory (Oxford University Press, New York, USA, 1990).
- Mandel and Donohue (1971) N. Mandel and J. Donohue, Acta Cryst. B 27, 476 (1971).
- Braun and Jeitschko (1980) D. J. Braun and W. Jeitschko, J. Solid State Chem. 32, 357 (1980).
- Donohue (1974) J. Donohue, The Structures of the Elements (Wiley, New York, 1974).
- Krellner et al. (2008) C. Krellner, N. Caroca-Canales, A. Jesche, H. Rosner, A. Ormeci, and C. Geibel, Phys. Rev. B 78, 100504R (2008).
- Kimber et al. (2009) S. Kimber et al., Nature Materials 8, 471 (2009).
- Yildirim (2009) T. Yildirim, Phys. Rev. Lett. 102, 037003 (2009).
- Mazin et al. (2008) I. I. Mazin, M. D. Johannes, L. Boeri, K. Koepernik, and D. J. Singh, Phys. Rev. B 78, 085105 (2008).
- Johannes and Mazin (2010) M. D. Johannes and I. I. Mazin, Phys. Rev. B 82, 024527 (2010).
- Mazin and Johannes (2009) I. I. Mazin and M. D. Johannes, Nature Phys. 5, 141 (2009).
- Li et al. (2009) L. J. Li, Q. B. Wang, Y. K. Luo, H. Chen, Q. Tao, Y. K. Li, X. Lin, M. He, Z. W. Zhu, G. H. Cao, et al., New J. Physics 11, 025008 (2009).
- Rotter et al. (2010) M. Rotter, C. Hieke, and D. Johrendt, Phys. Rev. B 82, 014513 (2010).
- Nath et al. (2009) R. Nath, Y. Singh, and D. C. Johnston, Phys. Rev. B 79, 174513 (2009).
- Ban and Sikirica (1965) Z. Ban and M. Sikirica, Acta Crystallogr. 18, 594 (1965).
- Villars (1997) P. Villars, Pearson’s Handbook of Crystallographic Data for Intermetallic Phases (ASM Materials Park, OH, USA, 1997).
- Just and Paufler (1996) G. Just and P. Paufler, J. Alloys Compounds 232, 1 (1996).
- Szytuła and Leciejewicz (1989) A. Szytuła and J. Leciejewicz, in Handbook on the Physics and Chemistry of Rare Earths Vol. 12, edited by K. A. Gschneidner Jr. and L. Eyring (North Holland, Amsterdam, 1989), pp. 133–211.
- Bodak et al. (1965) O. I. Bodak, E. I. Gladyshevskii, and P. I. Kripyakevich, Izvest. Akad. Nauk SSSR Neorg. Mater. 2, 2151 (1965).
- Parthé and Chabot (1984) E. Parthé and B. Chabot, Handbook on the Physics and Chemistry of Rare Earths edited by K. A. Gschneidner Jr. and L. Eyring, (Amsterdam: North Holland), Vol. 6, 113–334 (1984).
- Schlenger et al. (1971) H. Schlenger, H. Jacobs, and R. Juza, Zeit. Anorg. Allg. Chemie 385, 177 (1971).
- Mewis (1977) A. Mewis, Z. Naturforsch. B 32, 351 (1977).
- Marchand and Jeitschko (1978) R. Marchand and W. Jeitschko, J. Solid State Chem. 24, 351 (1978).
- Jeitschko and Jaberg (1980) W. Jeitschko and B. Jaberg, J. Solid State Chem. 35, 312 (1980).
- Pfisterer and Nagorsen (1983) M. Pfisterer and G. Nagorsen, Z. Naturforsch. B 38, 811 (1983).
- Jeitschko et al. (1987) W. Jeitschko, R. Glaum, and L. Boonk, J. Solid State Chem. 69, 93 (1987).
- Mewis (1980) A. Mewis, Z. Naturforsch. B 35, 141 (1980).
- Jeitschko and Reehuis (1987) W. Jeitschko and M. Reehuis, J. Solid State Chem. 48, 667 (1987).
- Reehuis et al. (1998) M. Reehuis, W. Jeitschko, G. Kotzyba, B. Zimmer, and X. Hu, J. Alloys Compounds 266, 54 (1998).
- Schaefer et al. (1973) H. Schaefer, B. Eisenmann, and W. Mueller, Angew. Chemie Int. Ed. Engl. 12, 694 (1973).
- Hofmann and Jeitschko (1984) W. K. Hofmann and W. Jeitschko, J. Solid State Chem. 51, 151 (1984).
- Jeitschko et al. (1985) W. Jeitschko, U. Meisen, M. H. Müller, and M. Reehuis, Z. Anorg. Allg. Chem. 527, 73 (1985).
- Hofman and Jeitschko (1985) W. K. Hofman and W. Jeitschko, Monatsh. Chem. 116, 569 (1985).
- Kohout and Grin (2006) M. Kohout, F. R. Wagner, and Y. Grin, Int. J. Quantum Chem. 106, 1499 (2006).
- Kohout (2007) M. Kohout, Faraday Discuss. 135, 43 (2007).
- Wagner et al. (2007) F. R. Wagner, V. Bezugly, M. Kohout, and Y. Grin, Chem. Eur. J. 13, 5724 (2007).
- Kohout et al. (2002) M. Kohout, F. R. Wagner, and Y. Grin, Theor. Chem. Accounts 108, 150 (2002).
- Sichevych et al. (2009) O. Sichevych, M. Kohout, W. Schnelle, H. Borrman, R. Cardoso-Gil, M. Schmidt, U. Burkhardt, and Y. Grin, Inorg. Chem. 48, 6261 (2009).
- Wagner et al. (2008) F. R. Wagner, M. Kohout, and Y. Grin, J. Phys. Chem. A 112, 9814 (2008).
- Bezugly et al. (2010) V. Bezugly, P. Wielgus, M. Kohout, and F. R. Wagner, J. Comput. Chem. 31, 2273 (2010).