Modeling the long term dynamics of pre-vaccination pertussis
Abstract
The dynamics of strongly immunizing childhood infections is still not well understood. Although reports of successful modeling of several incidence data records can be found in the literature, the key determinants of the observed temporal patterns have not been clearly identified. In particular, different models of immunity waning and degree of protection applied to disease and vaccine induced immunity have been debated in the literature on pertussis. Here we study the effect of disease acquired immunity on the long term patterns of pertussis prevalence. We compare five minimal models, all of which are stochastic, seasonally forced, well-mixed models of infection based on susceptible-infective-recovered dynamics in a closed population. These models reflect different assumptions about the immune response of naive hosts, namely total permanent immunity, immunity waning, immunity waning together with immunity boosting, reinfection of recovered, and repeat infection after partial immunity waning. The power spectra of the output prevalence time series characterize the long term dynamics of the models. For epidemiological parameters consistent with published data for pertussis, the power spectra show quantitative and even qualitative differences that can be used to test their assumptions by comparison with ensembles of several decades long pre-vaccination data records. We illustrate this strategy on two publicly available historical data sets.
Keywords: pertussis, childhood diseases, recurrent epidemics, stochastic fluctuations, power spectra
I introduction
Childhood infections remain a public health as well as a modeling challenge, despite many decades of control measures and theoretical efforts. Large vaccination programmes against some of these diseases started in the 1940s-1960s in the developed countries and led to dramatic reductions of incidence levels, but in the developing countries they are still a cause of significant levels of infant mortality trottier ; bolkerweb ; YorkeLondonII ; Wallinga2001 ; broutin ; Broutin2005b . The resurgence of pertussis, also known as whooping cough, reported in developed countries after decades of high vaccine coverage CDC ; Skowronski ; deMelker ; Crowcroft ; pnaspertussis , as well as a recent upsurge of measles in eastern and southern Africa prompted a renewed interest in assessing the efficacy of control policies for these childhood infections.
Such an assessment must rely on simulations based on mathematical models. The complexity and diversity of the long term dynamics of childhood diseases has been long acknowledged as a major problem in mathematical epidemiology Soper ; YorkeLondonI ; FineClarckson82 ; FineClarckson86 . More recent work focused on contact structure, stochasticity and seasonality has brought considerable advances in understanding and selecting some of the fundamental ingredients that drive the observed incidence temporal patterns Grenfnat2001 ; Grenfsci2000 ; b&earn ; GrenfpD2001 ; wearing2005 ; MSimoes05062008 ; mixingpatterns ; Read and in developing analytic tools to deal with these ingredients and their interplay with the model’s nonlinearities hethcote ; vddrische ; keelingrev ; mckane1 ; PhysRevE.79.041922 ; VolzMeyers ; andrea ; forcedmckane ; seasonal .
Models of higher complexity involve many parameters, some of which are difficult to determine, leaving considerable room for data fitting Metcalf ; GrasslyFraser ; p73 ; realnets . On the other hand, one of the features of childhood infections is the variability exhibited by different data records, even within those that correspond to a single disease in comparable social environments broutin ; b&earn ; broutin2010 . Therefore, successful modeling of particular sets of incidence data records reported in the literature b&earn ; rohaniinterplay ; rohanistaged has not closed the discussion about the key determinants of the observed dynamics. Measles is an exception for which a parsimonious model has been shown to reproduce the behavior of different data sets Grenfnat2001 ; meslaesafrica ; measlespre , and it is generally accepted that the disease dynamics in large urban populations is adequately described by a stochastic seasonally forced well-mixed susceptible-infective-recovered (SIR) or susceptible-exposed-infective-recovered based model.
At the opposite extreme, pertussis keeps defying mathematical modeling, as illustrated by recent efforts in different directions pnaspertussis ; rohanistaged ; rohanisignature ; mckanewcough ; rohanicontact ; aguas . In particular, several proposals explore hypothesis about disease induced and vaccine induced immunity pnaspertussis ; broutin2010 ; aguas , relying on assumptions about vaccine uptake and efficacy for the purpose of comparison with real data. This is a difficult problem of great interest and enormous relevance for public health. However, we are still lacking a sound uncontroverted model for pre-vaccination pertussis.
Here we have sought to contribute to the goal of using pre-vaccination data records to obtain information about the properties of disease induced immunity. The paper focuses on exploring the influence of naive hosts immune response in the long term patterns of pertussis prevalence as given by the averaged power spectra of simulated time series corresponding to several decades. The power spectrum of the stochastic seasonally forced well-mixed SIR model is compared with those of four modifications of the model that reflect different assumptions about disease induced immunity. These four different assumptions have been proposed in the literature in the framework of deterministic models that have all been shown to be compatible with available data. The five variants we consider deliberately avoid all the complications related with contact structure and spatial spread, as well as vaccine coverage and efficacy and waning of vaccine-induced immunity, in order to keep a relatively low number of free parameters in the model.
We show that the stochastic versions of the SIR model and its four variants have significantly different properties, which translate into quantitatively different prevalence and incidence power spectra. This opens the possibility of using the stochastic properties of long, well resolved data records to constrain these and other variants of the model, using the power spectra of the pertussis incidence time series in large urban centers in the pre-vaccination era as the target long term dynamics that the model should reproduce. We illustrate this strategy by applying it to two publicly available historical data records for pre-vaccination pertussis incidence.
II models and methods
II.1 Models
We consider five seasonally forced stochastic compartmental models summarized in Fig. 1 as candidates for the description of pre-vaccination pertussis (the deterministic counterparts of these models are described in the Supplementary Material). In all cases, the population includes three classes of individuals, the susceptible [ in (a)-(d), and in (e)], the infectious [ in (a)-(c), and in (d)-(e)] and the recovered [ in (a)-(b) and (d)-(e), and in (c)]. Also in all five cases, there is replenishment through births of susceptible individuals that have never before contracted the disease. The birth rate is kept constant and equals the death rate .
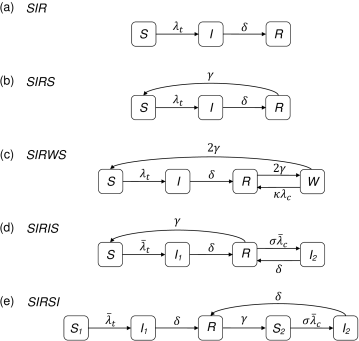
II.1.1 SIR model
Model (a) is the standard SIR model: recovery confers permanent immunity, and all infections are first infections. Infected individuals recover at a constant rate , and susceptible individuals are infected at a rate , where is the population size, is the number of infected individuals and is a periodic function of period one year that represents the variable contact rate associated with the school terms. For the purpose of studying the long term temporal patterns of the fluctuations of this stochastic process the particular form of is not crucial, and we shall take .
II.1.2 SIRS model
Model (b) is the standard SIRS model. It differs from the SIR model in that recovery does not confer permanent immunity. Instead, recovered individuals’ immunity wanes at a constant rate and then they become susceptible again. The fraction of primary infections is given approximately by , where and are the equilibrium values for the susceptibles and infectives in the deterministic counterpart of the SIRS model (see the Supplementary Material for details on the deterministic SIRS model and on this calculation). Although there is no direct correspondence between primary infections and age groups in the model, it is reasonable to admit that a fraction of the infectives close to the fraction of non-primary infections, given by , are not school children, and that should be reduced proportionally in this version of the model. This correction could be refined, but as we shall see in Section III the properties of the stochastic fluctuations in this model are largely insensitive to the value of .
II.1.3 SIRWS model
Model (c) is an SIRS-type model allowing for immune boosting of recovered individuals upon reexposure to infectious individuals. In this model, infectives recover at rate and susceptibles get infected at rate as in the SIR model. However, in addition to the and classes, there are two classes of recovered individuals denoted by and . The immunity of the former is not permanent and they move to the waning class at a constant rate . The individuals in class undergo two possible transitions: further immunity loss at rate to become susceptible , or immunity boosting upon contact with infectious individuals to return to the recovered class at a rate , where is the immunity boosting coefficient. We call this scheme the immune boosting model and denote it by SIRWS.
An age-structured version of this model with vaccination has been used to explain the recent reemergence of pertussis cases despite high vaccine coverage in Massachusetts, and also the shifts in total and age-specific incidences before and after mass vaccination pnaspertussis .
II.1.4 SIRIS model
Model (d) proposed in aguas sets a scenario based on the SIRS model with a moderate rate of immunity loss where recovered individuals are immune to severe disease but susceptible with reduced susceptibility to mild forms of the disease. The classes of individuals infected with severe and mild infections are denoted by and , respectively. Recovery from both forms of the disease takes place at the same rate . Infectiousness of mild infections is reduced by a factor and susceptibility of recovered individuals to mild infections is also reduced by a factor with respect to the susceptible. Moreover, since mild infections typically occur in adults that are not affected by seasonal forcing the force of infection is therefore taken to be for susceptible individuals and for recovered individuals . We call this scheme the reinfection model and denote it by SIRIS.
The main feature of this model is that it exhibits a reinfection threshold gabrielareinfection , that is, a value of infectiousness above which total disease incidence rises by one or more orders of magnitude, due to high incidence levels of mild infections. These mild infections are sub-clinical and so the disease incidence/prevalence and density of infectives in equilibrium for the deterministic counterpart of the SIRIS model is associated with the class .
II.1.5 SIRSI model
Finally, model (e) proposed in rohanisignature assumes an immune response that is a combination of (b) and (d), in the sense that recovered individuals are fully immune to the disease, but they lose this immunity at a certain rate to become susceptible to repeat infections, although with reduced susceptibility. The two classes of susceptible individuals are denoted by for the naive susceptibles and for the susceptibles generated by immunity waning, and is the reduced susceptibility factor for repeat infections. The classes of individuals infected with first and repeat infections are denoted by and , respectively. Recovery from both classes takes place at the same rate . The class of repeatedly infected individuals contributes with reduced infectiousness to the pool of infectives responsible for disease transmission, and is the reduced infectiousness factor. Repeat infections play a similar role in this model to that of mild infections in the SIRIS model, and the force of infection is taken to be for and for , because repeat infections typically occur in adults whose contacts are not subject to school term forcing. Similarly to the SIRIS model, the disease incidence/prevalence and density of infectives in equilibrium for the deterministic counterpart of the SIRSI model is identified with the class . We call this scheme the repeat infection model and denote it by SIRSI.
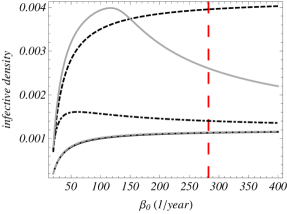
We finish the description of the models by pointing out that, for a fixed , the unforced () deterministic counterparts of the five stochastic models introduced in this section have different densities of infectives in equilibrium. In Figure 2 we plot these equilibrium densities as a function of . The values of the remaining parameters will be justified later. For , the density of infectives in the deterministic versions of the five models oscillates with the period 1 year around the equilibrium value of the corresponding unforced equations (see the Supplementary Material). Note that the unforced SIRWS model may have also limit cycles as stable attractors for some parameter values. This is, however, not the case for the parameter values that we will use in our analysis (throughout the main text is fixed at the dashed vertical line in Fig. 2).
II.2 Data records
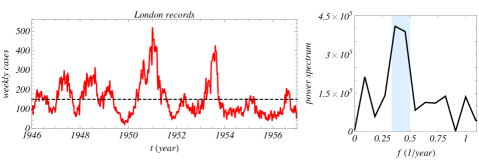
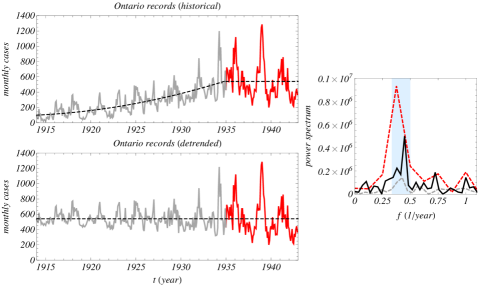
In this paper, we consider the historical data records for pre-vaccination pertussis incidence in Greater London in the period 1946-1957 (Figure 3, the left panel) and in Ontario in the period 1914-1943 (Figure 4, the left panels). The time series correspond to weekly data, in the case of London, and monthly data in the case of Ontario. Both raw and detrended (but not rescaled) data are shown for Ontario, where significant changes in population size and reporting efficiency are apparent during most of that period. In order to analyze the populations involved in these two data records, we shall consider only the undetrended data for Ontario corresponding to the last 8 years of the 29 years period. The ratio of the populations is close to 8/3.5, according to demographic data that set the population of Greater London close to 8 million and that of Ontario close to 3.5 million in the period under consideration. However, the average recorded rate of new cases in a month interval, which is similar for the two data sets, points to a ratio of effective populations close to 1. Differences in surveillance coverage and/or in reporting efficiency could explain this. For London, levels of pertussis reporting efficiency in the range 5%-25% have been acknowledged in the literature reportpertussis . The fact that the effective population for Ontario is approximately of the same size indicates that a higher reporting efficiency compensates for the smaller population.
It is known from the case notification data from England and Wales and other locations that the inter-epidemic periods for pertussis in the pre-vaccination era show significant multiannual structure. The multiannual periods lie in the range of 2-3 years and additionally annual outbreaks can be observed b&earn ; rohanisignature ; synchrony . The power spectra computed the data confirm these observations (see the right panels in Fig.3 and in Fig. 4). In the spectra plots, the shaded region marks the range of frequencies, , corresponding to the interepidemic periods years. Because of limited length and resolution in time, the spectra have a short range and a low resolution in frequency, however this affects mostly the annual peak. The widths of the multiannual peaks are comparable with each other. For Ontario, the power spectra of the full time series and of the detrended and undetrended partial data sets show the same dominant frequency components. In what follows, we shall consider only the power spectrum of the undetrended data.
II.3 Parameter values
| Epidemiological meaning | Notation | Value |
|---|---|---|
| Per capita birth/death rate | ||
| Average lifespan | years | |
| Rate of recovery from infection | ||
| Average infectious period | days | |
| Basic reproductive ratio | ||
| Average contact rate | ||
| Amplitude of seasonal forcing | ||
| Rate of loss of naturally acquired immunity | ||
| Average infection-derived immunity period | years | |
| Relative infectiousness of repeat to primary (SIRSI) | ||
| or mild to severe infections (SIRIS) | ||
| Relative susceptibility of repeat to primary (SIRSI) | ||
| or mild to severe infections (SIRIS) | ||
| Boosting coefficient |
The values of the demographic and epidemiological parameters that are well established in independent data sources are kept fixed (see, for example, b&earn ; amay ). These are the birth/death rate (or the average lifespan ), the rate of recovery from infection (or average infectious period ) and the average contact rate . The value of the latter corresponds to the value of the basic reproductive ratio reported in the literature for the two data sets considered in this study b&earn . If the reported value of comes from average age at infection data, together with the assumption of SIR dynamics, then it has to be corrected for models with temporary immunity. In the Supplementary Material we explore the whole range of possible values for the SIRS and SIRSI models and show that the analysis of Section III below is not affected by this correction. We also give for the SIRWS and SIRIS models the dependence of on the remaining model parameters, computed from average age at infection data on the assumption that the naive susceptibles are homogeneously mixed in the whole population.
For the remaining parameters we either use the estimates found in the literature for a particular model or explore an appropriate range of possible values if such estimates are absent. For example, the accepted range for the duration of naturally acquired immunity for pertussis is 7 to 20 years review_im_pertussis . For the SIRS model, we take equal 20 to 40 years. On one hand, the large upper limit allows for a comparison with the SIR model. On the other hand, as we shall see, taking smaller than 20 years would make the prediction of the model worse. For the SIRIS model, we take years aguas and the relative infectiousness and relative susceptibility of mild infections . The prediction of this model for other values of can still be done using the SIRS model as one of the limiting cases of the SIRIS model. For the SIRWS model, we take the value of the boosting coefficient and years considered in Ref. pnaspertussis and in addition we study the behavior of the model for years and . For the SIRSI model, we set years and the relative infectiousness and relative susceptibility of repeat to primary infections rohanisignature . We discuss in the Supplementary Material the behavior of this model for other values of the duration of immunity.
For practical purposes we use only three values of the amplitude of seasonal forcing . We will however discuss the predictions of the models for intermediate values of whenever necessary. The summary of the parameter values is given in Table 1.
II.4 Stochastic simulations
To study the behavior of the five candidates for the description of pre-vaccination pertussis we use stochastic simulations of the processes described in Fig. 1. The simulations are based on a modification of Gillespie’s algorithm Gillespie which accounts for the explicit time dependence in the contact rate DavidAnderson ,Lu . In Sections III.1-III.5, each simulation run starts from a random initial condition and the prevalence of the disease is recorded with a time step of 0.05 year for 450 years after 50 years of transient. From each simulation run the power spectrum of the prevalence time series is computed with the use of the discrete Fourier transform. The final spectra are averages of simulations. The population size, , used in the simulations in Sections III.1-III.5 is .
III results
We investigate the dynamics of the stochastic seasonally forced SIR, SIRS, SIRWS, SIRIS and SIRSI models by comparing the power spectra of long time series of the five models in the relevant parameter ranges. We first describe the performance of the SIR model and then assess whether each of its four extensions improves or worsens the results for the SIR model. In all cases, the spectra correspond to the fluctuations around the equilibrium of the unforced deterministic versions of each model () or around the associated period one year stable attractor (). Numerical and simulational results for the parameter ranges we have explored never showed evidence of other attractors. A direct quantitative comparison of these power spectra with the spectra shown in Fig. 3 and Fig. 4 based on the amplitude of the multiannual peaks and their precise location is undermined by the low resolution in frequency and poor statistics of the two data sets, which correspond to much shorter periods than the ones that can be used in the numerical simulations. That is why our first criterion in making the comparison between the models’ predictions and the spectra computed from the data will be the position of the multiannual peak. In order to be able to explain historical data records of pertussis incidence a model’s spectrum should have the multiannual peak located in the range of frequencies, (see Fig. 3 and Fig. 4). This region is the shaded region shown in all spectra plots throughout the paper.
As pointed out before, in Sections III.1-III.5 we use a typical population size in all models and compute spectra from the prevalence time series. Changing population size and/or computing the incidence in a given interval instead of the prevalence of the disease may change somewhat the amplitude of the multiannual and annual peaks but does not influence their position.
III.1 SIR model
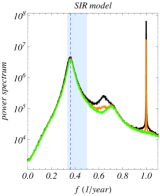
The model’s power spectrum as a function of frequency for different values of the forcing amplitude is shown in Fig. 5. The power spectra computed from the stochastic simulations exhibit two types of peaks: a well defined dominant annual peak due to the deterministic annual limit cycle and a subdominant broad multiannual stochastic peak with the shape and the main frequency similar to that of the unforced case. The increase in results in a more enhanced annual peak which means that the contribution of annual epidemics in the time series increases as increases. The multiannual stochastic peak reflects the presence of noisy oscillations in the incidence time series with that dominant frequency. The mechanisms by which internal noise excites these resonant fluctuations has been treated in several papers mckane1 ; PhysRevE.79.041922 ; forcedmckane ; seasonal ; mckanewcough . They can be described analytically using van Kampen’s expansion of the master equation of the underlying stochastic process around the attractor of the deterministic system vankampen . We point out that in this study the dominant frequency of the main stochastic peak in the seasonally forced models can be computed from the unforced model whose analysis is easier (see Supplementary Material for more information on the analytical computation of the power spectra).
For the SIR model, the frequency and the shape of the dominant stochastic peak are largely independent of , and the peak’s frequency lies in the shaded region (see the Supplementary Material for the analytical expression of the spectrum). The dominant period of stochastic fluctuations in the SIR model is 2.7 years. In Sections III.2-III.5 we will discuss whether the SIRS, SIRWS, SIRIS and SIRSI extensions of the SIR model improve or worsen its performance. In particular, we will be interested to know how the position and the amplitude of the stochastic peak change with respect to that of the SIR model and the robustness of the behavior of each model under the variation of free parameters.
III.2 SIRS model
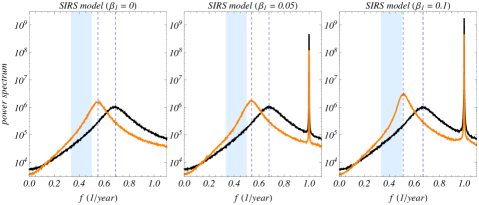
In the SIRS model, the rate of immunity waning is a free parameter. In the case of the lifelong immunity, , the SIRS model reduces to the SIR model considered in the previous section. Figure 6 shows the model’s spectrum for different values of the forcing amplitude and two typical values of . In the unforced SIRS model, , the spectrum has a pronounced stochastic peak (see the Supplementary Material for the analytical expression of the spectrum). However, it is situated outside the region of interest both for years and for years. For fixed and increasing , the frequency of the stochastic peak is slightly shifted towards the target region but it remains outside it even for large values of and, at the same time, the power associated with the annual peak becomes very large. Note that if is decreased to take into account that non primary infections should not be subject to seasonal forcing in this model the dominant frequency of the stochastic peak is moved even further away from the shaded region. We conclude by noting that the SIRS model’s spectrum is incompatible with the London and Ontario data unless in the limit of when it approaches the SIR model. The performance of the SIRS model for other values of is also discussed in the Supplementary Material.
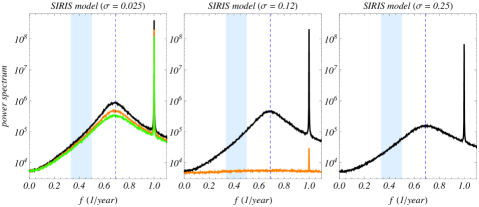
III.3 SIRIS model
Next we analyze the power spectra from simulations of the SIRIS model. This model has three free parameters apart from the amplitude of seasonal forcing : the rate of immunity loss , and the relative infectiousness and relative susceptibility . For the limiting case of and the model reduces to the SIRS model whose multiannual peaks are located outside the shaded region. The model’s behavior is, however, well understood if we vary only and . The results are shown in Fig. 7 for fixed and years. The spectrum for small values of and is reminiscent of the SIRS model. A comparison of the spectra in all panels of Fig. 7 shows that the stochastic and deterministic peaks are the highest for the smallest values of both and . This is because it is easier to generate incidence oscillations in this parameter range. The increase in the values of and results in a flattening of the spectrum occurring through a gradual disappearance of, first, stochastic and, then, deterministic peaks. Moreover, the study of the dependence of the power spectrum on the amplitude of seasonal forcing does not change this picture. For example, for the smallest values of and used in Fig. 7 we observe that the position and the shape of the stochastic peaks agree perfectly for and that they are always outside of the region of interest (this result is given in the Supplementary Material). The parameter region with higher values of and is even less interesting because of the flattening of the spectrum. Thus for all relevant ranges of , and the stochastic multiannual peak in this model is situated outside the region of interest except when it approaches the limit of the SIR model.
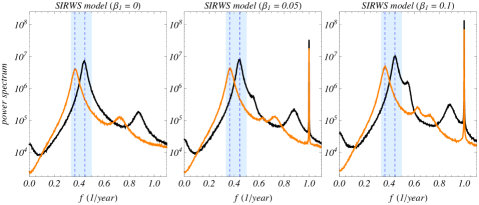
III.4 SIRWS model
Here we show the power spectra computed from simulations of the SIRWS model for boosting coefficient and different values of and , see Fig. 8. The results for and 10 are given in the Supplementary Material and will be discussed later in this section. In the absence of seasonality, , the spectra have a dominant multiannual peak situated in the target region for the whole range of years. When increases a deterministic annual peak appears in the spectrum while the dominant frequency of the multiannual peak stays unchanged. Similarly to the SIR model, the higher the amplitude of seasonal forcing is the higher the annual peak is. However, unlike in that model, this phenomenon is accompanied by an overall complication of the structure of the spectrum for higher values of . For example, the power spectrum for years and (black line in the right panel of Fig. 8) has several secondary multiannual peaks, one of which is situated near but outside the shaded region. Thus, the SIRWS model predicts a rather broad range of frequencies corresponding to the stochastic fluctuations around the annual deterministic cycle.
Finally, we discuss the results for (see Supplementary Material for details). For and years, the stochastic multiannual peaks of all power spectra lie in the shaded region. The same happens for and years but not for . For and the SIRWS model exhibits a SIRS-like behavior, thus the multiannual peaks of the SIRWS model are outside of the region of interest likewise in that model.
III.5 SIRSI model
We finish by presenting the results from simulations of the SIRSI model. Figure 9 shows the spectra for different values of , and years. Similarly to the SIR model, the simulation spectra of the SIRSI model have a high stochastic multiannual peak in addition to the annual peak due to the deterministic limit cycle. The amplitude of the deterministic peaks and therefore the power associated with them increase as increases while the stochastic peaks stay almost unchanged. The increase, however, is smaller in the SIRSI model than in the SIR model. This means that, notwithstanding the similarity of their simulation spectra, the contribution of annual epidemics is less in the former than in the latter, corresponding to a qualitative difference in the times series of the two models.
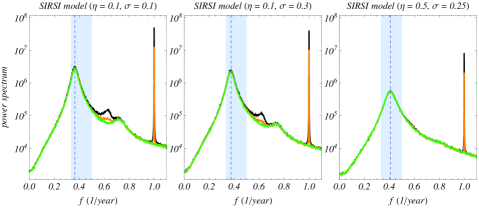
For three sets of parameter values chosen in Fig. 9 the dominant stochastic multiannual peaks lie in the shaded region, moreover their frequencies and shapes are largely independent of . To explore the consequences of varying and for fixed , we considered in the interval nine equally spaced values and constructed a grid of 81 points in the space. As the position and the shape of the stochastic peak in this model is independent of we can calculate the stochastic peak’s frequency from the unforced model (see Supplementary Material for more details). For example, for years used in Fig. 9, the number of spectra for the SIRSI model with the stochastic peak within the shaded region is 62 (for years this number varies from 43 to 78). We thus conclude that the SIRSI model’s spectrum illustrated in Fig. 9 is robust with respect to variation of all free parameters, and that it exhibits some degree of variability in the amplitude of the stochastic multiannual peak as parameters are varied within their accepted ranges. The robustness of these results with respect also to variations of keeping the average age at first infection fixed at its value for the SIR model is illustrated in the Supplementary Material.
III.6 Comparison with real data
The results for the power spectra of stochastic simulations show that out of the four extensions of the SIR model under consideration only SIRWS and SIRSI have frequency values for the stochastic multiannual peak that preserve or improve the compatibility with data for pre-vaccination pertussis previously obtained with the SIR model. Here we compare the other features of spectra of the SIR model and of the SIRWS and SIRSI extensions with the spectra for London and Ontario data sets shown in Figs. 3 and 4.
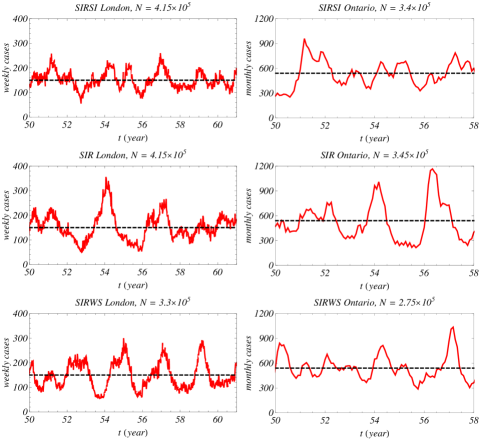
As a first step towards achieving this we determine the population size for each model. As discussed before both data sets have the similar average recorded rate of new cases in a month interval and thus correspond to a similar effective population. However, the deterministic counterparts of the models, and consequently the stochastic models too, predict different densities of infectives in the steady state. To resolve this, for each of the three models we make simulations with the same length and the same sampling time as those of the London or Ontario data sets and record the incidence of the disease in the sampling interval. The transient period in all simulations is taken to be 50 years and each simulation starts from a random initial condition. We calibrate the effective population size for a given model by imposing that the incidence averaged over different simulation runs is the same as the time averaged incidence in the corresponding data set, given by the dashed line in Fig. 3 and in Fig. 4. In Fig. 10 we show typical incidence time series for and the effective population size for each of the three models from which individual power spectra are computed.
The second step is to determine for each model the level of seasonality that corresponds to the data set. We estimate the value of the amplitude of the seasonal forcing as the value for which the amplitude of the annual deterministic peak in the power spectrum of incidence times series averaged over different simulation runs is equal to the amplitude of the annual peak in the spectrum computed from the data.
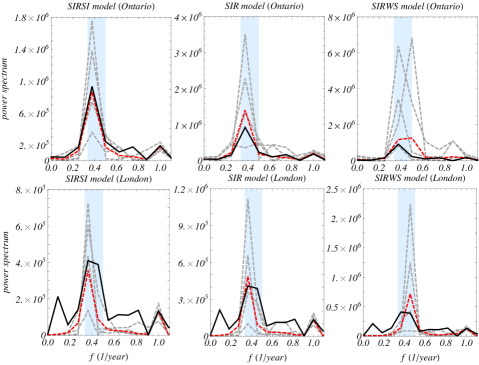
Using the values of and of determined in this way, we produce from the stochastic models time series mimicking the London or Ontario data sets, and average their power spectra over simulation runs. The power spectra from simulation [dashed red (black) lines] and the spectra computed from the data sets [black solid lines] are shown in Fig. 11. The power spectra obtained with the SIR model have stochastic multiannual peaks with amplitudes that are similar, though on average larger, than those of the data sets power spectra. For the SIRWS extension, the average amplitude of the stochastic peak is even larger, while the SIRSI extension gives a better agreement with this feature of the data with respect to the SIR model.
The results of Fig. 11 thus suggest that the SIRSI model is the one that best reproduces the stochastic properties of both data sets. However, as shown by the four examples plotted in the figure for each case (dashed gray lines), the poor statistics of the short term samplings translates into a considerable variability in the power spectra computed from each time series. The two historical data records considered here illustrate the principle that the incidence power spectra can be used to discriminate the three variants of the model, but a final conclusion on their performance would require the analysis of longer time series.
IV Discussion and Conclusions
Different assumptions about disease and vaccine induced immunity have been proposed in the recent literature to model the dynamics of pertussis in the presence of mass vaccination. Our motivation has been to study separately the influence of disease acquired immunity only, in order to reduce the number of free parameters, and to consider explicitly the stochastic properties of the incidence time series as part of the model’s output, in order to look for further constraints.
We have used the basic SIR model and four variants that reflect different immune responses. We characterized the dynamic patterns of each of these five models through the average power spectra of an ensemble of long term prevalence time series obtained from stochastic simulations. We have found that the power spectra of the five alternative models show quantitative and even qualitative differences. One of them (SIRS) fails to reproduce a stochastic peak in the frequency range found in real data for pertussis, and another one (SIRIS) is too stiff to produce stochastic fluctuations with the observed amplitudes.
Assessing the performance of the other two variants, SIRWS and SIRSI, with respect to the SIR model requires a quantitative comparison of the simulated power spectra with real data, for which purpose the effective population size and the forcing amplitude of each data record must be determined. We illustrated this procedure by considering two publicly available historical data records for pre-vaccination pertussis incidence. Based on these relatively short time series, we found that the output of the SIRSI model agrees with the main aspects of the phenomenology of the disease in a broad parameter range. It reproduces the multiannual interepidemic periods and the amplitude of fluctuations found in the data with a better agreement than SIR for the latter, while the SIRWS variant tends to produce stochastic fluctuations even larger than SIR.
Considerations about the recovery profile and its influence on the model’s behavior concur in favoring models such as SIRSI, with a much flatter spectrum than SIRWS. Here we have followed the common approach of taking recovery as a constant rate stochastic process, instead of more realistic unimodal recovery profiles that have been proposed and studied in the literature andrea ; lloyd2001b . For unforced models, it is known andrea that the effect of this change is twofold, on one hand a small displacement of the main stochastic peak towards higher frequencies, and on the other an enhancement of the fluctuations. We have checked (results not shown) that this holds too for the SIRSI and SIRWS models in the parameter region explored in the previous section when we change from an exponentially distributed recovery profile to a unimodal gamma distributed recovery profile with the same average. Therefore, under more realistic recovery profiles, the output of the SIRWS model would be further away from the target power spectra, as would that of the SIR model as well.
However, the short length of the time series used in our illustrative study prevents any definite conclusion about the performance of the SIR model alternatives. Indeed, the ensemble of the power spectra obtained from simulated time series of this length exhibits enough variability to accommodate the two samples of real data. An extension of this analysis to a larger set of data could help to further elucidate the dynamics of disease acquired immunity, setting a solid ground for more complex models to deal with vaccine acquired immunity.
V Acknowledgements
The authors thank Gabriela Gomes for helpful discussions. Financial support from the Portuguese Foundation for Science and Technology (FCT) under Contract No. POCTI/ISFL/2/261 is gratefully acknowledged. The first author (G.R.) was also supported by FCT under Grants No. SFRH/BD/32164/2006 and No. SFRH/BPD/ 69137/2010, and by Calouste Gulbenkian Foundation under its Program ”Stimulus for Research”. This research was also partially supported by the National Science Foundation under Grant No. NSF PHY05-51164. The data used in this paper are available online from the International Infectious Disease Data Archive (IIDDA) at http://iidda.mcmaster.ca.
References
- (1) Trottier, H., Philippe, P. & Roy, R. 2006 Stochastic modeling of empirical time series of childhood infectious diseases data before and after mass vaccination. Emerg. Themes Epidemiol. 3. (doi:10.1186/1742-7622-3-9)
- (2) http://www.math.mcmaster.ca/bolker/measdata/.
- (3) Yorke, J. A. & London, W. P. 1973 Recurrent outbreaks of measles, chickenpox and mumps: II. Systematic differences in contact rates and stochastic effects. Am. J. Epidemiol. 98, 469–482.
- (4) Wallinga, J., Lévy-Bruhl, D., Gay, N. J. & Wachmann, C. H. 2001 Estimation of measles reproduction ratios and prospects for elimination of measles by vaccination in some Western European countries. Epidemiol. Infect. 127, 281–295.
- (5) Broutin, H., Guégan, J. F., Elguero, E., Simondon, F. & Cazelles, B. 2005 Large-scale comparative analysis of pertussis population dynamics: periodicity, synchrony, and impact of vaccination. Am. J. Epidemiol. 161, 1159–1167.
- (6) Broutin, H., Mantilla-Beniers, N. B., Simondon, F., Aaby, P., Grenfell, B. T., Guégan, J. F. & Rohani, P. 2005 Epidemiological impact of vaccination on the dynamics of two childhood diseases in rural Senegal. Microbes Infect. 7, 593–599.
- (7) Centers for Disease Control and Prevention. 2002 Pertussis – United States, 1997 -2000. MMWR 51, 73- 76.
- (8) Skowronski, D. M., De Serres, G., MacDonald, D., Wu, W., Shaw, C., Macnabb, J., Champagne, S., Patrick, D. M. & Halperin, S. A. 2002 The changing age and seasonal profile of pertussis in Canada. J. Infect. Dis. 185, 1448–1453.
- (9) de Melker, H. E., Schellekens, J. F., Neppelenbroek, S. E., Mooi, F. R., Rümke, H. C. & Conyn-van Spaendonck, M. A. 2000 Reemergence of pertussis in the highly vaccinated population of the Netherlands: observations on surveillance data. Emerg. Infect. Dis. 6, 348–357.
- (10) Crowcroft, N. S. & Pebody, R. G. 2006 Recent developments in pertussis. Lancet 367, 1926–1936.
- (11) Lavine, J. S., King, A. A. & Bjørnstad, O. N. 2011 Natural immune boosting in pertussis dynamics and the potential for long-term vaccine failure. Proc. Natl. Acad. Sci. U.S.A. (doi:10.1073/pnas.1014394108)
- (12) Soper, H. 1929 The interpretation of periodicity in disease prevalence. J. R. Stat. Soc. 92, 34 -73.
- (13) London, W. P. & Yorke, J. A. 1973 Recurrent outbreaks of measles, chickenpox and mumps. I. Seasonal variation in contact rates. Am. J. Epidemiol. 98, 453–468.
- (14) Fine, P. E. & Clarkson, J. A. 1982 Measles in England and Wales–I: An analysis of factors underlying seasonal patterns. Int. J. Epidemiol. 11, 5–14.
- (15) Fine, P. E. & Clarkson, J. A. 1986 Seasonal influences on pertussis. Int. J. Epidemiol. 15, 237–247.
- (16) Grenfell, B. T., Bjørnstad, O. N. & Kappey, J. 2001 Travelling waves and spatial hierarchies in measles epidemics. Nature 414, 716–723.
- (17) Earn, D. J. D, Rohani, P., Bolker, B. M. & Grenfell, B. T. 2000 A simple model for complex dynamical transitions in epidemics. Science 287, 667–670.
- (18) Bauch, C. T. & Earn, D. J. D. 2003 Transients and attractors in epidemics. Proc. R. Soc. Lond. B 270, 1573–1578.
- (19) Keeling, M. J., Rohani, P. & Grenfell, B. T. 2001 Seasonally forced disease dynamics explored as switching between attractors. Physica D 148, 317–335.
- (20) Wearing, H. J., Rohani, P. & Keeling, M. J. 2005 Appropriate modeling of infectious diseases. PLoS Med. 2, e239. (doi:10.1371/journal.pmed.0020239)
- (21) Simões, M., Telo da Gama, M. M. & Nunes, A. 2008 Stochastic fluctuations in epidemics on networks. J. R. Soc., Interface 5, 555–566.
- (22) Edmunds, W. J., Kafatos, G., Wallinga, J. & Mossong, J. R. 2006 Mixing patterns and the spread of close-contact infectious diseases. Emerg. Themes Epidemiol. 3. (doi:10.1186/1742-7622-3-10)
- (23) Read, J. M., Eames, K. T. & Edmunds, W. J. 2008 Dynamic social networks and the implications for the spread of infectious disease. J. R. Soc., Interface 5, 1001–1007.
- (24) Hethcote, H. W. 1997 An age-structured model for pertussis transmission. Math. Biosci. 145, 89–136.
- (25) Allen, L. J. & Driessche, P. 2006 Stochastic epidemic models with a backward bifurcation. Math. Biosci. Eng. 3, 445–458.
- (26) Keeling, M. J. & Eames, K. T. 2005 Networks and epidemic models. J. R. Soc., Interface 2, 295–307.
- (27) Alonso, D., McKane, A. J. & Pascual, M. 2007 Stochastic amplification in epidemics. J. R. Soc., Interface 4, 575 -582.
- (28) Rozhnova, G. & Nunes, A. 2009 Fluctuations and oscillations in a simple epidemic model. Phys. Rev. E 79, 041922.
- (29) Volz, E. & Meyers, L. A. 2009 Epidemic thresholds in dynamic contact networks. J. R. Soc., Interface 6, 233–241.
- (30) Black, A. J., McKane, A. J., Nunes, A. & Parisi, A. 2009 Stochastic fluctuations in the susceptible-infective-recovered model with distributed infectious periods. Phys. Rev. E 80, 021922.
- (31) Black, A. J. & McKane, A. J. 2010 Stochastic amplification in an epidemic model with seasonal forcing. J. Theor. Biol. 267, 85–94.
- (32) Rozhnova, G. & Nunes, A. 2010 Stochastic effects in a seasonally forced epidemic model. Phys. Rev. E 82, 041906.
- (33) Metcalf, C. J., Bjørnstad, O. N., Grenfell, B. T. & Andreasen, V. 2009 Seasonality and comparative dynamics of six childhood infections in pre-vaccination Copenhagen. Proc. R. Soc. B 276, 4111–4118.
- (34) Grassly, N. C. & Fraser, C. 2006 Seasonal infectious disease epidemiology. Proc. R. Soc. B 273, 2541–2550.
- (35) Meyers, L. A., Pourbohloul, B., Newman, M. E., Skowronski, D. M. & Brunham, R. C. 2005 Network theory and SARS: predicting outbreak diversity. J. Theor. Biol. 232, 71–81.
- (36) Eubank, S., Guclu, H., Kumar, V. S., Marathe, M. V., Srinivasan, A., Toroczkai, Z. & Wang, N. 2004 Modelling disease outbreaks in realistic urban social networks. Nature 429, 180–184.
- (37) Broutin, H., Viboud, C., Grenfell, B. T., Miller, M. A. & Rohani, P. 2010 Impact of vaccination and birth rate on the epidemiology of pertussis: a comparative study in 64 countries. Proc. R. Soc. B 277, 3239–3245.
- (38) Rohani, P., Keeling, M. J. & Grenfell, B. T. 2002 The interplay between determinism and stochasticity in childhood diseases. Am. Nat. 159, 469–481.
- (39) Nguyen, H. T. & Rohani, P. 2008 Noise, nonlinearity and seasonality: the epidemics of whooping cough revisited. J. R. Soc., Interface 5, 403–413.
- (40) Ferrari, M. J., Grais, R. F., Bharti, N., Conlan, A. J., Bjørnstad, O. N., Wolfson, L. J., Guerin, P. J., Djibo, A. & Grenfell, B. T. 2008 The dynamics of measles in sub-Saharan Africa. Nature 451, 679–684.
- (41) Mantilla-Beniers, N. B., Bjørnstad, O. N., Grenfell, B. T. & Rohani, P. 2010 Decreasing stochasticity through enhanced seasonality in measles epidemics. J. R. Soc., Interface 7, 727–739.
- (42) Wearing, H. J. & Rohani, P. 2009 Estimating the duration of pertussis immunity using epidemiological signatures. PLoS Pathog. 5, e1000647. (doi:10.1371/journal.ppat.1000647)
- (43) Black, A. J. & McKane, A. J. 2010 Stochasticity in staged models of epidemics: quantifying the dynamics of whooping cough. J. R. Soc., Interface 7, 1219–1227.
- (44) Rohani, P., Zhong, X. & King, A. A. 2010 Contact network structure explains the changing epidemiology of pertussis. Science 330, 982–985.
- (45) Aguas, R., Gon alves, G. & Gomes, M. G. 2006 Pertussis: increasing disease as a consequence of reducing transmission. Lancet Infect. Dis. 6, 112–117.
- (46) Gomes, M. G., White, L. J. & Medley, G. F. 2004 Infection, reinfection, and vaccination under suboptimal immune protection: epidemiological perspectives. J. Theor. Biol. 228, 539–549.
- (47) Anderson, R. A. & May, R. M. 1991 Infectious Diseases of Humans. Oxford, Oxford University Press.
- (48) Clarkson, J. A. & Fine, P. E. M. 1985 The efficiency of measles and pertussis notification in England and Wales. Int. J. Epidemiol. 14, 153–168.
- (49) Rohani, P., Earn, D. J. D. & Grenfell, B. T. 1999 Opposite patterns of synchrony in sympatric disease metapopulations. Science 286, 968–971.
- (50) Wendelboe, A. M., Van Rie, A., Salmaso, S. & Englund, J. A. 2005 Duration of immunity against pertussis after natural infection or vaccination. Pediatr. Infect. Dis. J. 24, S58 -S61.
- (51) Gillespie, D. T. 1976 A general method for numerically simulating the stochastic time evolution of coupled chemical reactions. J. Comput. Phys. 22, 403–434.
- (52) Anderson, D. F. 2007 A modified next reaction method for simulating chemical systems with time dependent propensities and delays. J. Chem. Phys. 127, 214107.
- (53) Lu, T., Volfson, D., Tsimring, L. & Hasty, J. 2004 Cellular growth and division in the Gillespie algorithm. Syst. Biol. 1, 121–128.
- (54) van Kampen, N. G. 1992 Stochastic processes in physics and chemistry. Amsterdam, The Netherlands: Elsevier.
- (55) Lloyd, A. L. 2001 Destabilization of epidemic models with the inclusion of realistic distributions of infectious periods. Proc. R. Soc. Lond. B 268, 985–993.