A Survey for Dust in Type IIn Supernovae
Abstract
Recent observations suggest that Type IIn supernovae (SNe IIn) may exhibit late-time (100 days) infrared (IR) emission from warm dust more than other types of core-collapse SNe. Mid-IR observations, which span the peak of the thermal spectral energy distribution, provide useful constraints on the properties of the dust and, ultimately, the circumstellar environment, explosion mechanism, and progenitor system. Due to the low SN IIn rate (10% of all core-collapse SNe), few IR observations exist for this subclass. The handful of isolated studies, however, show late-time IR emission from warm dust that, in some cases, extends for five or six years post-discovery. While previous /IRAC surveys have searched for dust in SNe, none have targeted the Type IIn subclass. This article presents results from a warm /IRAC survey of the positions of all 68 known SNe IIn within a distance of 250 Mpc between 1999 and 2008 that have remained unobserved by more than 100 days post-discovery. The detection of late-time emission from ten targets (15%) nearly doubles the database of existing mid-IR observations of SNe IIn. Although optical spectra show evidence for new dust formation in some cases, the data show that in most cases the likely origin of the mid-IR emission is pre-existing dust, which is continuously heated by optical emission generated by ongoing circumstellar interaction between the forward shock and circumstellar medium. Furthermore, an emerging trend suggests that these SNe decline at 1000–2000 days post-discovery once the forward shock overruns the dust shell. The mass-loss rates associated with these dust shells are consistent with luminous blue variable (LBV) progenitors.
Subject headings:
circumstellar matter — supernovae: general — supernovae: individual — dust, extinction — infrared: stars1. Introduction
Type IIn supernovae (SNe; see Filippenko 1997 for a review) have gained considerable attention over the past decade. Representing less than 10% of all core-collapse events (Smartt, 2009; Smith et al., 2011; Li et al., 2011), this subclass comprises more than 50% of the rare sample of SNe observed to exhibit a late-time (100 days) infrared (IR) excess with respect to the optical blackbody counterpart, typically suggesting the presence of warm dust (e.g., Gerardy et al., 2002; Fox et al., 2009, 2010, and see Table 1). Named for their relatively “narrow” ( km s-1) emission lines arising from a dense, slowly moving, pre-existing circumstellar medium (CSM) (Schlegel, 1990), these SNe IIn may be more prone to have warm dust than any other SN type since (1) dust is able to form in the cool, dense, post-shock layers not available in other SNe (e.g., Pozzo et al., 2004; Smith et al., 2009c), and (2) the dense CSM produced by pre-SN mass loss can contain dust that is illuminated by the supernova radiation (e.g., Smith et al., 2008c; Miller et al., 2010a).
| SN | Subclass | Observations?/ | Reference |
|---|---|---|---|
| Detections? | |||
| 1979c | II | No/No | Merrill (1980) |
| 1980k | II | No/No | Telesco et al. (1981) |
| 1982e | ? | No/No | Graham et al. (1983); Graham & Meikle (1986) |
| 1982l | II | No/No | Graham & Meikle (1986) |
| 1982r | I | No/No | Graham & Meikle (1986) |
| 1985l | II | No/No | Elias et al. (1986); Fesen (1998) |
| 1986J | IIn | No/No | Weiler et al. (1990); Leibundgut et al. (1991) |
| 1987A | II | Yes/Yes | Many Authors |
| 1993J | IIb | No/No | Lewis et al. (1994); Matheson et al. (2000) |
| 1994Y | ? | No/No | Garnavich et al. (1996) |
| 1995G | IIn | No/No | Pastorello et al. (2002) |
| 1995N | IIn | No/No | Gerardy et al. (2002) |
| 1997ab | IIn | No/No | Gerardy et al. (2002) |
| 1998S | IIn | No/No | Gerardy et al. (2002); Pozzo et al. (2004) |
| 1999Z | IIn | No/No | Gerardy et al. (2002) |
| 1999bw | IIn | Yes/Yes | Sugerman et al. (2004) |
| 1999el | IIn | No/No | Gerardy et al. (2002); Carlo et al. (2002) |
| 1999em | IIP | No/No | Elmhamdi et al. (2003) |
| 2002bu | IIn | Yes/Yes | Thompson et al. (2009) |
| 2002hh | IIP | Yes/Yes | Meikle et al. (2006) |
| 2002ic | Ia/IIn | No/No | Kotak et al. (2004) |
| 2003gd | IIP | Yes/Yes | Sugerman et al. (2006); Meikle et al. (2007) |
| 2004dj | IIP | Yes/Yes | Kotak et al. (2005, 2006); Szalai et al. (2011) |
| 2004et | IIP | Yes/Yes | Kotak et al. (2009); Maguire et al. (2010) |
| 2005af | IIP | No/No | Kotak et al. (2006) |
| 2005kd | IIn | No/No | Tsvetkov (2008) |
| 2005ip | IIn | No/No | Fox et al. (2009); Smith et al. (2009c) |
| 2006gy | IIn | No/No | Smith et al. (2009a) |
| 2006jc | Ib | No/No | Smith et al. (2008b) |
| 2006tf | IIn | No/No | Smith et al. (2008a) |
| 2007it | IIP | Yes/Yes | Andrews et al. (2011) |
| 2007od | IIP | No/No | Andrews et al. (2010) |
| 2007rt | IIn | No/No | Trundle et al. (2009) |
| 2008iy | IIn | No/No | Miller et al. (2010b) |
The origin and heating mechanism of the dust, however, can be ambiguous. Disentangling the various dust models offers important clues regarding the supernova’s circumstellar environment, explosion mechanism, and even progenitor system (e.g., Fox et al., 2010). For example, if shock heated, the dust temperature correlates with the gas density (Draine & Salpeter, 1979; Draine, 1981; Dwek, 1987; Dwek et al., 2008), which can be used to trace the progenitor’s mass-loss history (e.g., Smith et al., 2009c; Fox et al., 2010). Alternatively, the discovery of significant amounts of newly formed SN dust would provide the much sought evidence necessary to confirm SN dust models (e.g., Nozawa et al., 2003, 2008). At this point, the observed dust yields all tend to be 2–3 orders of magnitude smaller than predicted by the models (e.g., Kozasa et al., 2009; Meikle et al., 2011, and references therein), although far-IR observations of SN 1987A suggest larger reservoirs of dust may be hidden at colder temperatures (20 K, Matsuura et al., 2011).
Mid-IR observations, which span the peak of the thermal emission from warm dust, offer the most useful constraints on the dust properties. Yet observations at these wavelengths remain sparse. In fact, the Fox et al. (2010) Spitzer Space Telescope IRS spectrum of SN 2005ip is the only mid-IR spectrum of a SN IIn to date. Estimated to have a rate of no more than 10 yr-1 out to 150 Mpc (Dahlén & Fransson, 1999), the number of nearby SNe IIn is small, and SNe IIn at greater distances are not easy targets.
The few observed dust-emitting SNe IIn, however, are anomalously luminous and linger for many years at mid-IR wavelengths, thereby making remnant archeology possible. While 79 SNe IIn within a distance of 250 Mpc were discovered during the years 1999–2008, only 11 of these positions have archived IRAC data collected (either intentionally or serendipitously) more than a few months post-discovery. Five of these eleven events (45%) show evidence for late-time IR emission, in some cases up to six years post-discovery: SNe 1999bw (Sugerman et al., 2004; Thompson et al., 2009), 1999el (Carlo et al., 2002), 2002bu (Thompson et al., 2009)111Note that Smith et al. (2010) suggest that SNe 1999bw and 2002bu may be SN impostors instead of genuine SNe., 2003lo (Meikle et al., 2005), and 2005ip (Fox et al., 2009, 2010).
We therefore executed a warm follow-up survey of the remaining 68 Type IIn events discovered in the years 1999–2008.222We also included the well-studied Type IIn SN 1997ab, for a total of 69 SNe. This paper presents the results of the survey, including the positive detection of late-time emission from ten targets, which more than doubles the database of existing mid-IR observations of SNe IIn. For some targets, optical and near-IR photometry and spectroscopy also exist. In §2 we summarize the observations and data-reduction techniques. photometry constrains the dust mass, temperature, and, thereby, luminosity. Section 3 implements the methods presented by Fox et al. (2010) to explore the origin and heating mechanism of these components; in most cases, results are compared to those of SN 2005ip. Section 4 discusses the overall trends, circumstellar model, and progenitor system, while §5 summarizes the results and discusses future work.
2. Observations
2.1. Mid-Infrared Warm IRAC Survey and Photometry
| SN | JD | Epoch | (h:m:s) | (∘:′:′′) | Distance **All distances are derived from the host-galaxy redshift assuming = 72 km s-1 Mpc-1. | |
|---|---|---|---|---|---|---|
| (2,450,000) | (days) | (J2000) | (J2000) | (Mpc) | (s) | |
| 1997ab | 5140 | 5018 | 09:51:00.40 | +20:04:24.0 | 50 | 300 |
| 1999Z | 5065 | 4104 | 10:22:37.23 | +27:21:19.8 | 210 | 1800 |
| 1999eb | 5170 | 3612 | 01:43:45.45 | +04:13:25.9 | 75 | 300 |
| 2000P | 5322 | 3450 | 13:07:10.53 | 28:14:02.5 | 31 | 300 |
| 2000cl | 5063 | 3631 | 10:37:16.07 | 41:37:47.8 | 38 | 300 |
| 2000ct | 5066 | 3335 | 17:01:03.64 | +33:28:45.0 | 124 | 300 |
| 2000eo | 5068 | 3247 | 03:09:08.17 | 10:17:55.3 | 44 | 300 |
| 2000ev | 5174 | 3264 | 06:47:52.00 | +84:10:02.2 | 61 | 300 |
| 2001I | 5322 | 3180 | 03:43:57.28 | +39:17:39.4 | 68 | 300 |
| 2001ey | 5074 | 3002 | 22:26:30.77 | 06:23:28.6 | 105 | 300 |
| 2001fa | 5065 | 2872 | 01:48:22.22 | +11:31:34.4 | 71 | 300 |
| 2001ir | 5209 | 2937 | 08:36:28.12 | 11:50:03.5 | 81 | 300 |
| 2002A | 5075 | 2864 | 07:22:36.14 | +71:35:41.5 | 40 | 300 |
| 2002bj | 5209 | 2784 | 05:11:46.41 | 15:08:10.8 | 50 | 300 |
| 2002bv | 5146 | 2796 | 07:50:01.13 | +30:01:32.2 | 115 | 300 |
| 2002cb | 5186 | 2950 | 13:04:23.97 | +47:35:53.2 | 123 | 300 |
| 2002ea | 5118 | 2584 | 02:08:25.08 | +14:20:52.8 | 61 | 300 |
| 2002fj | 5108 | 2792 | 08:40:45.10 | 04:07:38.5 | 60 | 300 |
| 2003as | 5078 | 2455 | 05:28:45.81 | +49:52:59.1 | 95 | 300 |
| 2003ei | 5095 | 2296 | 16:28:40.30 | +12:46:05.8 | 110 | 300 |
| 2003hy | 5084 | 2290 | 21:54:22.72 | +15:09:37.8 | 101 | 300 |
| 2003hy | 5084 | 2290 | 21:54:22.72 | +15:09:37.8 | 101 | 300 |
| 2003jh | 5202 | 2166 | 04:16:37.30 | 12:23:32.9 | 122 | 300 |
| 2004F | 5151 | 2067 | 03:17:53.80 | 07:17:43.0 | 73 | 300 |
| 2004ay | 5065 | 1977 | 18:28:57.57 | +51:38:55.7 | 133 | 300 |
| 2004ec | 5322 | 1825 | 17:08:04.96 | +26:22:44.4 | 171 | 900 |
| 2004gd | 5113 | 1835 | 07:09:11.71 | +20:36:10.6 | 72 | 300 |
| 2005R | 5075 | 1938 | 11:14:56.81 | +33:49:35.7 | 151 | 600 |
| 2005aq | 5135 | 1671 | 04:31:38.82 | 04:35:06.8 | 56 | 300 |
| 2005av | 5066 | 1657 | 20:44:37.58 | 68:45:10.6 | 43 | 300 |
| 2005bx | 5065 | 1711 | 13:50:24.95 | +68:33:19.4 | 132 | 300 |
| 2005cl | 5084 | 1635 | 21:02:02.35 | 06:17:35.7 | 107 | 300 |
| 2005cp | 5066 | 1523 | 23:59:30.88 | +18:12:09.6 | 91 | 300 |
| 2005cy | 5066 | 1498 | 18:26:49.11 | +51:08:30.4 | 138 | 300 |
| 2005db | 5111 | 1495 | 00:41:26.79 | +25:29:51.6 | 62 | 300 |
| 2005dr | 5108 | 1476 | 05:02:17.18 | +07:38:21.4 | 157 | 600 |
| 2005ds | 5322 | 1470 | 17:57:39.89 | +27:50:18.4 | 97 | 300 |
| 2005ep | 5151 | 1421 | 16:56:35.49 | +58:01:30.2 | 121 | 300 |
| 2005gl | 5072 | 1417 | 00:49:50.02 | +32:16:56.8 | 65 | 300 |
| 2005gn | 5065 | 1479 | 05:48:49.07 | 24:22:45.5 | 165 | 600 |
| 2005ly | 5108 | 1349 | 01:23:28.84 | +30:46:45.7 | 143 | 600 |
| 2005ma | 5187 | 1384 | 04:49:53.91 | 10:45:23.4 | 62 | 300 |
| 2006aa | 5075 | 1547 | 11:53:19.89 | +20:45:18.2 | 85 | 300 |
| 2006am | 5139 | 1276 | 14:27:37.24 | +41:15:35.4 | 37 | 300 |
| 2006bo | 5322 | 1320 | 20:30:41.90 | +09:11:40.8 | 63 | 300 |
| 2006bv | 5077 | 1348 | 12:41:01.55 | +63:31:11.6 | 35 | 300 |
| 2006cu | 5322 | 1181 | 14:47:43.31 | +09:39:33.9 | 119 | 300 |
| 2006cy | 5159 | 1426 | 13:08:01.23 | +26:06:59.0 | 150 | 600 |
| 2006dc | 5118 | 1179 | 16:16:04.04 | 22:37:16.7 | 107 | 300 |
| 2006eh | 5140 | 1127 | 02:50:11.95 | +47:03:20.5 | 114 | 300 |
| 2006fp | 5200 | 1082 | 22:45:41.13 | +73:09:47.8 | 21 | 300 |
| 2006gy | 5073 | 1111 | 03:17:27.06 | +41:24:19.5 | 76 | 300 |
| 2006jd | 5201 | 1149 | 08:02:07.43 | +00:48:31.5 | 77 | 300 |
| 2006qq | 5108 | 1048 | 05:19:50.43 | 20:58:06.4 | 119 | 300 |
| 2007K | 5081 | 1069 | 09:14:26.21 | +36:06:52.4 | 90 | 300 |
| 2007ak | 5322 | 965 | 05:20:40.75 | +08:48:16.0 | 66 | 300 |
| 2007bb | 5062 | 953 | 07:01:07.46 | +51:15:57.3 | 86 | 300 |
| 2007cm | 5066 | 964 | 12:42:45.18 | +55:08:57.1 | 66 | 300 |
| 2007pk | 5322 | 660 | 01:31:47.07 | +33:36:54.1 | 69 | 300 |
| 2007rt | 5203 | 780 | 11:02:34.29 | +50:34:58.5 | 93 | 300 |
| 2008B | 5066 | 597 | 15:02:43.65 | +23:20:07.8 | 79 | 300 |
| 2008J | 5135 | 593 | 02:34:24.20 | 10:50:38.5 | 66 | 300 |
| 2008aj | 5322 | 812 | 13:33:06.33 | +33:08:59.0 | 102 | 300 |
| 2008be | 5066 | 636 | 14:27:48.71 | +69:41:50.8 | 123 | 300 |
| 2008cg | 5135 | 474 | 15:54:15.15 | +10:58:25.0 | 151 | 600 |
| 2008en | 5065 | 386 | 00:55:13.56 | +35:26:26.2 | 151 | 600 |
| 2008fm | 5169 | 351 | 23:49:03.51 | +26:47:39.3 | 157 | 600 |
| 2008gm | 5199 | 301 | 23:14:12.39 | 02:46:52.4 | 49 | 300 |
| 2008ip | 5088 | 490 | 12:57:50.20 | +36:22:33.5 | 63 | 300 |
Warm /IRAC (Fazio et al., 2004) surveyed the positions of the 69 SNe IIn in the sample. Although the warm mission is limited to IRAC bands 1 (3.6 µm) and 2 (4.5 µm), ground-based observations cannot compete because they have limited sensitivity past 2 µm given the rapidly rising thermal background. Furthermore, these two bands span the peak of the blackbody emission from warm dust ( K), providing potential constraints on the dust temperature and mass (and thus the luminosity). Assuming peak luminosities comparable to that of SN 2005ip (Fox et al., 2010) for each SN, we developed Astronomical Observation Requests (AORs) that would yield signal-to-noise ratio (SNR) 25 at 4.5 µm to ensure the most-reliable extraction of the temperature and mass from the fluxes in the two bands. All integration times were rounded up to a multiple of 5 min to produce a simple and straightforward AOR. Table 2 lists the observational details.
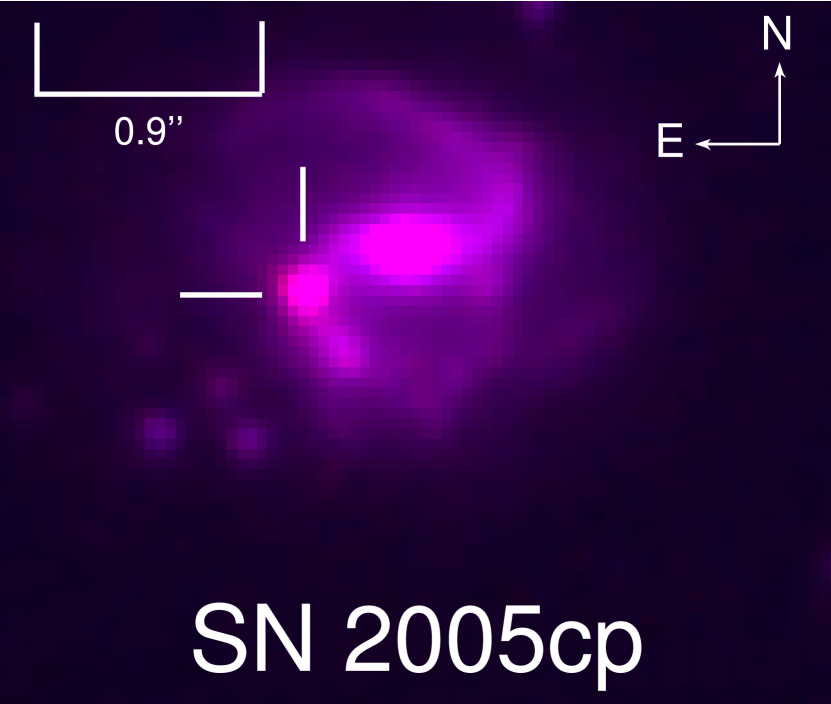
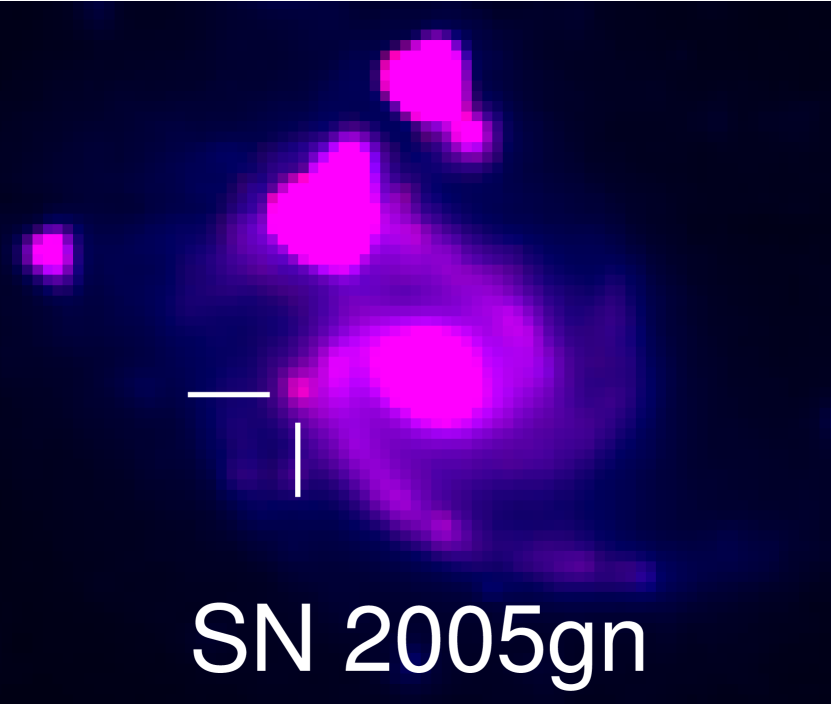
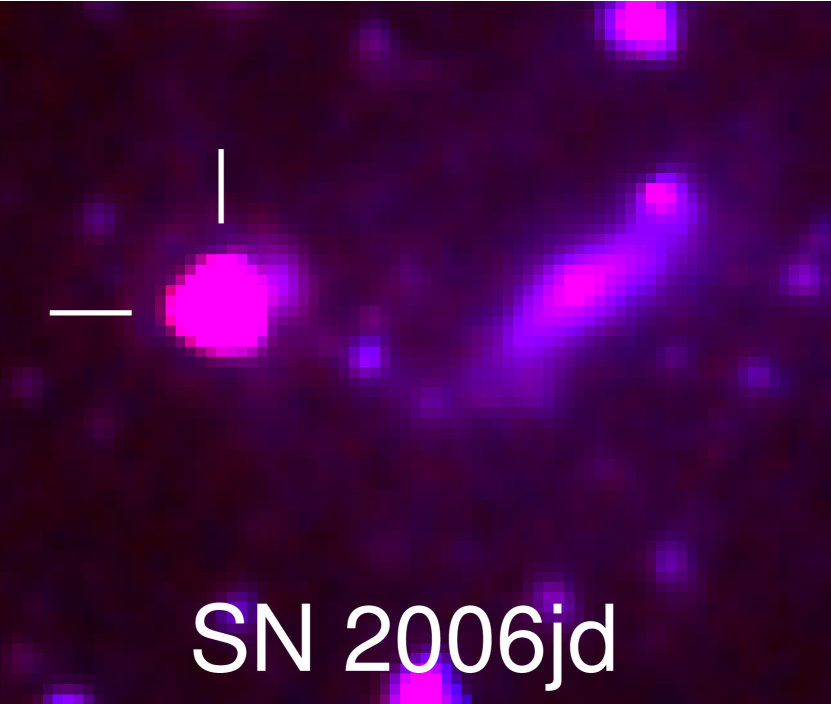
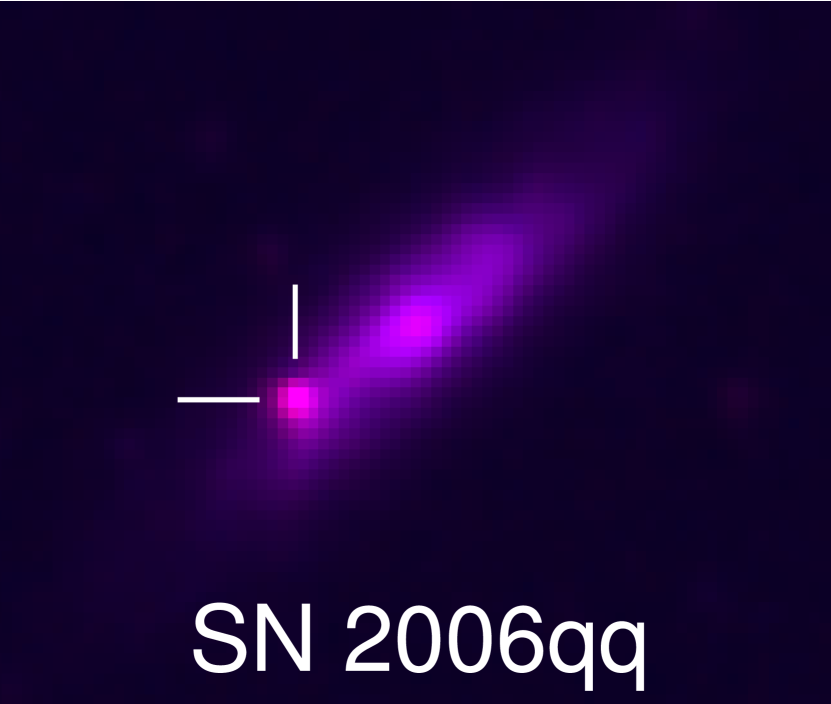
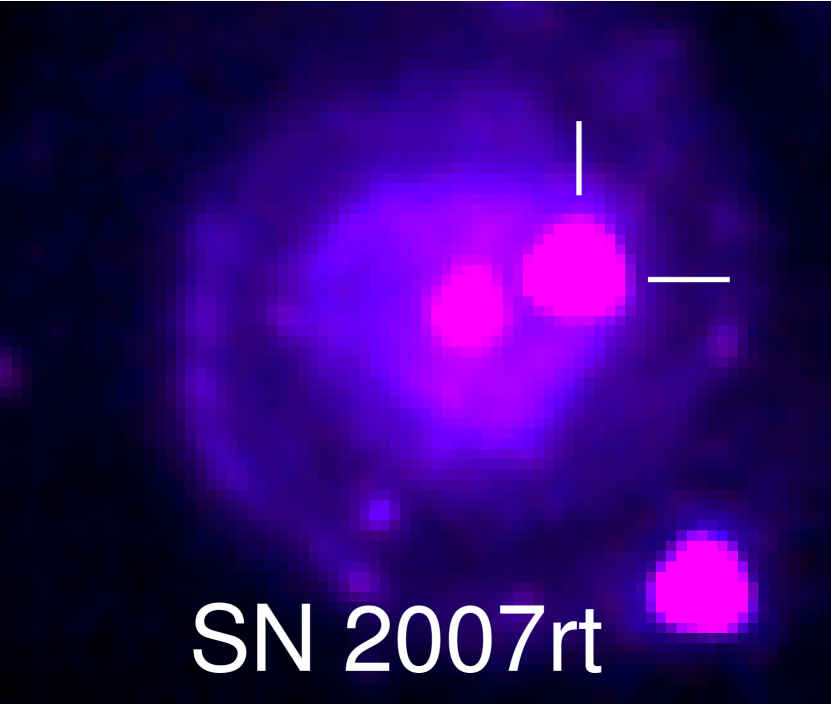

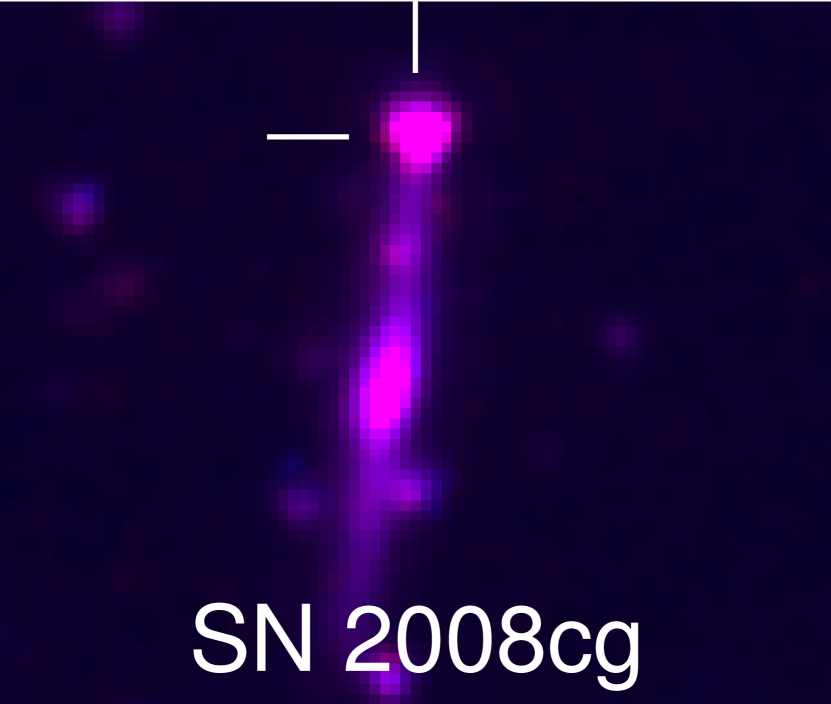
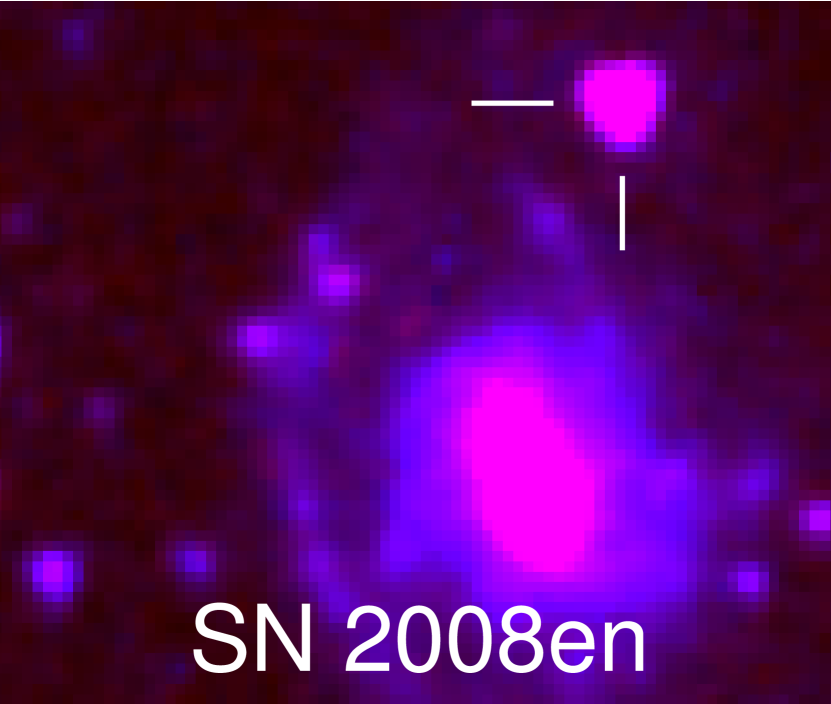
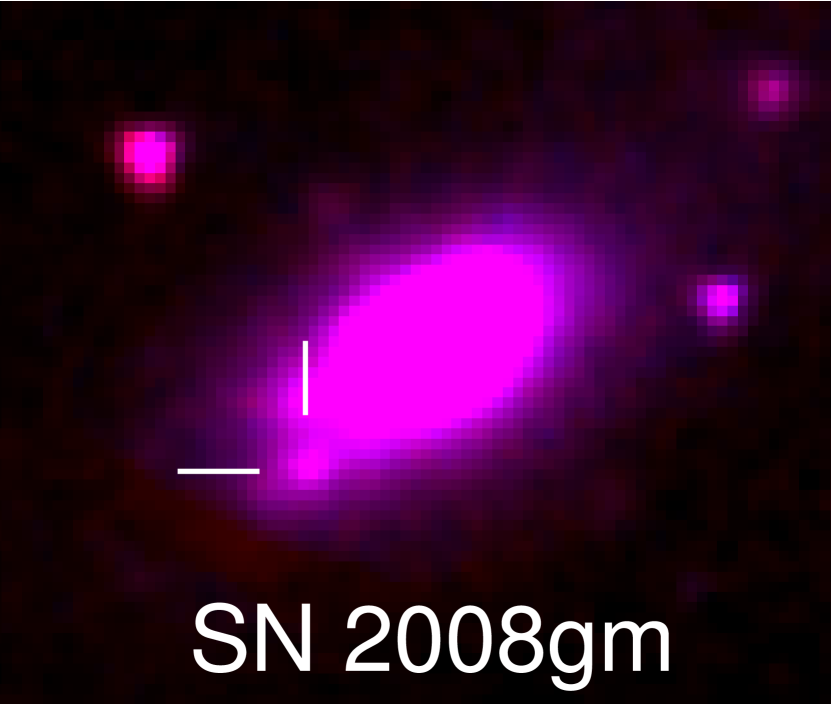
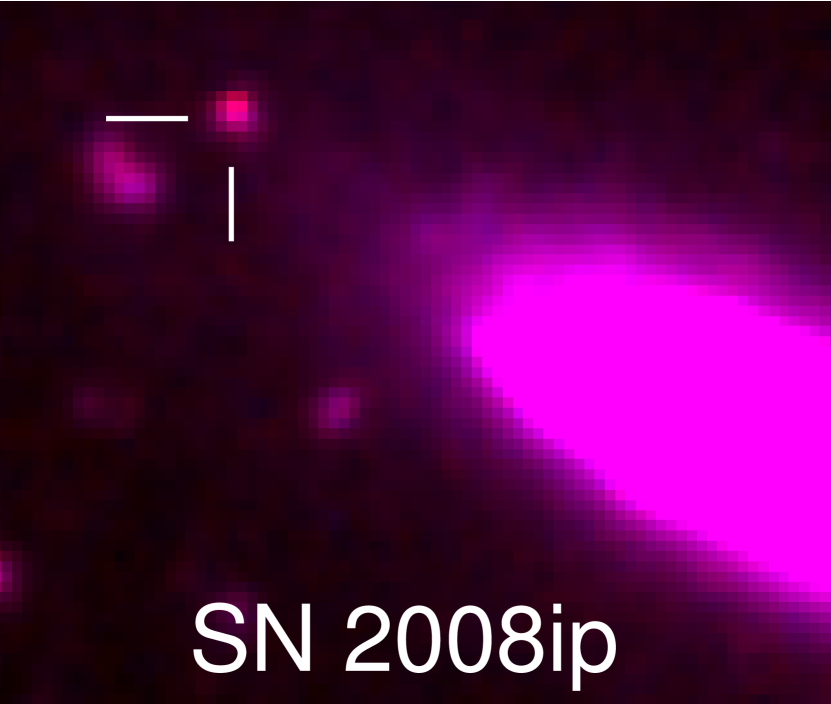
The Leopard333Leopard can be downloaded from http://ssc.spitzer.caltech.edu/propkit/spot/ . software package provided access to the Post Basic Calibrated Data (pbcd), which are already fully coadded and calibrated. Supernova detections were initially identified with photometry routines (SNR 3) and later confirmed with a visual inspection. Of the 69 SN positions surveyed, 10 SNe exhibit late-time emission (see Figure 1).
The background flux in most of the SN host galaxies is bright and exhibits rapid spatial variations, making faint detections difficult for the DAOPHOT point-spread function (PSF) photometry package in IRAF444IRAF: the Image Reduction and Analysis Facility is distributed by the National Optical Astronomy Observatory, which is operated by the Association of Universities for Research in Astronomy (AURA) under cooperative agreement with the National Science Foundation (NSF). and limiting the accuracy of sky-brightness measurements using the annuli in the IRAF APPHOT (aperture photometry) package. Although template subtraction is a commonly used technique to minimize photometric confusion from the underlying galaxy, no pre-SN observations exist.
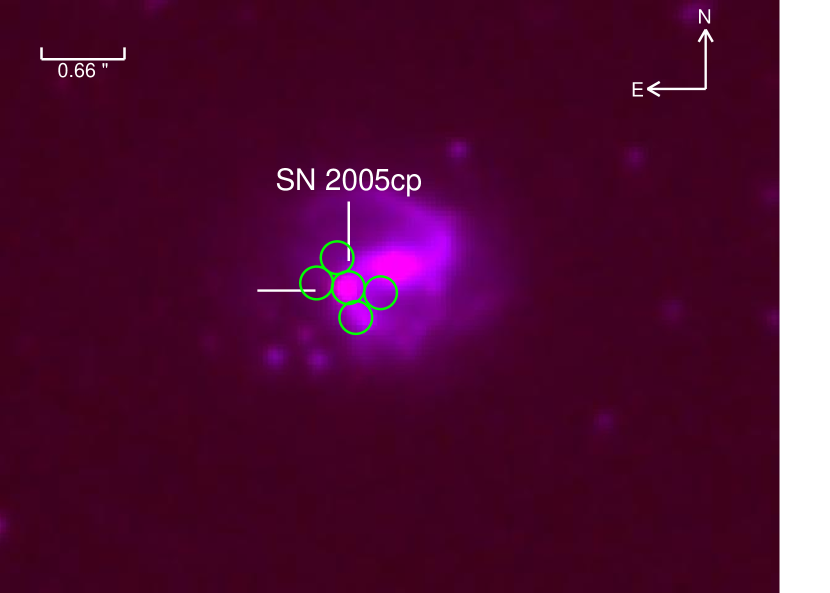
Instead, photometry was performed by using a set of single apertures, with a radius defined by a fixed multiple of the PSF full width at half-maximum intensity (FWHM), to estimate both the SN and average background flux. This technique allowed the user to visually identify only local background associated with the SN, as opposed to the annuli imposed by APPHOT. Figure 2 illustrates this technique in the case of SN 2005cp, where the circles identify the apertures used to extract both the SN and background fluxes. Nearby stellar and nuclear flux, which would normally be included in the sky annuli, do not significantly contribute to the SN flux and are ignored by this technique.
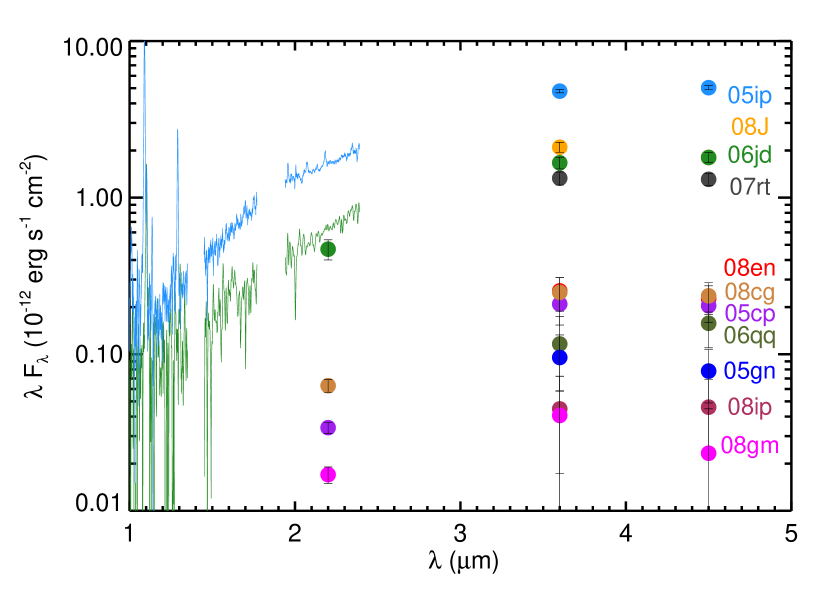
Pixel fluxes were converted from mJy sr-1 to mJy according to the IRAC Data Handbook version 3, which discusses the pixel size and aperture correction in detail. The DAOPHOT and APPHOT results for the brighter SNe agreed within the uncertainties. Because DAOPHOT did not succeed in detecting the fainter events, however, we only include results from APPHOT. These fluxes are listed in Table 3 and plotted in Figure 3. Upper limits for nondetections (0.015 mJy at 4.5 µm) were set by the point-source sensitivity in Table 2.10 of the IRAC Instrument Handbook version 2. In some cases, coincident near-IR data from several other instruments exists (see below).
2.2. Survey Supernova Detections
SN 2005cp was discovered in UGC 12886 on 2005 June 20.48 (UT dates are used throughout this paper; mag) by Lee et al. (2005) and spectrally classified by Modjaz et al. (2005). The line profiles consist of both a narrow (FWHM 400 km s-1) and intermediate (FWHM 4000 km s-1) component. Kiewe et al. (2010) provide additional early-time optical photometry and spectra, as well as an associated mass-loss rate.
SN 2005gn was discovered in ESO 488-G30 on 2005 October 13.53 ( mag) by Luckas et al. (2005) and Prasad & Li (2005), and spectrally classified by Blanc et al. (2005) and Marsden (2005). The line profiles consist of narrow, intermediate, and broad features, although no line widths were reported.
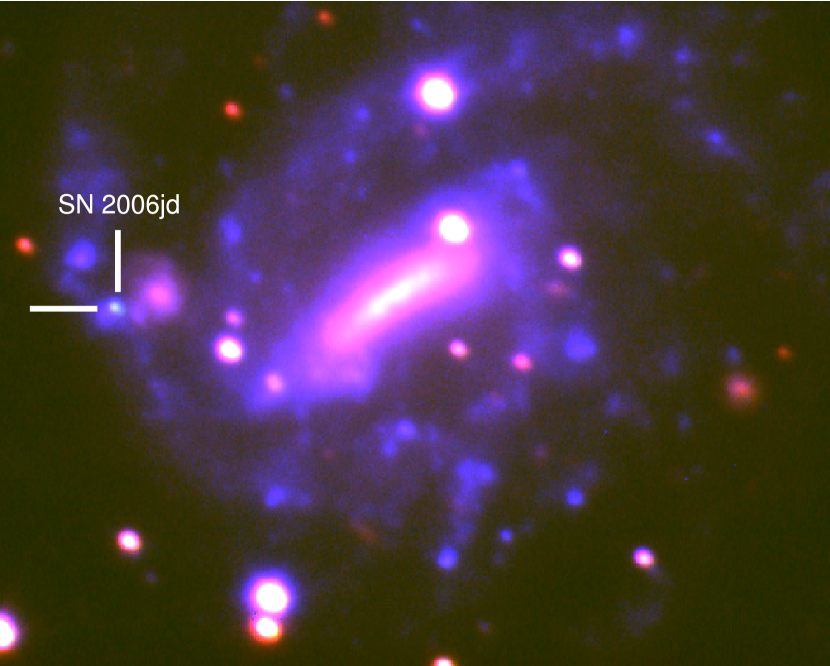
SN 2006jd was discovered in UGC 4179 on 2006 October 12.54 ( mag) by Itagaki et al. (2006) and Prasad & Li (2006). It was classified as a SN IIn, but no line widths were reported. Immler et al. (2007) found an associated X-ray luminosity of erg s-1 and a visual magnitude on 2007 November 16.73. Swift/XRT measured an X-ray luminosity erg s-1 on day 400 (Immler et al., 2007), and Chandra & Soderberg (2007) reported a radio flux density of Jy on day 405.
| SN | Epoch | 3.6 µm**1 uncertainties are given in parentheses. | 4.5 µm**1 uncertainties are given in parentheses. |
|---|---|---|---|
| (days) | (mJy) | (mJy) | |
| 2005cp | 1523 | 0.25(0.07) | 0.31(0.07) |
| 2005gn | 1479 | 0.11(0.04) | 0.12(0.04) |
| 2005ip | 948 | 5.76(0.14) | 7.54(0.22) |
| 2006jd | 1149 | 2.00(0.17) | 2.71(0.20) |
| 2006qq | 1048 | 0.14(0.07) | 0.24(0.07) |
| 2007rt | 780 | 1.60(0.15) | 1.96(0.17) |
| 2008J | 593 | 2.52(0.18) | 2.71(0.19) |
| 2008cg | 474 | 0.30(0.07) | 0.35(0.08) |
| 2008en | 386 | 0.30(0.07) | 0.34(0.07) |
| 2008gm | 301 | 0.05(0.04) | 0.03(0.03) |
| 2008ip | 438 | 0.05(0.03) | 0.07(0.03) |
SN 2006qq was discovered in ESO 553-G36 on 2006 October 27.40 (, mag) by Prasad et al. (2006) and classified by Silverman et al. (2006). The line profiles consist of narrow (FWHM 900 km s-1) emission upon a relatively featureless continuum.
SN 2007rt was discovered in UGC 6109 on 2007 November 24.54 ( mag) by Li (2007). It was spectrally classified as a SN IIn about 2–3 months past maximum light (Blondin & Berlind, 2007). The line profiles consist of both an intermediate (FWHM 2500 km s-1) and broad (FWHM 10,000 km s-1) component. A moderate-resolution spectrum reveals an additional narrow H P-Cygni profile (FWHM 100 km s-1) and evidence for new dust formation (Trundle et al., 2009). On day 48, Chandra & Soderberg (2008b) did not detect any radio emission and assigned an upper limit of Jy.
SN 2008J was discovered in MCG–02-7-33 on 2008 February 15.19 ( mag) by Thrasher et al. (2008) and classified by (Stritzinger et al., 2008). The line profiles consist of both a narrow and intermediate component, although the line widths were not listed.
SN 2008cg was discovered in FGC 1965 on 2008 May 5.39 () by Drake et al. (2008) and classified by (Blondin & Hernandez, 2008). The line profiles consist of both a narrow (FWHM 300 km s-1) and intermediate (FWHM 1500 km s-1) component. Swift/UVOT measured mag on day 58 (Immler et al., 2008). On day 57, however, Chandra & Soderberg (2008a) did not detect any radio emission and assigned an upper limit of Jy.
SN 2008en was discovered in UGC 564 on 2008 August 3.06 ( mag) by Boles (2008) and spectrally classified by Steele et al. (2008). These spectra reveal broad (FWHM 3700 km s-1) Balmer and He I emission lines.
SN 2008gm was discovered in NGC 7530 on 2008 October 22.09 ( mag) by Pignata et al. (2008) and classified by Prieto et al. (2008). The line profiles consist of both a narrow (FWHM 300 km s-1) and intermediate (FWHM 1600 km s-1) component. Two days following the discovery, Soderberg (2008) did not detect any radio emission and assigned an upper limit of 0.08 mJy (3).
2.3. Near-Infrared Photometry and Spectroscopy
| SN | Epoch | Instrument | Blue | Red | Int |
|---|---|---|---|---|---|
| (days) | Resolution | Resolution | (s) | ||
| 2005cp | 10 | Lick/Kast | 7.7 | 10.4 | 900 |
| 2006jd | 395 | Keck/LRIS | 6.5 | 7 | 900 |
| 564 | Keck/LRIS | 6.5 | 5.8 | 600 | |
| 2006qq | 1 | Lick/Kast | 6 | 10.9 | 1800 |
| 20 | Lick/Kast | 6.7 | 10.0 | 2100 | |
| 2008J | 32 | Lick/Kast | 4.9 | 11.9 | 900 |
| 199 | Lick/Kast | 6 | 11 | 900 | |
| 224 | Lick/Kast | 6.7 | 12.3 | 900 | |
| 236 | Lick/Kast | 7.4 | 12.3 | 1200 | |
| 251 | Lick/Kast | 4.6 | 11.0 | 1200 | |
| 266 | Lick/Kast | 4.4 | 11.0 | 1200 | |
| 313 | Lick/Kast | 4.8 | 5 | 1200 | |
| 2008cg | 3 | Lick/Kast | 5.3 | 11.6 | 1800 |
| 10 | Lick/Kast | 5.5 | 11.7 | 1800 | |
| 55 | Lick/Kast | 5.9 | 10.8 | 1500 | |
| 63 | Lick/Kast | 6 | 11.3 | 1500 | |
| 114 | Keck/LRIS | 4.5 | 7 | 454 | |
| 2008en | 5 | Lick/Kast | 6.7 | 12.5 | 1800 |
| 2008gm | 5 | Keck/LRIS | 6.5 | 7 | 400 |
Nearly coincident near-IR photometric data were collected for several targets with the Persson Auxiliary Nasmyth Infrared Camera (PANIC; Martini et al., 2004) mounted on the 6.5-m Magellan (Walter Baade) Telescope at the Las Campanas Observatory, Chile. PANIC obtained - and -band photometry of SNe 2008gm (363 days post-discovery), 2008cg (659 days), 2006jd (1230 days), and 2005cp (1582 days). Standard near-IR data-reduction techniques were implemented. The relatively small galaxy sizes allow data frames to double as sky exposures, provided a sufficiently large dither avoids an overlapping galaxy from one exposure to the next. Photometry was performed with the DAOPHOT PSF-fitting techniques. The results are plotted in Figure 3 adjacent to the photometry and, together, are treated as a single epoch given the near simultaneity of the observations relative to the overall epoch of observation.
TripleSpec, a 0.9–2.5 µm, resolution spectrograph operating at Apache Point Observatory in NM (Wilson et al., 2004; Herter et al., 2008), was used to obtain a spectrum of SN 2006jd on day 1250 post-discovery and a spectrum of SN 2005ip on day 862 post-discovery (originally published by Fox et al. 2010). Forty minutes of on-source integration consisted of 8 independent 5 min exposures nodding between 2 different slit positions. We extracted the spectra with a modified version of the IDL-based SpexTool (Cushing et al., 2004). Any underlying galactic and sky emission are approximated in SpexTool by a polynomial fit and subtracted from the SN. The results are again plotted in Figure 3 and, combined with the data, treated as a single epoch.
2.4. Optical Photometry and Spectroscopy
Table 4 summarizes the optical spectra obtained with various instruments. Data were obtained with the dual-arm Low Resolution Imaging Spectrometer (LRIS; Oke et al., 1995) mounted on the 10-m Keck I telescope, as well as with the Kast double spectrograph (Miller & Stone, 1993) mounted on the Shane 3-m telescope at Lick Observatory. Keck/LRIS spectra were obtained using the 600/4000 or 400/3400 grisms on the blue side and the 400/8500 grating on the red side, along with a 1″ wide slit. This resulted in a wavelength coverage of 3200–9200 Å and a typical resolution of 5–7 Å. Almost every Lick/Kast spectrum was obtained using the 600/4310 grism on the blue side and the 300/7500 grating on the red side, along with a 2″ wide slit. This resulted in a wavelength coverage of 3300–10,400 Å and resolutions of about 5–7 Å and 10–12 Å on the blue and red sides, respectively. Most observations had the slit aligned along the parallactic angle to minimize differential light losses (Filippenko, 1982).
The spectra were reduced using standard techniques (e.g., Foley et al., 2003). Routine CCD processing and spectrum extraction were completed with IRAF, and the data were extracted with the optimal algorithm of Horne (1986). We obtained the wavelength scale from low-order polynomial fits to calibration-lamp spectra. Small wavelength shifts were then applied to the data after cross-correlating a template sky to an extracted night-sky spectrum. Using our own IDL routines, we fit a spectrophotometric standard-star spectrum to the data in order to flux calibrate the SN and to remove telluric absorption lines (Wade & Horne, 1988; Matheson et al., 2000).
Keck/LRIS also obtained photometry of SNe 2006jd (1609 days) and 2007rt (1223 days) on 2011 March 9. Observations of each target consisted of two dithered 120-s exposures in each band. Again, the data were reduced using standard techniques and routine CCD processing with IRAF. Table 5 lists the photometric results. Only SN 2006jd was detected (see Figure 4), but upper limits for SN 2007rt are also provided.
| SN | Epoch | Luminosity | |||
|---|---|---|---|---|---|
| (days) | (mag) | (mag) | (mag) | (log (/L⊙)) | |
| 2006jd | 1609 | 25.0 | 20.30.5 | 22.5 | 7.6 |
| 2007rt | 1223 | 25 | 24 | 24 | 6.1 |
2.5. Dust Composition, Temperature, and Mass
| Graphites | Silicates | Blackbody | |||||||
|---|---|---|---|---|---|---|---|---|---|
| (µm) | (K) | (M⊙) | (L⊙) | (K) | (M⊙) | (L⊙) | (K) | (M⊙) | (L⊙) |
| SN 2005cp | |||||||||
| 0.01 | 575 | 7.39e-3 | 5.65e+7 | 648 | 1.51e-2 | 2.06e+8 | 710 | 9.09e-6 | 6.86e+7 |
| 0.10 | 554 | 6.81e-3 | 5.63e+7 | 643 | 1.55e-2 | 2.07e+8 | 710 | 9.08e-5 | 6.85e+7 |
| 0.30 | 580 | 1.79e-3 | 5.15e+7 | 614 | 1.78e-2 | 2.13e+8 | 710 | 2.70e-4 | 6.79e+7 |
| SN 2005gn | |||||||||
| 0.01 | 776 | 2.06e-3 | 8.39e+7 | 991 | 3.12e-3 | 1.72e+8 | 1220 | 1.52e-6 | 1.06e+8 |
| 0.10 | 737 | 1.92e-3 | 8.36e+7 | 981 | 3.18e-3 | 1.73e+8 | 1220 | 1.51e-5 | 1.06e+8 |
| 0.30 | 735 | 6.75e-4 | 7.52e+7 | 917 | 3.67e-3 | 1.75e+8 | 1220 | 4.50e-5 | 1.05e+8 |
| SN 2005ip | |||||||||
| 0.01 | 483 | 4.73e-2 | 1.36e+8 | 525 | 9.12e-2 | 6.23e+8 | 567 | 5.12e-5 | 1.49e+8 |
| 0.10 | 468 | 4.34e-2 | 1.35e+8 | 522 | 9.30e-2 | 6.26e+8 | 567 | 5.11e-4 | 1.48e+8 |
| 0.30 | 469 | 1.46e-2 | 1.19e+8 | 503 | 1.07e-1 | 6.50e+8 | 567 | 1.52e-3 | 1.47e+8 |
| SN 2006jd | |||||||||
| 0.01 | 602 | 3.21e-2 | 3.18e+8 | 733 | 4.90e-2 | 9.94e+8 | 836 | 2.70e-5 | 4.03e+8 |
| 0.10 | 579 | 2.96e-2 | 3.17e+8 | 728 | 5.00e-2 | 1.00e+9 | 836 | 2.70e-4 | 4.02e+8 |
| 0.30 | 561 | 1.13e-2 | 2.65e+8 | 692 | 5.76e-2 | 1.02e+9 | 836 | 8.01e-4 | 3.98e+8 |
| SN 2006qq | |||||||||
| 0.01 | 518 | 1.71e-2 | 7.30e+7 | 601 | 2.75e-2 | 2.94e+8 | 672 | 1.45e-5 | 8.68e+7 |
| 0.10 | 501 | 1.58e-2 | 7.27e+7 | 598 | 2.79e-2 | 2.95e+8 | 672 | 1.45e-4 | 8.66e+7 |
| 0.30 | 500 | 5.54e-3 | 6.66e+7 | 575 | 3.16e-2 | 3.03e+8 | 672 | 4.30e-4 | 8.58e+7 |
| SN 2007rt | |||||||||
| 0.01 | 653 | 2.39e-2 | 3.71e+8 | 793 | 3.76e-2 | 9.84e+8 | 926 | 1.92e-5 | 4.37e+8 |
| 0.10 | 625 | 2.22e-2 | 3.70e+8 | 787 | 3.83e-2 | 9.87e+8 | 926 | 1.92e-4 | 4.36e+8 |
| 0.30 | 624 | 7.79e-3 | 3.41e+8 | 747 | 4.37e-2 | 1.00e+9 | 926 | 5.70e-4 | 4.32e+8 |
| SN 2008J | |||||||||
| 0.01 | 739 | 9.41e-3 | 2.92e+8 | 930 | 1.44e-2 | 6.37e+8 | 1125 | 7.13e-6 | 3.58e+8 |
| 0.10 | 704 | 8.73e-3 | 2.91e+8 | 921 | 1.47e-2 | 6.40e+8 | 1125 | 7.12e-5 | 3.58e+8 |
| 0.30 | 702 | 3.07e-3 | 2.64e+8 | 865 | 1.69e-2 | 6.48e+8 | 1125 | 2.12e-4 | 3.54e+8 |
| SN 2008cg | |||||||||
| 0.01 | 629 | 1.43e-2 | 1.80e+8 | 716 | 2.93e-2 | 5.52e+8 | 975 | 7.70e-6 | 2.17e+8 |
| 0.10 | 604 | 1.32e-2 | 1.79e+8 | 710 | 3.02e-2 | 5.57e+8 | 975 | 7.69e-5 | 2.16e+8 |
| 0.30 | 635 | 3.43e-3 | 1.67e+8 | 675 | 3.48e-2 | 5.70e+8 | 975 | 2.28e-4 | 2.14e+8 |
| SN 2008en | |||||||||
| 0.01 | 714 | 7.23e-3 | 1.84e+8 | 888 | 1.11e-2 | 4.23e+8 | 1062 | 5.58e-6 | 2.23e+8 |
| 0.10 | 681 | 6.70e-3 | 1.84e+8 | 881 | 1.14e-2 | 4.25e+8 | 1062 | 5.57e-5 | 2.22e+8 |
| 0.30 | 679 | 2.36e-3 | 1.68e+8 | 829 | 1.30e-2 | 4.31e+8 | 1062 | 1.66e-4 | 2.20e+8 |
| SN 2008gm | |||||||||
| 0.01 | 757 | 7.00e-5 | 2.47e+6 | 890 | 1.40e-4 | 5.36e+6 | 1013 | 8.31e-8 | 2.73e+6 |
| 0.10 | 721 | 6.47e-5 | 2.46e+6 | 880 | 1.45e-4 | 5.39e+6 | 1013 | 8.29e-7 | 2.73e+6 |
| 0.30 | 766 | 1.69e-5 | 2.36e+6 | 827 | 1.68e-4 | 5.48e+6 | 1013 | 2.46e-6 | 2.70e+6 |
| SN 2008ip | |||||||||
| 0.01 | 634 | 4.52e-4 | 5.93e+6 | 765 | 7.12e-4 | 1.66e+7 | 886 | 3.66e-7 | 6.96e+6 |
| 0.10 | 608 | 4.18e-4 | 5.91e+6 | 759 | 7.25e-4 | 1.66e+7 | 886 | 3.66e-6 | 6.95e+6 |
| 0.30 | 606 | 1.47e-4 | 5.46e+6 | 721 | 8.27e-4 | 1.69e+7 | 886 | 1.09e-5 | 6.88e+6 |
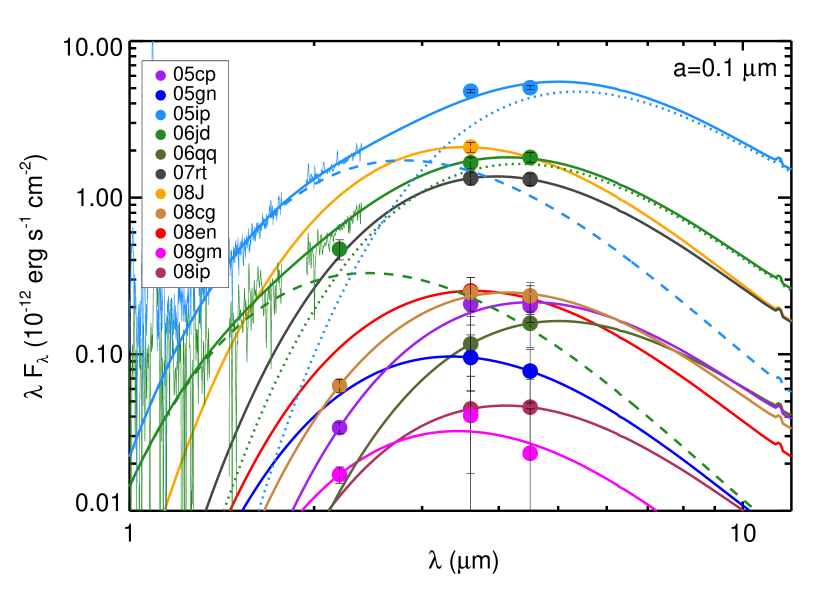
Assuming only thermal emission, the combined near-IR and mid-IR spectra provide a strong constraint on the dust temperature and mass, and thus on the IR luminosity. Assuming optically thin dust with mass , with a particle radius , at a distance from the observer, thermally emitting at a single equilibrium temperature , the flux can be written as (e.g., Hildebrand, 1983)
| (1) |
where is the Planck blackbody function and is the dust mass absorption coefficient.
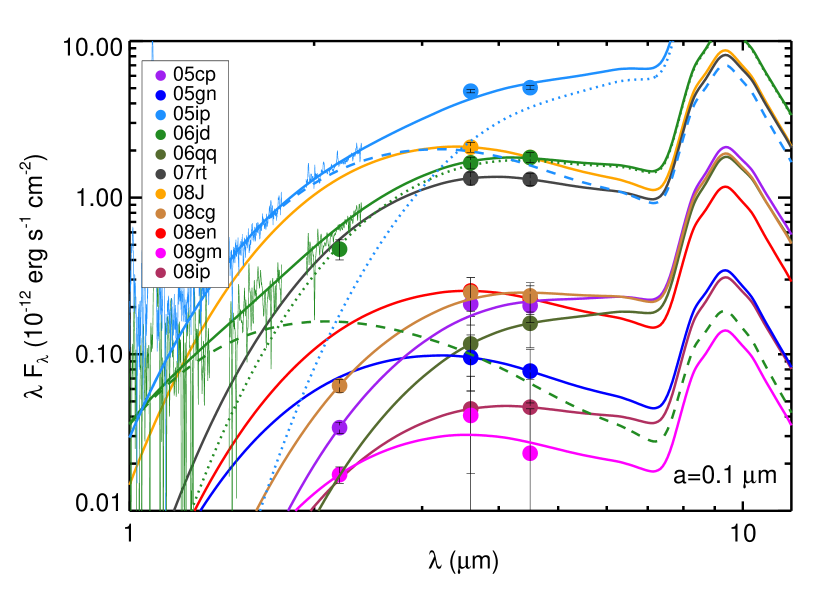
For simple dust populations of a single size composed entirely of either silicate or graphite, the IDL MPFIT function (Markwardt, 2009) finds the best fit (see Figure 5) of Equation 1 by varying and to minimize the value of . The absorption coefficients, , are given in Figure 4 of Fox et al. (2010). The combined photometry and near-IR spectra of SNe 2006jd and 2005ip are best fit by a multi-component model. As opposed to a single component with a continuous temperature distribution, a second, hotter component at a single temperature dominates the near-IR flux, while also contributing to the 3.6 µm flux. For the remaining SNe, the small number of photometric data points limits our fits to a single component. Since a second, hotter component may be contributing to the shorter wavelength flux, we treat the derived dust temperatures for these SNe as upper limits (see §3.3 below for significance).
Table 6 lists the best-fit parameters (i.e., temperature and mass, as well as IR luminosity) for several grain sizes. Overall, grain size has little consequence on the goodness of fit or the resulting parameters. The only size-dependent parameter in Equation 1 is , but Figure 4 of Fox et al. (2010) shows that the dust-opacity coefficient for both graphite and silicate is independent of grain radius at IR wavelengths (1 µm) for grain sizes 1 µm, which is typical for most grains. A grain size of µm is therefore assumed throughout the rest of this paper, including the results plotted in Figure 5.
In general, the derived dust temperatures, masses, and luminosities are all higher if we assume silicate grain composition. The limited number of data points (2 or 3 in most cases), however, limits the best-fitting function in Figure 5 from distinguishing between the two compositions. The most obvious differentiating feature is the 9 µm silicate emission band, but the warm IRAC data do not extend beyond 5 µm. Both compositions are therefore considered throughout the rest of this paper.
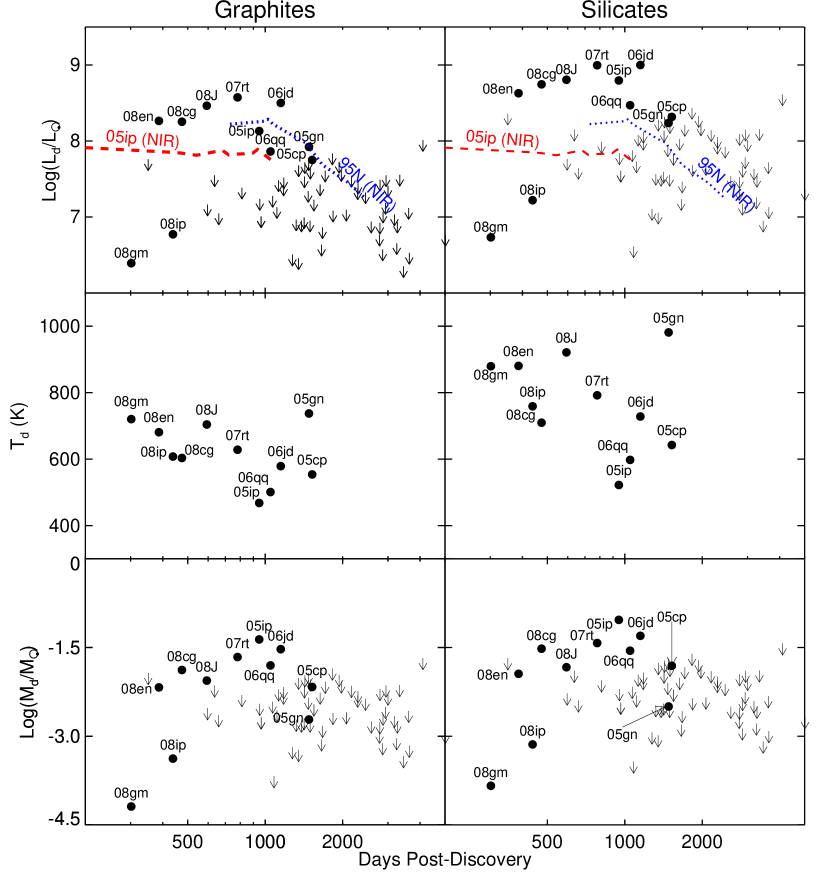
Figure 6 plots the temperature, mass, and IR luminosity for µm grains for both the graphite and silicate fits, as well as the near-IR evolution of the Type IIn SNe 2005ip (Fox et al., 2009) and 1995N (Gerardy et al., 2002). The luminosity curve plateaus to a point between 1000 and 2000 days (3–5 yr), at which time it seems to slowly fade with an -fold time of several hundred days. Although many of the points are upper limits, the trend appears to closely follow the observed near-IR decline of SN 1995N. Furthermore, at least half of the SNe have derived dust masses M⊙ (and most of the rest have masses M⊙). If newly formed, these masses would be some of the largest amounts of such dust observed in SNe to date, providing significant credibility to SN dust models (e.g., Nozawa et al., 2003, 2008). Before any conclusions are drawn, however, we must first disentangle the composition, origin, and heating mechanism of the dust.
3. Analysis: Dust Origin and Heating Mechanism
The dust can have several different origins and heating mechanisms. It may be newly formed or it may have been in place at the time of the explosion. If newly formed, the dust may have condensed in the expanding SN ejecta (e.g., Elmhamdi et al., 2004) or in the cool, dense shell of post-shocked gas lying between the forward and reverse shocks (Pozzo et al., 2004; Smith et al., 2008b). In both cases, several heating mechanisms are possible, including radioactivity, radiative heating by the optical emission from circumstellar interaction, and collisional heating by hot gas in the reverse shock.
Alternatively, pre-existing dust may be collisionally heated by hot, shocked gas or radiatively heated by either the peak SN luminosity or the late-time optical emission from circumstellar interaction. In the radiative heating case, the dust reprocesses the optical light and thermal radiation persists until the dust grains cool sufficiently. If this pre-existing dust is distributed in a shell with a light-crossing time greater than the duration of the optical emission, an “IR echo” is evident due to light-travel-time effects. Multiple scenarios can also contribute to the late-time IR flux, as in the cases of SNe 2004et (Kotak et al., 2009), 2004dj (Meikle et al., 2011), and 2006jc (Mattila et al., 2008).
With a detailed analysis of SN 2005ip, Fox et al. (2010) illustrate how to use late-time mid-IR observations, along with optical photometry and spectra, to disentangle the various dust models. First, a few variables must be defined. The blackbody radius
| (2) |
where is the Stefan-Boltzmann constant. The calculation of the blackbody radius assumes an optically thick dust shell. While our calculations assume the case of optically thin dust, the blackbody radius sets the minimum shell size of an observed dust component.
The shock radius
| (3) |
for a constant shock velocity , defines the maximum radius that the forward shock can travel in a time . The shock velocity corresponds to the optical spectral line widths. Three width components are typical for SNe IIn (see Figures 7, 8, and 9, as well as §2.2): narrow ( km s-1), intermediate (–5000 km s-1), and broad (–15,000 km s-1). The narrow lines, which give the Type IIn subclass its name, originate in the slow, dense, pre-existing circumstellar environment when excited by X-ray and ultraviolet (UV) emission generated by the forward shock. The intermediate lines correspond to the decelerated forward-shock front as it passes through the dense clumps in the CSM. The broad lines, which set the shock velocity, arise from the uninhibited forward shock arising from the rapidly expanding SN ejecta. Over time, the dense CSM decelerates the entire ejecta. Typical forward shock velocities in SNe IIn at late times are km s-1 (e.g., Smith et al., 2007; Trundle et al., 2009; Rest et al., 2011).
Table 7 lists the associated blackbody and shock radii for each SN at the epoch of the observation, assuming a shock velocity of km s-1. Notice that unlike the shock radius, the blackbody radius is not a function of the observation epoch to the extent that the luminosity is constant.
| SN | Epoch | aaThe blackbody radius given by Equation 2. | bbThe shock radius given by Equation 3 for =5000 km s-1. | ccThe IR echo radius given by Equation 5. | ddThe vaporization radius is the radius at which the dust temperature equals the dust vaporization temperature. |
|---|---|---|---|---|---|
| (days) | (ly) | (ly) | (ly) | (ly) | |
| 2005cp | 1523 | 0.038 | 0.066 | 2.1 | 0.012 |
| 2005gn | 1479 | 0.016 | 0.064 | 2.0 | 0.013 |
| 2005ip | 948 | 0.031 | 0.040 | 1.3 | 0.01 |
| 2006jd | 1149 | 0.067 | 0.050 | 1.6 | 0.01 |
| 2006qq | 1048 | 0.048 | 0.044 | 1.4 | 0.016 |
| 2007rt | 780 | 0.057 | 0.034 | 1.1 | 0.02 |
| 2008J | 593 | 0.035 | 0.026 | 0.81 | 0.02 |
| 2008cg | 474 | 0.036 | 0.020 | 0.65 | 0.02 |
| 2008en | 386 | 0.031 | 0.016 | 0.53 | 0.011 |
| 2008gm | 301 | 0.004 | 0.014 | 0.41 | 0.0065 |
| 2008ip | 438 | 0.008 | 0.020 | 0.60 | 0.015 |
Other useful parameters are the peak supernova UV-optical luminosity, , and the late-time optical luminosity, . Dominated by shock heating of the stellar envelope, the peak optical luminosity can vaporize all pre-existing dust within the vaporization radius (e.g., Dwek, 1985),
| (4) |
where Tevap is the vaporization temperature of the dust, and is the Planck-averaged value of the dust emissivity. Figure 8 of Fox et al. (2010) shows the relationship between the peak luminosity and vaporization radius. Given the limited number of published observations for each SN during the discovery period, we obtain our best estimates of the peak luminosities from the well-known SN archival website, www.astrosurf.com/snweb2. The maximum reported luminosities for each supernova are in the range L⊙. Table 7 lists the corresponding vaporization radii, all of which are within ly.
Whether a dust shell is located at or beyond , light-travel-time effects cause the thermal radiation from the dust grains to reach the observer over an extended period of time, thereby forming an “IR echo” (e.g., Bode & Evans, 1980; Dwek, 1983; Emmering & Chevalier, 1988, see §3.3 for further discussion). The IR echo duration defines the echo radius
| (5) |
Table 7 also lists the associated echo radii for each SN, where is a lower limit determined by the epoch of the latest observations.
At later times, once the radioactive component fades, interaction between the reverse shock can generate X-rays and UV radiation (e.g., Draine & Woods, 1991; Chugai, 1993; Chevalier & Fransson, 1994). In the dense CSM, this radiation may be reprocessed and emitted at optical wavelengths, . For example, for both SNe 2005ip (Immler & Pooley, 2007; Fox et al., 2009; Smith et al., 2009c) and 1995N (Gerardy et al., 2002), the observed late-time X-ray luminosity is lower than the optical/IR, and for SN 1995N, the UV accessible to the Hubble Space Telescope has a power comparable to the optical (Fransson et al., 2002). While late-time optical observations do not exist for most of the SNe in this paper, the late-time optical observations of SNe 2007rt (Trundle et al., 2009), 2006jd (see Table 5), and 2005ip (Smith et al., 2009c) serve as useful references.
3.1. Newly Formed Dust
New dust may condense in either the slowly moving ejecta or in the cool, dense shell behind the forward shock (and in front of the reverse shock). Since the dust will preferentially absorb emission from redshifted (far-side) material, the lack of attenuation in the red wing of the optical emission lines provides a straightforward method for testing whether the dust is newly formed. (Due to the SN geometry, dust in the slowly moving ejecta closest to the core absorbs redshifted emission from the broad, intermediate, and narrow lines, while dust in the cool dense shell beyond the fastest ejecta absorbs redshifted emission only from the intermediate and narrow components.)


Typically, such emission-line evidence for dust formation occurs at later epochs, once the ejecta expand and become optically thin. For the first 40–50 days, larger optical depths in the ejecta suppress the redshifted emission (Chugai, 2001) so that attenuation in the red wing is little indication of newly formed dust. Smith et al. (2009c) spectroscopically confirm new dust formation in SN 2005ip as early as day 60 post-discovery, similar to the “Type IIn-like” SN 2006jc, in which new dust was confirmed as early as 51 days after the peak brightness (Smith et al., 2008b). Trundle et al. (2009) also provide spectroscopic evidence of dust formation for SN 2007rt.
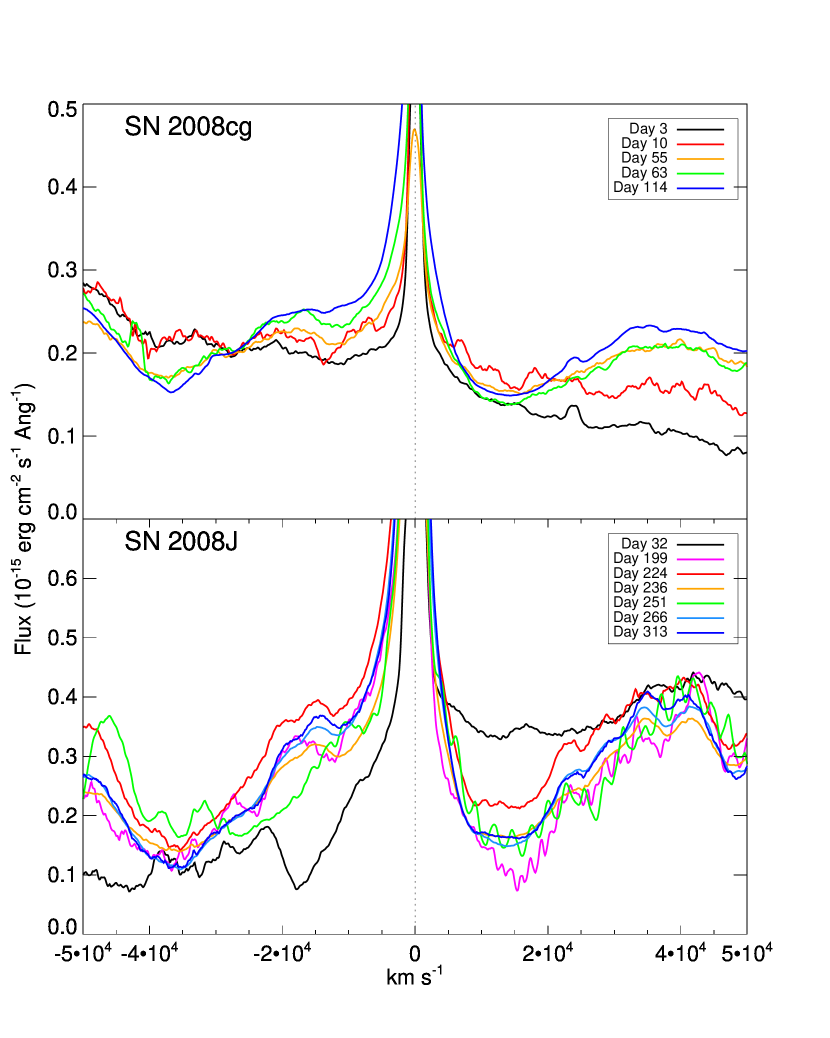
Of the remaining SNe in this sample, late-time spectra exist only for SNe 2006jd, 2008cg, and 2008J (see Table 4). Figures 7, 8, and 9 plot the H line from these optical spectra with the underlying continuum subtracted, and the velocity scale chosen with the narrow H emission feature at km s-1. In some cases, the negative (blueshifted) velocity axis is mirrored (dotted line) on the positive (redshifted) side to provide a qualitative comparison between the redshifted and blueshifted components. Figure 7 shows no evidence of absorption in SN 2006jd (in fact, it exhibits an excess likely due to the [N II] 6583 line).
Alternatively, Figures 8 and 9 show the broad ( km s-1) and intermediate ( km s-1) components of the H line of SNe 2008cg and 2008J at late times. Both SNe show some degree of increasing absorption in the red wing relative to the blue wing from days 63 and 224, respectively. Simultaneous absorption in both the broad and intermediate components may be evidence for newly formed dust in the ejecta, but other origins exist. For example, since electron scattering may be responsible for line broadening (Chugai, 2001), it is plausible that this scattering could lead to an asymmetric line profile. Alternatively, the scattering opacity of dust may produce asymmetric line profiles even when the dust is entirely outside the shock. Even if the dust were newly formed, however, the masses listed in Table 6 ( M⊙) are less than in SN 2005ip and much lower than the –1 M⊙ predicted by the SN dust models (e.g., Nozawa et al., 2003, 2008). Furthermore, the relative contribution of this newly formed dust to the overall mid-IR flux is not immediately clear. Along with the fact that the remaining SNe in this sample do not have late-time spectra, we must therefore consider the pre-existing dust models for all of these SNe.
3.2. Shock Heating
In the shock heating scenario, hot electrons in the post-shocked gas collisionally heat pre-existing dust grains (Draine & Salpeter, 1979; Draine, 1981; Dwek, 1987; Dwek et al., 2008). Fox et al. (2010) derive the estimated mass of dust heated by the forward shock, which serves as a useful consistency check when compared to the observed dust mass. For the forward shock at time , the mass of the shocked gas is
| (6) |
for a hydrogen atomic mass , shock velocity , and grain size , provided that the sputtering time scale , where is the radiative cooling time scale. The dust mass is then given by assuming a Galactic dust-to-gas mass ratio, .
Table 8 compares the expected dust masses for the fastest shocks ( 15,000 km s-1) to the observed masses listed in Table 6. SNe 2008ip, 2008gm, 2005gn, and 2005cp have dust masses consistent with the models, but these cases all assume a forward shock traveling at a constant speed of 15,000 km s-1 throughout the entire expansion without experiencing any deceleration. This is not likely for the two events from 2005, but it may be possible for the more recent SNe 2008ip and 2008gm. The predicted dust masses for the remaining SNe, however, are more than an order of magnitude lower than observed. Furthermore, the dust-to-gas mass ratio in the stellar winds is likely lower than that of the ISM (Williams et al., 2006; Ivezić & Elitzur, 2010). A lower ratio would predict even less dust. These results likely rule out shock heating for most of these events.
| Graphites | Silicates | ||
|---|---|---|---|
| SN | Predicted | Observed | Observed |
| (M⊙) | (M⊙) | (M⊙) | |
| 2005cp | 4.9e-3 | 6.8e-3 | 1.6e-2 |
| 2005gn | 4.6e-3 | 1.9e-3 | 3.2e-3 |
| 2005ip | 1.9e-3 | 4.3e-2 | 9.3e-2 |
| 2006jd | 2.8e-3 | 3.0e-2 | 5.0e-2 |
| 2006qq | 2.3e-3 | 1.6e-2 | 2.8e-2 |
| 2007rt | 1.3e-3 | 2.2e-2 | 3.8e-2 |
| 2008J | 7.4e-4 | 8.7e-3 | 1.5e-2 |
| 2008cg | 4.7e-4 | 1.3e-2 | 3.0e-2 |
| 2008en | 3.1e-4 | 6.7e-3 | 1.1e-2 |
| 2008gm | 1.9e-4 | 6.5e-5 | 1.4e-4 |
| 2008ip | 4.0e-4 | 4.2e-4 | 7.3e-4’ |
3.3. Radiative Heating
Optical emission from the SN may radiatively heat a shell of pre-existing dust at a radius to a temperature . Fox et al. (2010) outline three basic scenarios. For the first two scenarios, the peak SN luminosity heats the dust and forms an IR echo (e.g., Wright, 1980). In the first scenario, the dust may be distributed spherically symmetrically around the star at the time of the explosion (most likely formed by a steady wind from the progenitor). The SN peak luminosity then vaporizes the dust out to the vaporization radius , and heats the inside of the remaining dust shell to a temperature roughly equal to the vaporization temperature (). Alternatively, the dust may be distributed in a shell at a radius (most likely formed by a progenitor eruption hundreds to thousands of years prior to the SN). The SN peak luminosity heats the inside of this shell to a temperature , where the relationship between the two temperatures is generally given as
| (7) |
where is the observed SN optical luminosity and is the luminosity required to vaporize the dust at the given radius. In many cases (e.g., Fox et al., 2009), the resulting IR luminosity echo plateaus on year-long time scales, corresponding to the light travel time across the inner edge of the dust shell, where the shell radius is given by Equation 5.
In the final scenario, the dust may be distributed in a shell at radii between the vaporization and echo radii, (formed by either a steady wind or progenitor eruption). The late-time optical luminosity generated by circumstellar interaction, , continuously heats the dust shell. This scenario is not so much a traditional IR echo as it is a reprocessing of the optical emission by the dust.555Some authors refer to this as a circumstellar interaction echo (Gerardy et al., 2002), but the reader should note that the heating mechanism is radiation from the shocks, rather than direct collisional heating by the shocks themselves. If the circumstellar interaction occurs on a time scale greater than the light travel time across the dust shell (which we assume it does in these cases), the shell radius does not set the IR echo plateau length. The observed flux therefore accounts for the entire shell.
For a simple light-echo model dominated by flux from only the innermost, warmest dust at a single temperature, , balancing the energy absorbed and emitted by the dust grains gives the relationship between the SN optical luminosity and the dust temperature and inner shell radius as (Fox et al., 2010)
| (8) |
for a dust bulk (volume) density and an effective SN blackbody temperature . When using this equation, we generally assume µm grains and a SN temperature 10,000 K, although the results are fairly insensitive to the choice of temperature. The luminosity is treated as a central point source, assuming the emitting region is internal to a spherically symmetric dust shell.
Using Equation 8, Figure 10 plots contours of the expected dust temperature as a function of shell radius for various optical luminosities. We choose luminosities L⊙, which span the observed peak and late-time optical luminosities for these SNe. Overplotted are the observed dust temperatures and radii derived from the data (see Tables 6 and 7). Only dust with graphite composition is considered, as silicate grains require much higher luminosities than observed ( L⊙) to heat dust grains of comparable sizes to the observed temperatures.


Considering the first scenario above, the SN peak luminosity vaporizes all dust out to the vaporization radius, , which is defined by the radius at which the dust temperature equals the dust vaporization temperature (for graphite, 2000 K). None of the observed dust temperatures in Table 6 even approach the vaporization temperature of graphite. Furthermore, we can rule out this scenario by comparing the expected vaporization radii to the observed duration of the IR echos. Table 7 shows that the vaporization radii are all ly, which is too small to produce an IR echo over the observed year-long time scales. Of course, the unobserved shock breakout in the minutes to hours following the supernova can approach peak values L⊙ (Soderberg et al., 2008; Nakar & Sari, 2010). Figure 8b in Fox et al. (2010) shows that such values can vaporize 0.1 µm dust grains out to ly. Still, these radii are too small to produce an IR echo over the observed year-long time scales.
Figure 10(a) tests the second scenario by comparing the expected and observed temperatures assuming the dust lies at the echo radii defined by the IR echo plateau duration . At these radii, the SNe require large peak luminosities ( L⊙) to power the observed echo. Not only are the required peak luminosities significantly greater than the measured ones, but they are larger than those of the most luminous core-collapse events ever found (Quimby et al., 2007). The unobserved shock breakout luminosities are indeed higher, but the breakout typically lasts only for about 30 minutes, even in the case of an extended red supergiant progenitor. While the shock breakout luminosity may be large enough to heat the dust to the observed temperature, the total radiated energy from the breakout (L⊙ 30 min erg) is not nearly enough to power the observed echo (L⊙ 1000 d erg), assuming an IR luminosity L⊙ extending throughout the 1000 day period (see Figure 6). Even if we take an echo lasting for only 100 days, the total radiated IR energy is still too large to have been powered by the shock breakout. This fact makes unlikely any IR echo powered by the peak SN luminosity from shock breakout.
Figure 10(b) tests the final scenario, in which the optical luminosity generated by continuous interaction between the forward shock and CSM offers an alternative heating mechanism. In this case, the dust is assumed to lie at the smallest radius allowed by the observations, defined by the blackbody radius, .
The observed dust temperatures for most of the SNe require optical luminosities L⊙. While such late-time optical luminosities are larger than observed in most SN subclasses, they are quite realistic for Type IIn events. For example, late-time observations show (SN 2005ip) = L⊙ on days 900 (Smith et al., 2009c), (SN 2006jd) = L⊙ on day 1609 (Table 5), and (SN 2007rt) L⊙ on day 562 (Trundle et al., 2009)666We reconcile the fact that our most recent optical observations do not detect SN 2007rt by noting that they were made nearly 500 days following the original observations..
The dust temperatures for some of the SNe, particularly SNe 2007rt and 2006jd, do fall above the expected values for a luminosity L⊙. However, in these cases a second, hotter dust component may be contributing to the mid-IR flux. Already, we know from the fits in Figure 5 that SN 2006jd has a hotter dust component. Also, Trundle et al. (2009) show that new dust forms in SN 2007rt, although they do not measure the temperature. Similarly, Figures 8 and 9 exhibit evidence for new dust formation in SNe 2008cg and 2008J. As in SN 2005ip (Fox et al., 2010), this newly formed dust may be hotter than the mid-IR dust component. In these cases, the observed temperatures would be only upper limits. The resulting lower dust temperatures and corresponding lower blackbody radii would place these points significantly closer to their luminosity contour lines.
Late-time optical observations are not available for SNe 2005cp, 2005gn, 2006qq, 2008J, 2008cg, 2008en, 2008gm, and 2008ip, but almost all of these points fall close to or along luminosity contours comparable to observed late-time optical luminosities of SNe 2005ip, 2006jd, and 2007rt. In general, the data are fairly consistent with heating by optical emission generated by continuous circumstellar interaction. Gerardy et al. (2002) reached a similar conclusion in their study of late-time emission from five SNe. Two of the Gerardy et al. targets, SNe 1999Z and 1997ab, are actually on our initial target list. The fact that we failed to detect any late-time mid-IR emission comes as little surprise given that the forward shock would eventually destroy the pre-existing dust shells, a trend we observe in Figure 6 and discuss more below in §4.
A simple calculation shows that the pre-existing dust shells in this model are optically thin at IR wavelengths, consistent with assumptions for deriving the dust mass in Equation 1. For a dust shell given by a blackbody radius , the optical depth can be written as
| (9) |
where cm2 g-1 is the absorption coefficient for graphite averaged over 1–15 µm (see Figure 4 of Fox et al. 2010). For each SN except SN 2005ip, . Using the additional spectroscopic data for SN 2005ip provided by Fox et al. (2010), however, we derive an optical depth . Furthermore, since the blackbody radii are only lower limits, these optical depths are all upper limits.
4. Trends, Progenitors, and Overall Model
For the above scenario, in which UV and optical emission from circumstellar interaction radiatively heats pre-existing dust, the observed dust mass accounts for the entire dust shell since the shell-radius light travel time () is significantly smaller than the circumstellar interaction time scale given by the epoch of observation (see Table 7). Assuming a dust-to-gas mass ratio expected in the H-rich envelope of a massive star, , the pre-existing dust mass corresponds to a progenitor mass-loss rate
| (10) | |||||
| (11) |
for a wind speed . The SNe in §2.2 have narrow line profiles with FWHM in the range –500 km s-1. Since these narrow lines originate in the slow, dense, pre-existing circumstellar environment, they are typically assumed to directly correspond to the progenitor wind speed. Assuming a thin shell, , Table 9 lists the associated mass-loss rate for each SN.
| SN | aaThe expected optical luminosity generated by the forward shock, given by Equation 12. | ||
|---|---|---|---|
| (M⊙ yr-1) | (yr) | log (L / L⊙) | |
| 2005cp | 2.2e-3 | 30 | 7.45 |
| 2005gn | 7.5e-4 | 25 | 7.10 |
| 2005ip | 1.8e-3 | 235 | 7.88 |
| 2006jd | 2.8e-3 | 106 | 7.68 |
| 2006qq | 9.2e-3 | 17 | 7.72 |
| 2007rt | 1.2e-3 | 181 | 7.79 |
| 2008J | 1.6e-3 | 55 | 7.43 |
| 2008cg | 2.3e-3 | 57 | 7.59 |
| 2008en | 1.4e-3 | 49 | 7.38 |
| 2008gm | 1.6e-4 | 4 | 6.43 |
| 2008ip | 3.3e-4 | 13 | 6.75 |
The properties in Table 9 are generally consistent with LBVs during their giant eruptions, which have wind speeds on the order of hundreds of km s-1 and mass-loss rates M⊙ yr-1 (Humphreys & Davidson, 1994), but can reach much higher (Smith & Owocki, 2006; Smith et al., 2007). In fact, the total dust-shell masses are in the range M⊙ (see Table 6), which, assuming a dust-to-gas mass ratio , are also consistent with the range of LBV shell masses observed by Smith & Owocki (2006). A LBV has already been directly identified as the likely progenitor of SN 2005gl (Gal-Yam & Leonard, 2009), and, indirectly, LBVs have emerged as the likely progenitors of many other SNe IIn (e.g., Chugai & Danziger, 1994; Salamanca et al., 2002; Gal-Yam et al., 2007; Smith et al., 2007, 2008a, 2009a; Kiewe et al., 2010).
Table 7 highlights the fact that in almost every case (SNe 2008gm and 2008ip aside), the blackbody radius is larger than the vaporization radius by nearly a factor of two (). If the dust were associated with a steady wind, the resulting shell size would have been more comparable to the vaporization radius. Instead, these results suggest that the progenitor may have undergone a period of increased mass-loss prior to the SN at a time , which corresponds to tens to hundreds of years (see Table 9). Such an eruptive event is inferred in many other Type IIn events (e.g., Chugai & Danziger, 1994; Salamanca et al., 2002; Gal-Yam et al., 2007; Smith et al., 2007, 2008a, 2009a; Kiewe et al., 2010).
Alternatively, Figure 8b in Fox et al. (2010) shows that an unobserved shock breakout peak luminosity of only L⊙ (Soderberg et al., 2008; Nakar & Sari, 2010) can vaporize 0.1 µm dust grains out to ly, which is much more within the range of the observed blackbody radii. In this case, there is little evidence for an eruptive event. Instead, the progenitor more likely underwent a period of extreme, but steady, mass-loss prior to the SN, thereby enshrouding the progenitor in a massive gas and dust shell.
To test each possibility, we can compare the observed late-time optical luminosities to the expected values for various CSM densities. We use the expression (e.g., Chugai, 1992) to write the expected shock luminosity as a function of progenitor wind density, ,
| (12) |
where is the preshock wind speed and is the efficiency of converting shock kinetic energy into visual light. While the conversion efficiency varies greatly depending on shock speed and wind density, we assume a value , acknowledging this value may be high. The preshock wind speeds are given by the narrow line widths reported in §2.2 (and km s-1 for unreported lines).
Table 9 lists the expected optical luminosity produced by a km s-1 forward shock moving through the CSM assuming a mass-loss rate equal to the value derived above for each dust shell. Except for SNe 2008ip and 2008gm, the predicted values are nearly equal to the observed late-time optical luminosities reported above for SNe 2005ip, 2006jd, and 2007rt. This consistency suggests the wind density throughout the CSM is roughly equal to the value calculated for the dust shell, thereby favoring the extreme and steady wind scenario above.
The story starts to get interesting when we revisit Figure 6. Overall, a significant percentage of the SNe IIn from the past 10 years (15%) show late-time mid-IR emission (and the percentage is over 50% when only considering SNe with explosion dates within 5 years of the observations.) After about 1000–2000 days (3–5 years) post-discovery, the luminosity begins to steadily decline. This decline may occur because the forward shock ultimately overruns and destroys the dust shell. Alternatively, the radiative efficiency of the shock will drop when the cooling time becomes longer than the expansion time. In either case, the apparent consistency amongst the detected SNe suggests that in these instances, many of the progenitors may have experienced similar mass-loss histories, although additional epochs of data will be necessary to confirm this possibility. If indeed the progenitors are LBVs, which are associated with initial stellar masses M⊙ (Smith et al., 2004), this result could have significant implications on mass-loss properties of the high mass, low-metallicity stars observed in the early universe (e.g., Smith & Owocki, 2006). These conclusions are also particularly noteworthy for stellar evolution theorists, whose models do not place LBVs in the final pre-SN phase (Schaller et al., 1992; Langer, 1993; Langer et al., 1994; Stothers & Chin, 1996; Maeder et al., 2005; Maeder & Meynet, 2008).
Of course, LBVs are not necessarily the progenitors of all SNe IIn, and several caveats should be mentioned. Primarily, there is a significant diversity among the targets in this sample. Not only can some of the SNe with late-time emission be explained with other models (e.g., shock heating), but a large percentage of the sample does not exhibit any late-time X-ray, optical, IR, or radio emission (van Dyk et al., 1996). Of well-studied SNe IIn, many show varying degrees of circumstellar interaction (Li et al., 2002; Trundle et al., 2009). In the extreme case of SN 1986J, for example, late-time optical emission is observed more than two decades post-detection (Milisavljevic et al., 2008). (The faded H line relative to the strong [O I] line, however, suggests that the bulk of the emission is generated by the reverse shock, not the forward shock.) Not only do the observations vary, but several other SNe IIn have shown evidence for red supergiant (RSG) progenitors (Fransson et al., 2002; Smith et al., 2009b). Furthermore, other authors invoke several additional scenarios to explain the dense circumstellar shells, including wind-blown bubbles, high-density clumps, very short Wolf-Rayet stages following the LBV outbursts (Dwarkadas, 2011), mass ejection caused by frictional heating of a common envelope in a binary system (Tutukov et al., 1992), and even relic disks of proto-stellar material left over from the star formation (Metzger, 2010).
5. Conclusion
The survey in this paper targets 68 SNe IIn discovered in 1999–2008 without late-time mid-IR observations, as well as the well-studied Type IIn SN 1997ab. Ten of the 69 SNe (%) display late-time mid-IR emission from warm dust. The late-time optical and infrared observations presented here constrain the various origins and heating mechanisms of the warm dust, which are summarized by Table 10. Although some SNe show evidence of newly formed dust or shock heating of pre-existing dust, observations for almost every SN are consistent with the scenario in which pre-existing dust is radiatively heated by optical emission from late-time circumstellar interaction between the forward shock and dense CSM (see the third scenario of §3.3). A similar conclusion was reached by Gerardy et al. (2002) regarding several other Type IIn events that have since faded.
Although the model has not yet been confirmed, a trend amongst the Type IIn subclass begins to emerge. The late-time IR emission associated with this subclass appears to originate from pre-existing dust expelled by the progenitor star, which ultimately forms a shell when the interior dust is vaporized by the SN shock breakout. With some basic assumptions, the dust-shell properties indicate that the progenitor winds and mass-loss rates are most consistent with the properties of LBVs. In almost every case, the data point to extreme, but steady, mass-loss histories as the progenitors evolve along toward their stellar death. These results therefore contribute to the growing evidence that SNe are not likely major sources of dust, although their progenitors might be if the forward shock does not ultimately destroy the dust.
| SN | Newly | Shock | IR | Shock |
|---|---|---|---|---|
| Formed? | Heating? | Echo? | Echo? | |
| 2005cp | no | maybe | no | yes |
| 2005gn | no | maybe | no | maybe |
| 2005ip | yes | no | no | yes |
| 2006jd | no | no | no | maybe |
| 2006qq | no | no | no | yes |
| 2007rt | yesaaTrundle et al. (2009). | no | no | maybe |
| 2008J | maybe | maybe | no | maybe |
| 2008cg | yes | no | no | yes |
| 2008en | no | maybe | no | yes |
| 2008gm | no | yes | no | yes |
| 2008ip | no | yes | no | yes |
Still, several caveats exist that offer alternative explanations for the dense dust shells without invoking LBV progenitors. The advantage to the model in this paper is that it allows us make predictions. If the dust is distributed in a shell, and the heating mechanism is indeed continuous radiation generated by the forward shock, we expect the shock to eventually overtake the shell radius and destroy the dust. As the dust is destroyed, the late-time mid-IR emission should begin to significantly decrease. While we see this general trend in Figure 6, no single SN IIn has multi-epoch mid-IR data that reveal the SN “turning off.”
We can calculate the approximate point in time when this will happen as , where is the forward-shock velocity. For the observed blackbody radii, ly, and a shock velocity km s-1, we would expect the shock to overtake the shell at a time yr. Once the shock destroys the dust, the luminosity decline will occur on time scales consistent with the dust-shell radius ( yr), as the dust destruction on the near side of the shell will be observed before dust destruction on the far side. This time scale is consistent with the apparent decline (determined from the upper limits) in Figure 6. Of course, the blackbody radius assumes an optically thick shell and only sets a lower limit. The actual dust radii are likely much larger. In addition, slower shock speeds or asymmetric shell geometries would result in varying time scales, but mid-IR monitoring of these SNe will help to constrain the various models and geometries.
This work is based on observations made with the Spitzer Space Telescope (PID 60122), which is operated by the Jet Propulsion Laboratory, California Institute of Technology, under a contract with NASA. Support for this work was provided by NASA through an award issued by JPL/Caltech. O.D.F. is grateful for support from the NASA Postdoctoral Program (NPP). R.A.C. was supported by NSF grant AST–0807727. A.V.F. is grateful for the support of NSF grant AST–0908886 and the TABASGO Foundation. J.M.S. thanks Marc J. Staley for a graduate fellowship. Some of the data presented herein were obtained at the W. M. Keck Observatory, which is operated as a scientific partnership among the California Institute of Technology, the University of California, and NASA; the observatory was made possible by the generous financial support of the W. M. Keck Foundation. The Kast spectrograph on the Lick 3-m Shane telescope was funded by a gift from Bill and Marina Kast. We thank the staffs of the Lick and Keck Observatories for their assistance with the observations. We are also grateful to many students and postdocs who helped take and reduce the optical spectra.
References
- Andrews et al. (2010) Andrews, J. E., et al. 2010, ApJ, 715, 541
- Andrews et al. (2011) —. 2011, arXiv:1102.2431
- Blanc et al. (2005) Blanc, N., et al. 2005, ATEL, 635, 1
- Blondin & Berlind (2007) Blondin, S., & Berlind, P. 2007, IAU Circ., 1156, 1
- Blondin & Hernandez (2008) Blondin, S., & Hernandez, J. 2008, IAU Circ., 1295, 1
- Bode & Evans (1980) Bode, M. F., & Evans, A. 1980, MNRAS, 193, 21
- Boles (2008) Boles, T. 2008, IAU Circ., 1459, 1
- Carlo et al. (2002) Carlo, E. D., et al. 2002, ApJ, 573, 144
- Challis & Calkins (2009) Challis, P., & Calkins, M. 2009, CBET, 1649, 1
- Chandra & Soderberg (2007) Chandra, P., & Soderberg, A. 2007, ATEL, 1297, 1
- Chandra & Soderberg (2008a) —. 2008a, ATEL, 1594, 1
- Chandra & Soderberg (2008b) —. 2008b, ATEL, 1359, 1
- Chandra & Soderberg (2009) —. 2009, ATEL, 1891, 1
- Chevalier & Fransson (1994) Chevalier, R. A., & Fransson, C. 1994, ApJ, 420, 268
- Chugai (1992) Chugai, N. N. 1992, Soviet Astronomy, 36, 63
- Chugai (1993) —. 1993, ApJ, 414, L101
- Chugai (2001) —. 2001, MNRAS, 326, 1448
- Chugai & Danziger (1994) Chugai, N. N., & Danziger, I. J. 1994, MNRAS, 268, 173
- Cushing et al. (2004) Cushing, M. C., Vacca, W. D., & Rayner, J. T. 2004, PASP, 116, 362
- Dahlén & Fransson (1999) Dahlén, T., & Fransson, C. 1999, A&A, 350, 349
- Draine (1981) Draine, B. T. 1981, ApJ, 245, 880
- Draine & Salpeter (1979) Draine, B. T., & Salpeter, E. E. 1979, ApJ, 231, 77
- Draine & Woods (1991) Draine, B. T., & Woods, D. T. 1991, ApJ, 383, 621
- Drake et al. (2008) Drake, A. J., Djorgovski, S. G., Mahabal, A., Graham, M. J., Williams, R., Beshore, E. C., Larson, S. M., & Christensen, E. 2008, IAU Circ., 1366, 1
- Dwarkadas (2011) Dwarkadas, V. V. 2011, MNRAS, 23
- Dwek (1983) Dwek, E. 1983, ApJ, 274, 175
- Dwek (1985) Dwek, E. 1985, ApJ, 297, 719
- Dwek (1987) —. 1987, ApJ, 322, 812
- Dwek et al. (2008) Dwek, E., et al. 2008, ApJ, 676, 1029
- Elias et al. (1986) Elias, J. H., Matthews, K., Neugebauer, G., & Soifer, B. T. 1986, BAAS, 18, 1016
- Elmhamdi et al. (2004) Elmhamdi, A., Danziger, I. J., Cappellaro, E., Valle, M. D., Gouiffes, C., Phillips, M. M., & Turatto, M. 2004, A&A, 426, 963
- Elmhamdi et al. (2003) Elmhamdi, A., et al. 2003, MNRAS, 338, 939
- Emmering & Chevalier (1988) Emmering, R. T., & Chevalier, R. A. 1988, AJ, 95, 152
- Fazio et al. (2004) Fazio, G. G., et al. 2004, ApJS, 154, 10
- Fesen (1998) Fesen, R. A. 1998, AJ, 115, 1107
- Filippenko (1982) Filippenko, A. V. 1982, PASP, 94, 715
- Filippenko (1997) —. 1997, ARA&A, 35, 309
- Foley et al. (2003) Foley, R. J., et al. 2003, PASP, 115, 1220
- Fox et al. (2009) Fox, O., et al. 2009, ApJ, 691, 650
- Fox et al. (2010) Fox, O. D., Chevalier, R. A., Dwek, E., Skrutskie, M. F., Sugerman, B. E. K., & Leisenring, J. M. 2010, ApJ, 725, 1768
- Fransson et al. (2002) Fransson, C., et al. 2002, ApJ, 572, 350
- Gal-Yam & Leonard (2009) Gal-Yam, A., & Leonard, D. C. 2009, Nature, 458, 865
- Gal-Yam et al. (2007) Gal-Yam, A., et al. 2007, ApJ, 656, 372
- Garnavich et al. (1996) Garnavich, P., Noriega-Crespo, A., & Moro-Martin, A. 1996, IAU Circ., 6314, 1
- Gerardy et al. (2002) Gerardy, C. L., et al. 2002, ApJ, 575, 1007
- Graham & Meikle (1986) Graham, J. R., & Meikle, W. P. S. 1986, MNRAS, 221, 789
- Graham et al. (1983) Graham, J. R., et al. 1983, Nature, 304, 709
- Herter et al. (2008) Herter, T. L., et al. 2008, Proc. of SPIE, 7014, 30
- Hildebrand (1983) Hildebrand, R. H. 1983, QJRAS, 24, 267
- Horne (1986) Horne, K. 1986, PASP, 98, 609
- Humphreys & Davidson (1994) Humphreys, R. M., & Davidson, K. 1994, PASP, 106, 1025
- Immler et al. (2007) Immler, S., Brown, P. J., Filippenko, A. V., & Pooley, D. 2007, ATEL, 1290, 1
- Immler et al. (2008) Immler, S., Filippenko, A. V., & Pooley, D. 2008, ATEL, 1598, 1
- Immler & Pooley (2007) Immler, S., & Pooley, D. 2007, ATEL, 1004, 1
- Itagaki et al. (2006) Itagaki, K., et al. 2006, IAU Circ., 8762, 1
- Ivezić & Elitzur (2010) Ivezić, Ž., & Elitzur, M. 2010, MNRAS, 404, 1415
- Kiewe et al. (2010) Kiewe, M., et al. 2010, arXiv:1010.2689
- Kotak et al. (2005) Kotak, R., Meikle, P., van Dyk, S. D., Höflich, P. A., & Mattila, S. 2005, ApJ, 628, L123
- Kotak et al. (2004) Kotak, R., Meikle, W. P. S., Adamson, A., & Leggett, S. K. 2004, MNRAS, 354, L13
- Kotak et al. (2006) Kotak, R., et al. 2006, ApJ, 651, L117
- Kotak et al. (2009) —. 2009, ApJ, 704, 306
- Kozasa et al. (2009) Kozasa, T., Nozawa, T., Tominaga, N., Umeda, H., Maeda, K., & Nomoto, K. 2009, arXiv:0903.0217
- Langer (1993) Langer, N. 1993, Space Sci Rev, 66, 365
- Langer et al. (1994) Langer, N., Hamann, W.-R., Lennon, M., Najarro, F., Pauldrach, A. W. A., & Puls, J. 1994, A&A, 290, 819
- Lee et al. (2005) Lee, E., Ponticello, N. J., & Li, W. 2005, IAU Circ., 8550, 1
- Leibundgut et al. (1991) Leibundgut, B., Kirshner, R. P., Pinto, P. A., Rupen, M. P., Smith, R. C., Gunn, J. E., & Schneider, D. P. 1991, ApJ, 372, 531
- Lewis et al. (1994) Lewis, J. R., et al. 1994, MNRAS, 266, L27
- Li (2007) Li, W. 2007, IAU Circ., 1148, 1
- Li et al. (2002) Li, W., Filippenko, A. V., Dyk, S. D. V., Hu, J., Qiu, Y., Modjaz, M., & Leonard, D. C. 2002, PASP, 114, 403
- Li et al. (2011) Li, W., et al. 2011, MNRAS, 412, 1441
- Luckas et al. (2005) Luckas, P., Trondal, O., Schwartz, M., Prasad, R. R., Shimasaki, K., Lee, E., & Li, W. 2005, IAU Circ., 8616, 2
- Maeder & Meynet (2008) Maeder, A., & Meynet, G. 2008, in Mass Loss from Stars and the Evolution of Stellar Clusters, ed. A. de Koter, L. J. Smith, & L. B. F. M. Waters, Vol. 388, 3
- Maeder et al. (2005) Maeder, A., Meynet, G., & Hirschi, R. 2005, in Cosmic Abundances as Records of Stellar Evolution and Nucleosynthesis, ed. T. G. B. III & F. N. Bash, Vol. 336, 79
- Maguire et al. (2010) Maguire, K., et al. 2010, MNRAS, 284
- Markwardt (2009) Markwardt, C. B. 2009, Astronomical Data Analysis Software and Systems XVIII ASP Conference Series, 411, 251
- Marsden (2005) Marsden, B. G. 2005, IAU Circ., 260, 5
- Martini et al. (2004) Martini, P., Persson, S. E., Murphy, D. C., Birk, C., Shectman, S. A., Gunnels, S. M., & Koch, E. 2004, Proc. of SPIE, 5492, 1653
- Matheson et al. (2000) Matheson, T., Filippenko, A. V., Ho, L. C., Barth, A. J., & Leonard, D. C. 2000, AJ, 120, 1499
- Matsuura et al. (2011) Matsuura, M., et al. 2011, eprint arXiv, 1107, 1477
- Mattila et al. (2008) Mattila, S., et al. 2008, MNRAS, 389, 141
- Meikle et al. (2011) Meikle, P., et al. 2011, arXiv:1103.2885
- Meikle et al. (2005) Meikle, W. P., et al. 2005, Spitzer Proposal, 20256
- Meikle et al. (2006) Meikle, W. P. S., et al. 2006, ApJ, 649, 332
- Meikle et al. (2007) —. 2007, ApJ, 665, 608
- Merrill (1980) Merrill, K. M. 1980, IAU Circ., 3444, 3
- Metzger (2010) Metzger, B. D. 2010, MNRAS, 409, 284
- Milisavljevic et al. (2008) Milisavljevic, D., Fesen, R. A., Leibundgut, B., & Kirshner, R. P. 2008, ApJ, 684, 1170
- Miller et al. (2010a) Miller, A. A., Smith, N., Li, W., Bloom, J. S., Chornock, R., Filippenko, A. V., & Prochaska, J. X. 2010a, AJ, 139, 2218
- Miller et al. (2010b) Miller, A. A., et al. 2010b, MNRAS, 404, 305
- Miller & Stone (1993) Miller, J. S., & Stone, R. P. S. 1993, Lick Obs. Tech. Rep. 66 (Santa Cruz: Lick Obs.)
- Modjaz et al. (2005) Modjaz, M., Kirshner, R., Challis, P., & Calkins, M. 2005, IAU Circ., 8628, 2
- Nakano et al. (2009) Nakano, S., Kobayashi, T., Kadota, K., Itagaki, K., Denisenko, D., Korotkiy, S., & Kryachko, T. 2009, CBET, 1641, 1
- Nakar & Sari (2010) Nakar, E., & Sari, R. 2010, ApJ, 725, 904
- Nozawa et al. (2003) Nozawa, T., Kozasa, T., Umeda, H., Maeda, K., & Nomoto, K. 2003, ApJ, 598, 785
- Nozawa et al. (2008) Nozawa, T., et al. 2008, ApJ, 684, 1343
- Oke et al. (1995) Oke, J. B., et al. 1995, PASP, 107, 375
- Pastorello et al. (2002) Pastorello, A., et al. 2002, MNRAS, 333, 27
- Pignata et al. (2008) Pignata, G., et al. 2008, IAU Circ., 1549, 1
- Pozzo et al. (2004) Pozzo, M., Meikle, W. P. S., Fassia, A., Geballe, T., Lundqvist, P., Chugai, N. N., & Sollerman, J. 2004, MNRAS, 352, 457
- Prasad & Li (2005) Prasad, R. R., & Li, W. 2005, CBET, 252, 1
- Prasad & Li (2006) —. 2006, IAU Circ., 673, 1
- Prasad et al. (2006) Prasad, R. R., Li, W., & Folatelli, G. 2006, IAU Circ., 766, 1
- Prieto et al. (2008) Prieto, J. L., et al. 2008, ApJL, 681
- Quimby et al. (2007) Quimby, R. M., Aldering, G., Wheeler, J. C., Höflich, P., Akerlof, C. W., & Rykoff, E. S. 2007, ApJ, 668, L99
- Rest et al. (2011) Rest, A., et al. 2011, ApJ, 729, 88
- Salamanca et al. (2002) Salamanca, I., Terlevich, R. J., & Tenorio-Tagle, G. 2002, MNRAS, 330, 844
- Schaller et al. (1992) Schaller, G., Schaerer, D., Meynet, G., & Maeder, A. 1992, A&AS, 96, 269
- Schlegel (1990) Schlegel, E. M. 1990, MNRAS, 244, 269
- Silverman et al. (2006) Silverman, J. M., Wong, D., Filippenko, A. V., & Chornock, R. 2006, IAU Circ., 766, 2
- Smartt (2009) Smartt, S. J. 2009, ARA&A, 47, 63
- Smith et al. (2008a) Smith, N., Chornock, R., Li, W., Ganeshalingam, M., Silverman, J. M., Foley, R. J., Filippenko, A. V., & Barth, A. J. 2008a, ApJ, 686, 467
- Smith et al. (2009a) Smith, N., Chornock, R., Silverman, J. M., Filippenko, A. V., & Foley, R. J. 2009a, ApJ, 709, 856
- Smith et al. (2008b) Smith, N., Foley, R. J., & Filippenko, A. V. 2008b, ApJ, 680, 568
- Smith et al. (2009b) Smith, N., Hinkle, K. H., & Ryde, N. 2009b, AJ, 137, 3558
- Smith et al. (2011) Smith, N., Li, W., Filippenko, A. V., & Chornock, R. 2011, MNRAS, 314
- Smith & Owocki (2006) Smith, N., & Owocki, S. P. 2006, ApJ, 645, L45
- Smith et al. (2010) Smith, N., Silverman, J. M., Ganeshalingam, M., & Filippenko, A. V. 2010, arXiv:1010.3718v2
- Smith et al. (2004) Smith, N., Vink, J. S., & de Koter, A. 2004, ApJ, 615, 475
- Smith et al. (2007) Smith, N., et al. 2007, ApJ, 666, 1116
- Smith et al. (2008c) —. 2008c, ApJ, 686, 485
- Smith et al. (2009c) —. 2009c, ApJ, 695, 1334
- Soderberg (2008) Soderberg, A. 2008, ATEL, 1811, 1
- Soderberg et al. (2008) Soderberg, A. M., et al. 2008, Nature, 453, 469
- Steele et al. (2008) Steele, T. N., Ganeshalingam, M., Chornock, R., & Filippenko, A. V. 2008, IAU Circ., 1465, 4
- Stothers & Chin (1996) Stothers, R. B., & Chin, C.-W. 1996, ApJ, 468, 842
- Stritzinger et al. (2008) Stritzinger, M., Folatelli, G., & Morrel, N. 2008, IAU Circ., 1218, 2
- Sugerman et al. (2004) Sugerman, B., Meixner, M., Fabbri, J., & Barlow, M. 2004, IAU Circ., 8442, 2
- Sugerman et al. (2006) Sugerman, B. E. K., et al. 2006, Science, 313, 196
- Szalai et al. (2011) Szalai, T., Vinkó, J., Balog, Z., Gáspár, A., Block, M., & Kiss, L. L. 2011, A&A, 527, 61
- Telesco et al. (1981) Telesco, C., Becklin, E., Koehler, R., & Gatley, I. 1981, IAU Circ., 3613, 2
- Thompson et al. (2009) Thompson, T. A., Prieto, J. L., Stanek, K. Z., Kistler, M. D., Beacom, J. F., & Kochanek, C. S. 2009, ApJ, 705, 1364
- Thrasher et al. (2008) Thrasher, P., Li, W., & Filippenko, A. V. 2008, IAU Circ., 1211, 1
- Trundle et al. (2009) Trundle, C., et al. 2009, A&A, 504, 945
- Tsvetkov (2008) Tsvetkov, D. Y. 2008, Peremennye Zvezdy, 28, 6
- Tutukov et al. (1992) Tutukov, A. V., Yungelson, L. R., & Iben, I. 1992, ApJ, 386, 197
- van Dyk et al. (1996) van Dyk, S. D., Weiler, K. W., Sramek, R. A., Schlegel, E. M., Filippenko, A. V., Panagia, N., & Leibundgut, B. 1996, AJ, 111, 1271
- Wade & Horne (1988) Wade, R. A., & Horne, K. 1988, ApJ, 324, 411
- Weiler et al. (1990) Weiler, K. W., Panagia, N., & Sramek, R. A. 1990, ApJ, 364, 611
- Williams et al. (2006) Williams, B. J., et al. 2006, ApJ, 652, L33
- Wilson et al. (2004) Wilson, J. C., et al. 2004, Proc. of SPIE, 5492, 1295
- Wright (1980) Wright, E. L. 1980, ApJ, 242, L23