Analysis of the static properties of cluster formations in symmetric linear multiblock copolymers
Abstract
We use molecular dynamics simulations to study the static properties of a single linear multiblock copolymer chain under poor solvent conditions varying the block length , the number of blocks , and the solvent quality by variation of the temperature . We study the most symmetrical case, where the number of blocks of monomers of type A, , equals that of monomers B, (), the length of all blocks is the same irrespective of their type, and potential parameters are also chosen symmetrically, as for a standard Lennard-Jones fluid. Under poor solvent conditions the chains collapse and blocks with monomers of the same type form clusters, which are phase separated from the clusters with monomers of the other type. We study the dependence of the size of the formed clusters on , and . Furthermore, we discuss our results with respect to recent simulation data on the phase behaviour of such macromolecules, providing a complete picture for the cluster formations in single multiblock copolymer chains under poor solvent conditions.
pacs:
02.70Ns, 64.75.Jk, 82.35.Jk1 Introduction
Block copolymers have been recently the subject of many experimental and theoretical studies, as such systems are highly involved in industrial applications [1, 2, 3, 4, 5, 6, 7, 8, 9, 10, 11, 12, 13, 14, 15, 16, 17, 18, 19, 20, 21, 22, 23, 24, 25, 26, 27, 28, 29, 30, 31, 32, 33, 34, 35, 36, 37, 38, 39, 40, 41, 42, 43, 44, 45, 46, 47, 48, 49, 50, 51, 52, 53, 54, 55, 56]. Block copolymer melts is the most studied system with this respect [1, 2, 3, 4, 5, 6, 7, 8, 9, 10, 11, 12, 13, 14, 15, 16, 17, 18, 19, 20, 21, 22, 23, 24, 25, 26, 27, 28, 29, 30, 31, 32, 33, 34, 35, 36, 37, 38, 39, 40, 41, 42, 43, 44, 45, 46, 47, 48, 49]. We also note here that various copolymer systems have been studied in many other occasions concerning different geometries, i.e., in a selective nanoslit [57], on nanopatterned surfaces [58, 59, 60], in nanopores [61], in the case of nanoparticle aggregation [62], etc. Lots of theoretical, experimental, and simulation studies are dealing with these systems. In particular, theory predicts that melts of block copolymer chains for the most symmetrical case (equal block length and composition) form lamellar structure, given that the scaling parameter that controls the phase behaviour () is high enough to lead to phase separation between the A and B blocks [11, 12, 13]. Simulations have confirmed that this parameter controls the phase behaviour of such systems [4]. It has also been discussed that the geometry of the microphase separated regions is controlled by the number of blocks , as well as other parameters, i.e., relative size and arrangement of blocks [4]. Then, theoretical studies were extended covering the case of melts of multiblock copolymer chains (two types of monomers are composing each chain composed of more than two blocks). It was shown that this case has similar behaviour to a melt of diblock copolymer chains [36]. That is, a lamellar structure for the most symmetric case. Nevertheless, in the case of infinitely dilute solutions, it is sufficient to study isolated multiblock copolymer chains, where interactions (which can be of short range) only within the chain and the effect of the solvent are relevant [50, 51, 52, 53, 54, 55, 56]. The phase behaviour of such systems has been studied by means of computer simulations for chain lengths and temperature ranges accessible to simulations [50, 51]. Also, the dynamic properties of such macromolecules have been the subject of recent simulation studies [55]. Interestingly, such systems are also closely related to various toy models (i.e., the HP model [63]), which try to mimic the behaviour of various biomacromolecules, which are formed by periodically repeated structural units (“monomers”) along their chain, in order to understand complicated biological processes, i.e., protein folding [64], helical structures [65] etc.
Under Theta conditions () or temperatures close to the temperature, it is expected that a single linear symmetric multiblock copolymer chain would form a coil structure, where blocks of different type (A,B) hardly come across [50, 51, 52, 53, 54, 55, 56]. In fact, an expansion in the chain dimensions of the chain is taking place due to the repulsive interactions between neighboring blocks A and B along the chain. Also, the spherical symmetry of the macromolecule should give its place to an ellipsoidal overall formation [52, 53, 54, 55, 56]. The chain flexibility could also be restricted as a result of the neighboring unfavorable interactions of different monomer types along the chain. However, the most interesting behaviour is observed under poor solvent conditions. In this case, chain collapses adopting a globular overall formation and different aspects of phase behaviour have been discussed depending on the block length , the number of blocks , and the temperature , which can be used to tune the quality of the solvent [50, 51]. It has been discussed that three different regimes can be unambiguously distinguished; a regime where only two domains of monomers of different type are formed. In this case all blocks of A monomers form a single cluster, while all the blocks of B-type monomers belong to another cluster without occurrence of any variation in the number of clusters. This means that the clusters are always separated by an A-B interface and never one cluster of A or B monomers splits in two distinct clusters. Another scenario suggests that full phase separation, as defined above, takes place with a certain probability, which can be very high or very small according to the values of , , and , while the third scenario corresponds to the case that full phase separation as discussed above (formation of only two clusters with different type of monomers) can not take place and a symmetric variation in the number of clusters around an average value is observed [50, 51].
Guided by theory [36], one would rather expect in the long chain limit that a ground-state type structure would be a single lamellar domain, where an interface between all A- and B-type blocks is formed, similarly to what is known for multiblock copolymer melts. Such a structure would have much less (unfavorable) A-B contacts compared to a multidomain structure of A and B clusters, which is kinetically favored in simulations. The phase behaviour of multiblock copolymer chains has been already rather extensively discussed [50, 51]. The overall properties of single multiblock copolymer chains have also been the subject of various studies [52, 53, 54, 55, 56]. In the following we focus our discussion on the static properties of the formed clusters of a single multiblock copolymer chain for a variety of parameters , , and accessible to our simulations. In this way, we provide a complete picture of the cluster formations in a single multiblock copolymer chain under poor solvent conditions. Our results are discussed within the framework of recent results on the phase behaviour of such macromolecules [50, 51].
2 Model and methods to analyze the results
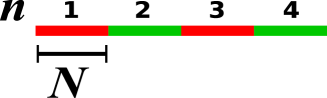
We have considered symmetric linear multiblock copolymers, i.e., the length of all blocks, irrespective of their type, is , the number of A-type blocks is equal to the number of B-type blocks with being an even number denoting the total number of blocks. In our model the blocks of type A and B alternate along the chain. The above parameters are presented schematically in figure 1, where the different colours correspond to the different types of blocks. A single multiblock chain of four blocks is shown; two blocks of A-type monomers and two blocks of B-type monomers compose the multiblock chain in this figure.
Our chains are modelled by the standard bead-spring model [50, 51, 55, 66, 67, 68, 69, 70, 71], where the beads interact via a cut and shifted Lennard-Jones (LJ) potential given by the following formula
| (1) |
where , denote the different type of monomers, and the constant is defined such that the potential is continuous at the cut-off (). For simplicity, , , but , in order to create an unmixing tendency between monomers A and B belonging to different blocks as done in previous studies, and as is used for a standard system (LJ fluid) [72]. Therefore, was kept the same throughout our simulations and () was varied by tuning the temperature . The connectivity along the chain is maintained by the “finitely extensible non-linear elastic” (FENE) potential
| (2) |
, and the standard choices and were used.
For this model we know rather roughly the temperature [73], namely . We also know that for the LJ fluid, which is a standard system, phase separation occurs at a temperature close to . Moreover, the phase separation is favored by the increasing degree of polymerization, and we expect to be able to observe phase separation at temperatures down to , making also use of our previous experience with this model [74, 75]. Indeed, phase separation is encountered for the systems under consideration (e.g., see figure 2). For many of the studied cases phase separation is already observed at temperatures close to , which is the temperature that the system enters to the regime where the chains collapse, i.e., effects due to solvent are progressively becoming important. It is also clear that the use of symmetric structural and potential parameters facilitates our study. Moreover comparison with theoretical arguments could rather be more relevant. We use standard molecular dynamics (MD) simulations where the temperature is controlled by a Langevin thermostat, as is done in previous studies [50, 51, 66, 67, 68, 69, 70, 71, 72, 73, 74, 75]. Thus, the equation of motion
| (3) |
is numerically integrated using the GROMACS package. In Eq. (3), denotes time, is the total potential the th bead experiences, is the mass which is taken as unity, is the friction coefficient, and the random force. and are related by the standard fluctuation-dissipation relation
| (4) |
As in previous work [66, 67, 68, 69, 70, 71, 72, 73, 74, 75], the friction coefficient was chosen as . For the integration of Eq. (3) the leap-frog algorithm [76] is used with a time step of , where the natural time unit is defined as .
We simulated our systems at a temperature close to the temperature () with an integration time step . For longer chains, we used higher temperatures for long equilibration runs, which were typically . After equilibration, we collected a number of independent samples (typically ), which we used as initial configurations for slow cooling runs. We remind the reader, that in our simulations, the effect of the solvent is taken into account only implicitly, i.e., the solvent quality is tuned by variation of the temperature as is common practice. For our slow cooling runs, the temperature was lowered from a high temperature () to a lower one () in temperature steps , for running the system at each temperature for a time range of MD steps. For temperatures below the intrinsic relaxation time of the chains starts to exceed the simulation time. Therefore, taking this big number of statistically independent “cooling histories” is indispensable, in order to obtain meaningful statistical results. We also point out that, the temperature is low enough in order to access the most interesting regime where the chains collapse to form cluster formations. Of course, simulating lower temperatures could be also interesting in order to try to compare our results with relevant theoretical arguments given our rather short chain lengths, but then it would be impossible to simulate such a system with our method. We also note, that the size of the simulation box was chosen such that the multiblock copolymer chain never interacts with its periodic images. For instance, for a chain of total length , . For smaller or longer chains we used correspondingly smaller or bigger simulation boxes satisfying always the above criterion for the size of the simulation box. Further details on the simulated model have been discussed elsewhere [50, 51].
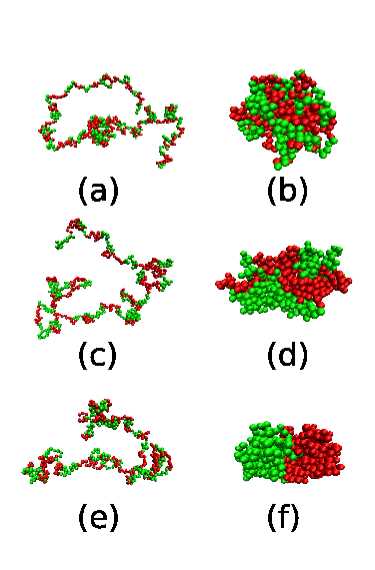
At temperatures close to , coil structures are formed and it seems visually (figure 2(a), (c), and (e)) that small differences exist for multiblock chains of different structural parameters , , as for example in figure 2. Of course, even at this high temperature differences in the overall formation of the coil structure occur, but, here, we mainly focus on the static properties of the clusters. The most interesting effect would be that the overall formation of the chains deviates from a spherical shape. At such temperatures, blocks of the same type of beads can only form occasionally clusters due to the highly present thermal fluctuations. At temperatures below the chains collapse and blocks of the same type of monomers form clusters with other monomers belonging to different blocks, due to the unfavorable interactions between A and B beads. Figure 2 shows also this case of phase separation, where in case (b) all blocks of the same type are not able to join together to a single cluster. In this case, we have a symmetric variation in the number of clusters, as it has been discussed elsewhere [50, 51]. Then in case (d), the formation of two only clusters of dissimilar blocks is taking place with a certain probability, which might be high or small according to the choice of parameters and . In case (f) the blocks of different type are always phase separated and they form two different clusters, with an A-B interface formed between clusters. Here, the thermal fluctuations cannot overcome the incompatibility between dissimilar beads, and the clusters are always phase separated. One would need to identify the beads belonging to each cluster in order to describe the overall size of these cluster formations. We used the Stillinger criterion and the standard choice [77], as is done in previous work [50, 51, 74, 75]. We also used smaller values of and similar results were obtained, while higher values are hardly significant, due to the rapid fall-off of the LJ potential.
Properties, , depending on the fluctuating number of clusters, should be averaged with the probability that a number of clusters per block occurs (), i.e.,
| (5) |
Due to the symmetry of our model, the statistical analysis for A and B clusters should end up in the same results. This is confirmed in our analysis, validating also our simulation protocol. Therefore, results on the clusters’ properties will refer either to clusters with monomers of type A or clusters of monomers B only, and nowhere clusters of A and B monomers in a single cluster are considered, although this is possible given our criterion due to thermal fluctuations.
3 Results and Discussion
In figure 3 we present results for the density profiles of multiblock chains with the same total length , but different combination of parameters and , mathematically expressed by the following formula
| (6) |
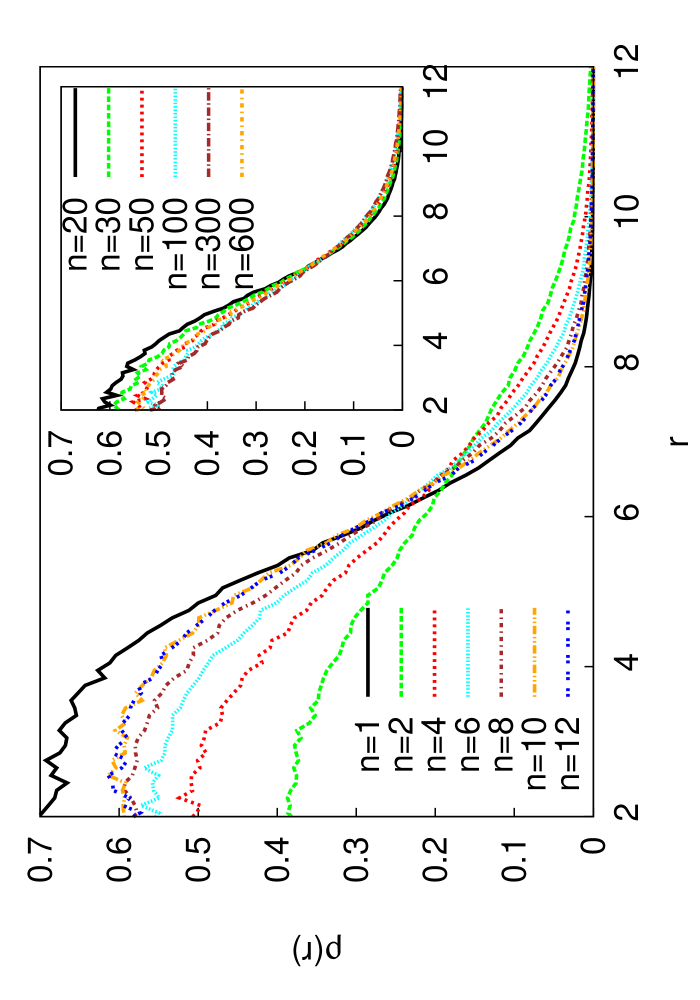
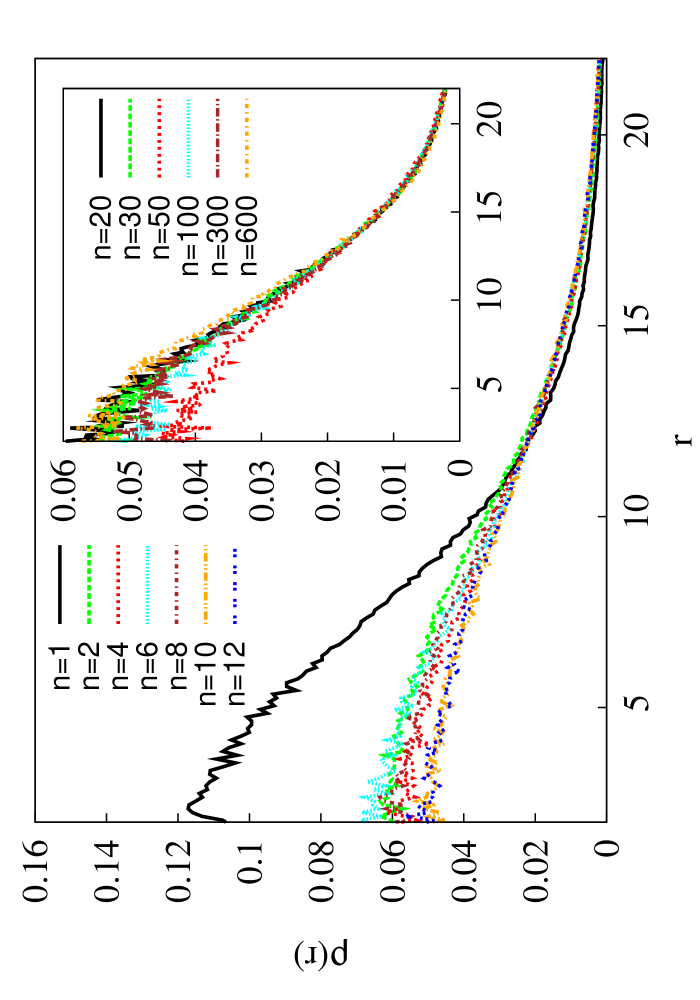
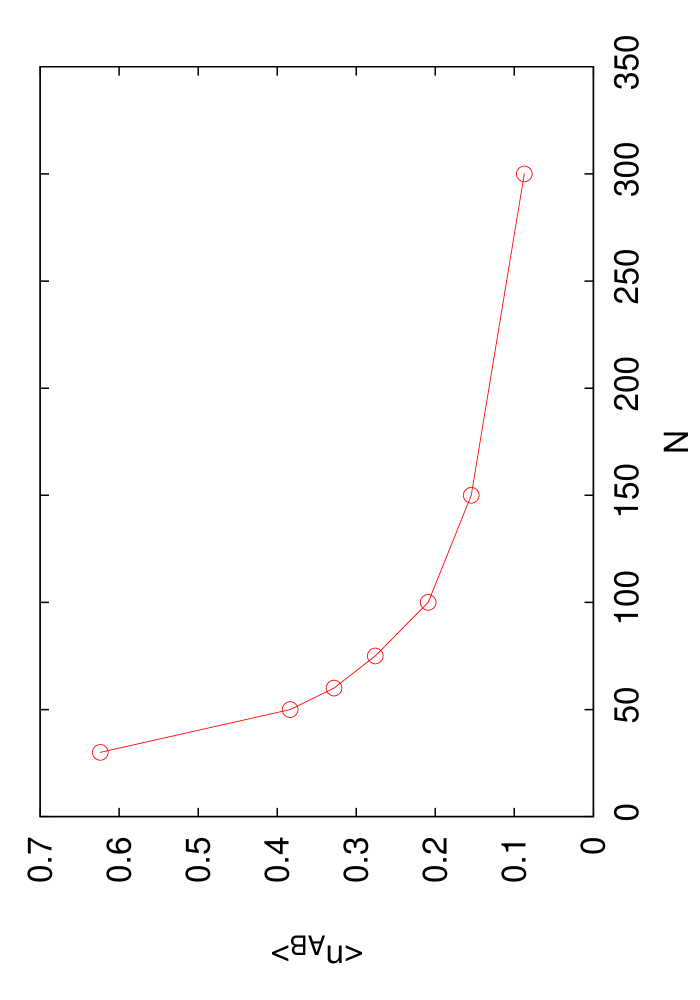
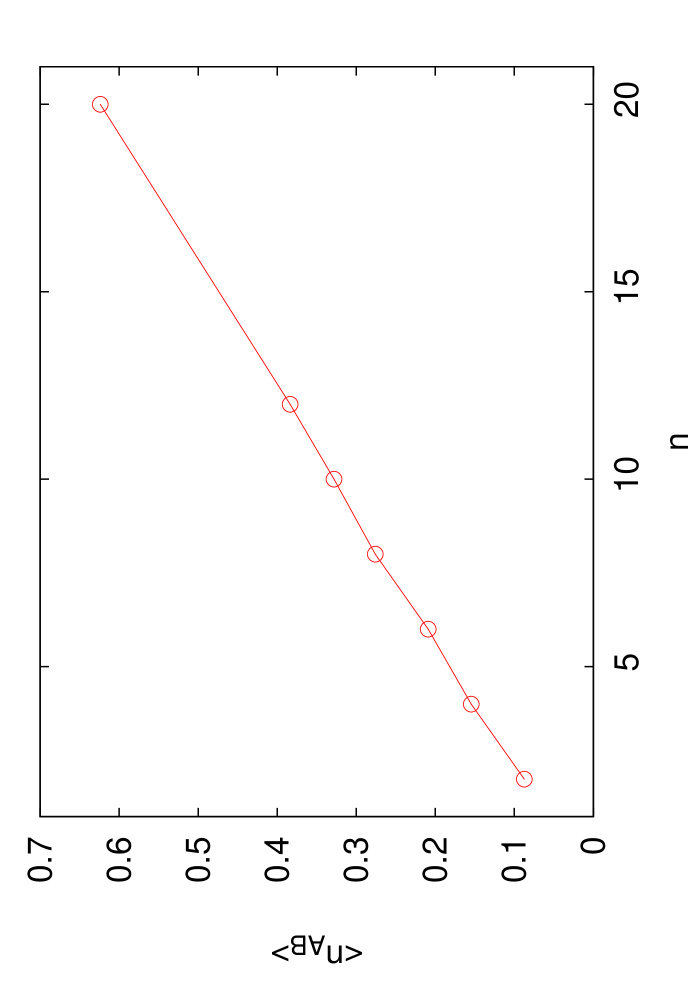
where is the Dirac delta function, the position of the center of mass of the whole chain and the positions of all monomers irrespective of their type (A or B). The angle brackets denote an average over all configurations as usual. At low temperatures (e.g., in figure 3(a) ) the differences are more pronounced than they appear at higher temperatures, i.e., (figure 3(b)). However, the differences between a homopolymer chain of the same length () and multiblock chains () at both temperatures are rather high even at temperatures close to showing that the case of multiblock copolymers strongly deviates from the case of a homopolymer chain. Multiblock copolymer chains are rather overally swollen in the radial directions due to the unfavorable interactions between neighboring A and B blocks at “high” temperature and all different blocks at lower temperatures. At and for small (or equivalently high , since is fixed in this case) the multiblock copolymers have pronounced differences in their densities close to the center of the macromolecule. This region of for this total chain length corresponds to the case (f) of figure 2, where full phase separation of the blocks of different type has taken place. Even though the chains exhibit the same phase behaviour, rather pronounced differences are observed in density profiles, showing that the interface between A and B monomers is not the same in all cases. As increases, one would expect that the contacts between A and B monomers at the interface should also increase in the collapse state (), and the cross-section should rather change from a double-cylinder-like to a dumbbell-like shape [70]. Therefore, it is relevant that we count the contacts between A and B beads, which is expressed by the following formula [71],
| (7) |
where is the absolute value of the distance between two sites of monomers in the multiblock copolymer chain, and the corresponding radial distribution function. Eq. 7 means that a pair of monomers is defined to have a pairwise contact if their distance is less than . Similar quantities have been also used to characterize the incompatibility between linear and star chains in polymer melts and blends [78, 79, 80]. As it can be seen from figure 4, the number of contacts A-B averaged over all conformations increases as the number of blocks increases. Also, we could see from figure 4(b) that the average number of blocks has a linear dependence on the number of blocks , although we have always the formation of only two phase separated clusters, and the number of contacts per monomer remains less than . One would expect that could be an indication for full phase separation. Lower values of unfavorable contacts is an indication for the occurrence of only two phase separated clusters of A and B blocks (full phase separation), present at this low temperature. For high values of (figure 3(a)) there are rather small differences in the density profiles. In this regime a variation in the number of clusters has been observed. At (figure 3(b)) the differences, which were present for small at low temperatures, have almost disappeared. Already at the behaviour shown in figure 3(b) preempts that of figure 3(a), and is an indication that the chain leaves the collapsed state. For differences should also result from the deviation of the overall formation from a completely spherically formation. We postpone such detailed discussion on these phenomena to a later communication.
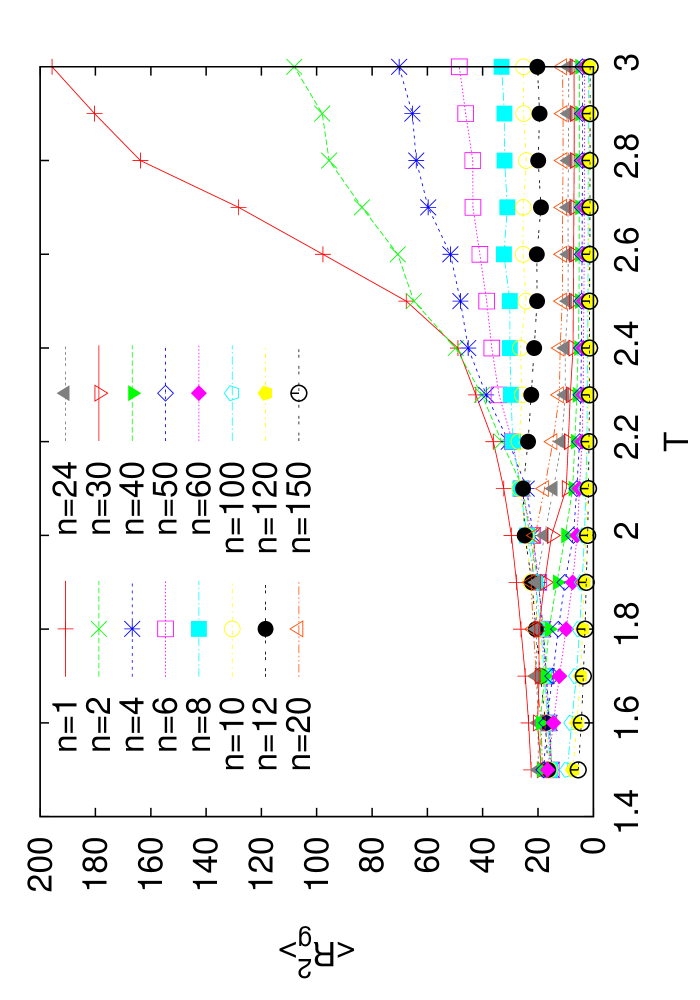
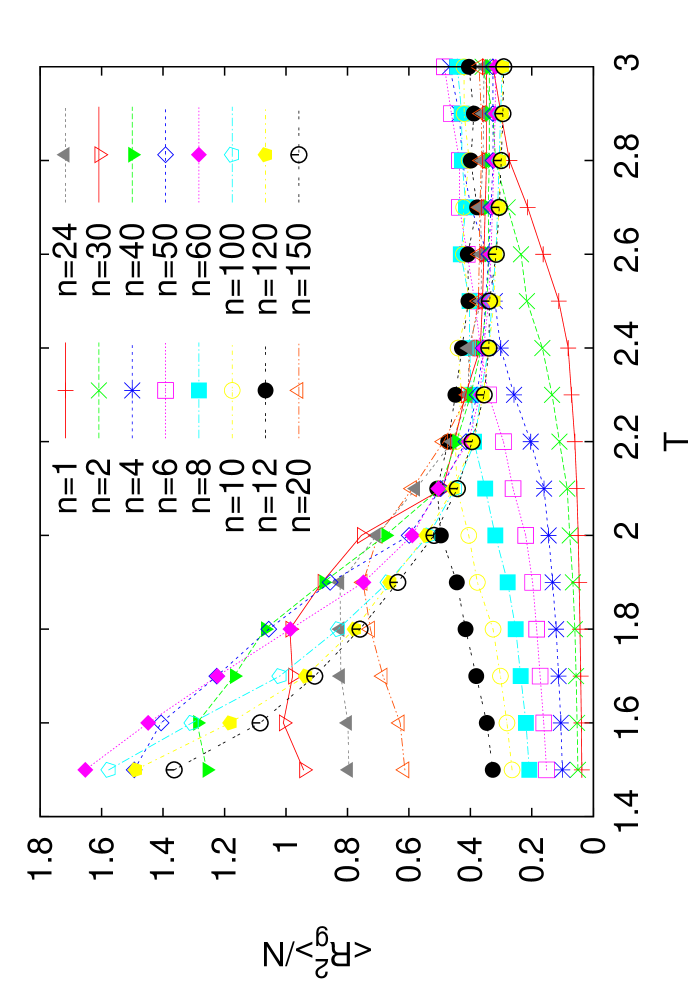
We turn now to the properties characterizing the size of the clusters. Assuming that there should not be any preferential orientation, it is natural to characterize the size of our clusters by calculating the gyration radii of the formed clusters. Figure 5 shows results for and the temperature dependence of their size. For these results the total length of the multiblock copolymer chains is . At first, we can clearly see (figure 5(a)) the effect of the temperature on the homopolymer chain. A major change in the slope of the cluster size with the temperature occurs at temperatures close to and it is completed at temperatures close to . A smooth crossover from coil-like structures to collapsed-chain structures takes place for this range of temperatures. This crossover becomes smoother in the multiblock copolymer cases. Also, it seems to be slightly shifted to lower temperatures, i.e., close to . For the multiblock copolymer chains, we can distinguish two different behaviours. For small (these cases correspond to phase behaviour like the one shown in figure 2(f)), the size of the clusters shows a monotonic behaviour with the temperature variation, i.e., the size of the cluster increases monotonically with the increase of the temperature. As increases the variation with the temperature is smaller. Of course at high temperatures, where rather individual blocks compose each cluster, the size of these clusters has a straightforward dependence on the size of the individual blocks. Moreover, the length is rather high ( low, since in this case) and the probability of two clusters to join is “high”, due to the high length of the blocks and the high flexibility of the chain, which has a lower number of unfavorable A-B contacts. Then, we can distinguish a second behaviour, where the size of the clusters at higher temperatures are smaller than the clusters at low temperatures. In this case and at temperatures close to , the clusters, which are composed of rather individual blocks, have smaller dimensions compared to their size at low temperatures, where blocks join together leading to the formation of clusters of monomers of the same type. Overall, as the number of blocks increases, the behaviour of multiblock copolymers deviates further from the homopolymer case. Moreover, the decrease of the block length results in clusters of smaller dimensions in all cases and at all temperatures. Only at low temperatures and in the regime where full phase separation occurs (small values of , in the range of and presented here) we can see that the clusters have the same size. This is the case that the multiblock copolymer chain has only two clusters with monomers of different type, but each cluster contains the same number of monomers A or B for different . This is the proof that the interface between A and B clusters is mainly held responsible for the differences arising in the density profiles for small at low temperatures. It is natural that the size of the single cluster of the homopolymer case should be the highest at “high” temperatures (the block is the longest, in this case). However, plotting our data in a different way figure 5(b), we can see that the dimensions of the clusters are on average (normalized by ) higher as the dimension of the individual blocks at higher temperatures. In such a plot one could still distinguish between the different regimes discussed above.
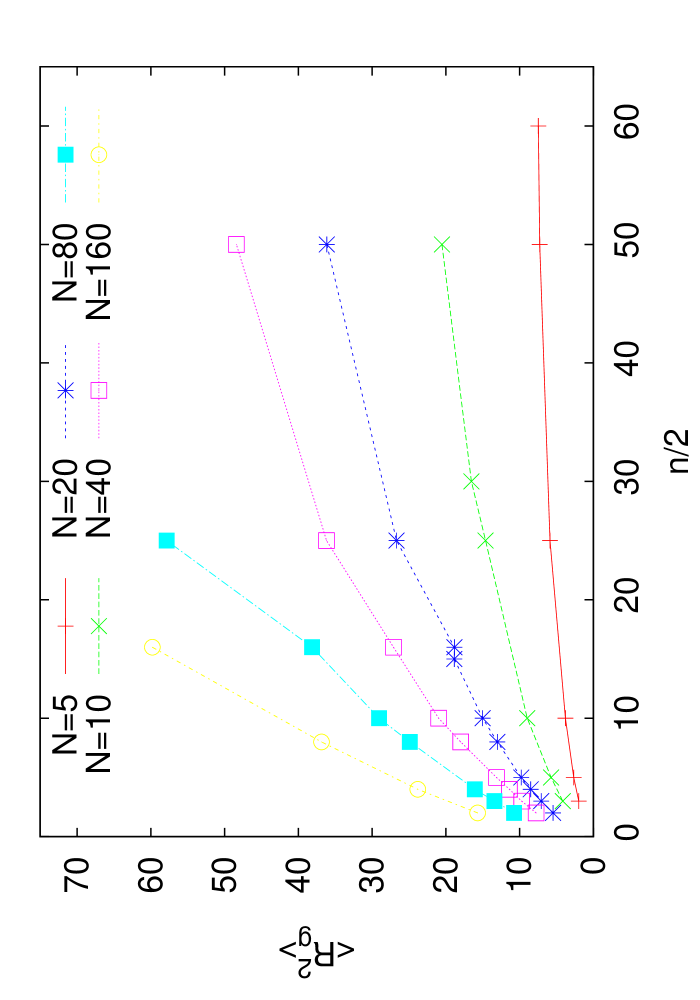
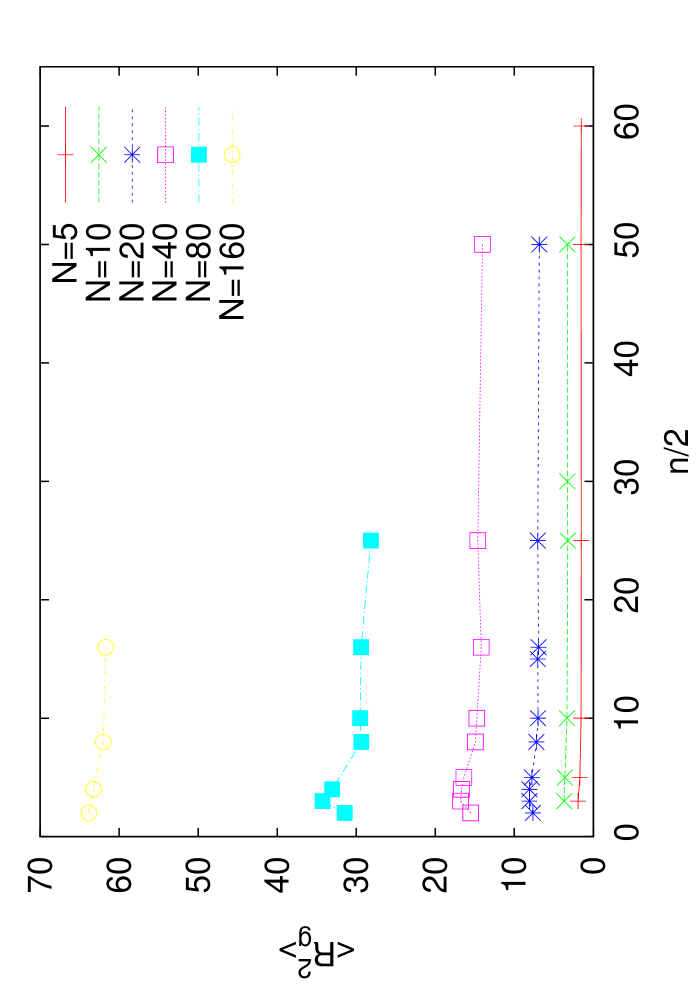
In figure 6 we present results for the dependence of the average size of the cluster formations on the number of blocks of A-type monomers. Of course, as it has been already discussed the results are the same for B-type monomers due to the symmetry of our model. Therefore, keeping constant the block length , we altered the number of blocks . Figure 6(a) presents such results at . When is small (e.g., ), a rather small variation with the number of A or B blocks is seen. As the block length increases the slope of the curves also increases, showing that the variation with the number of blocks is high. It should be conceivable that also for high () a plateau-like regime could be reached as in the case of , such that the system departs from the full phase separation regime. Yet, we are not able to access this regime with our simulations. By increasing the temperature, for instance (not shown here), the cases of small do not show any dependence with the variation of the number of blocks, whereas for high the linear dependence regime becomes smaller. We know that phase separation is favored from higher block lengths. Therefore, blocks of small start to behave independently (leave a cluster) already at a lower temperature. At temperatures close to the temperature (above , i.e., , figure 6(b)) cluster formations containing two or more blocks of the same type of monomers are hardly formed. Therefore, one should hardly observe any dependence on the number of blocks and the size of the clusters should rather reflect the size of individual blocks However, we remind the reader that, even at these high temperatures, blocks with monomers of the same type do occasionally form clusters, and therefore the size of these clusters should not be considered absolutely as the size of the individual blocks.
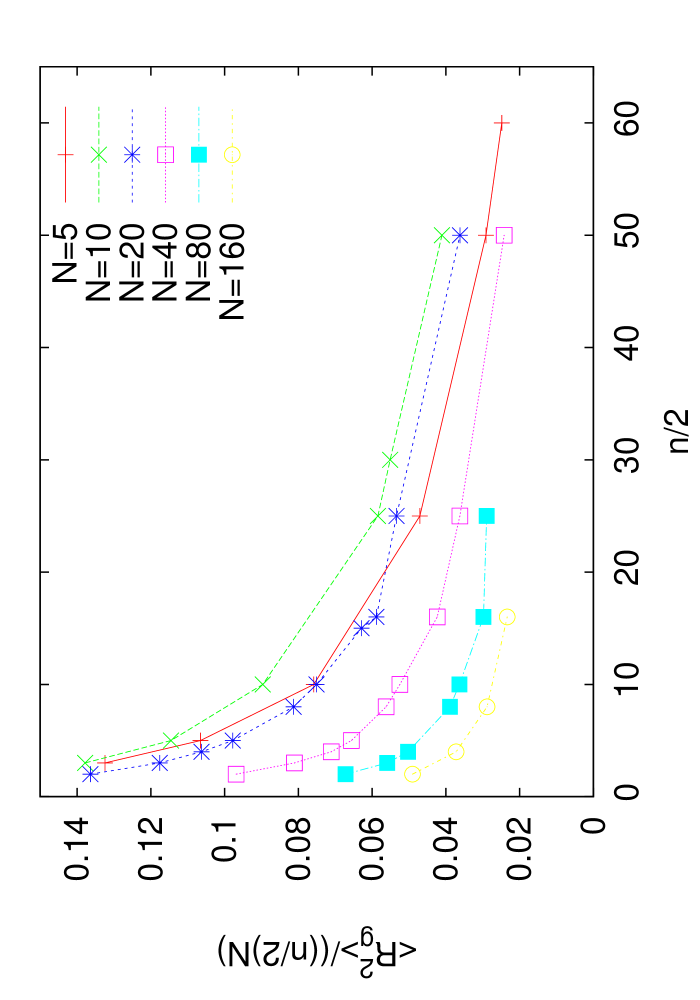
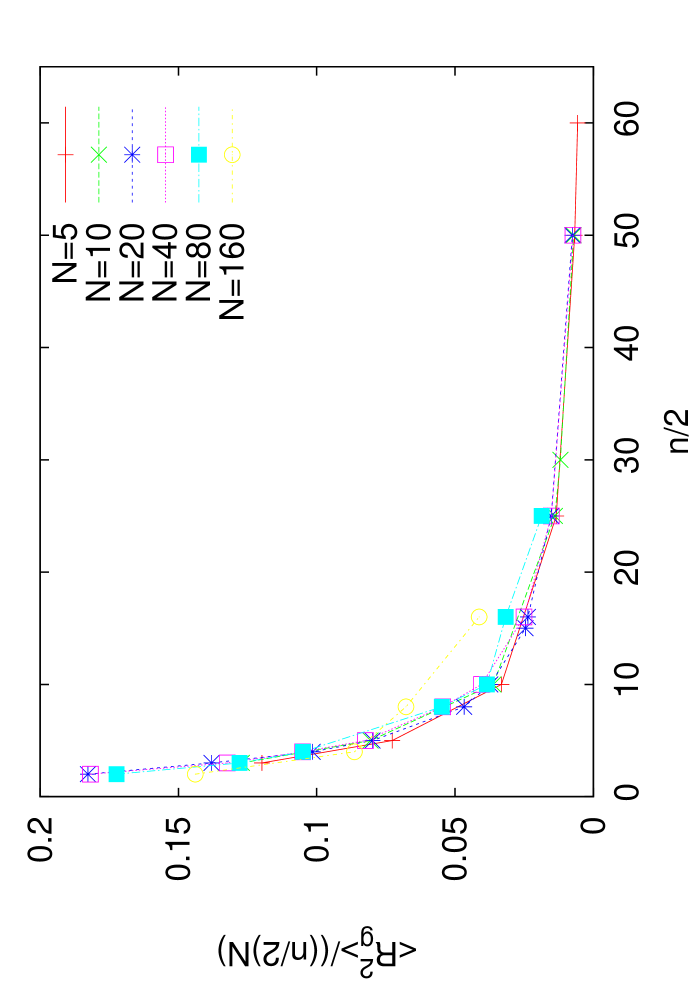
It would be desirable to plot our results in such a way that the regime of rather individual clusters could be distinguished from the regime of collapsed chain. Such plots are shown in figure 7. At low temperatures (i.e., , figure 7(a)) and for block lengths below ( for these systems a variation in the number of clusters is observed and occasionally two only separated clusters of different monomers are observed [50, 51]) the curves do not show any systematic behaviour. It is only for higher block length , where the block length high enough to lead to phase separation between different blocks, that we can clearly see the different behaviour. A “plateau regime” is accessed faster for higher . As the temperature increases (above ), we reach a temperature where the curves collapse onto a single curve for the different block lengths showing the same behaviour with the number of A or B blocks . Our claim for a universal temperature boundary around (figure 7(b)) seems to be correct. The effect of the solvent quality is proven to play an important role below this temperature, for all the multiblock chains. Further increase of the temperature increases the overall size of the chains. Thus, at (not shown here) the curves are still on top of each other as in figure 7(b), but only a small change in the slope of the curves with the number of blocks can be observed. This shows that the increase of the temperature has the effect of weakening further the dependence on the number of blocks . Also, increase of the temperature shifts the curvatures slightly to higher values of , as it is expected.
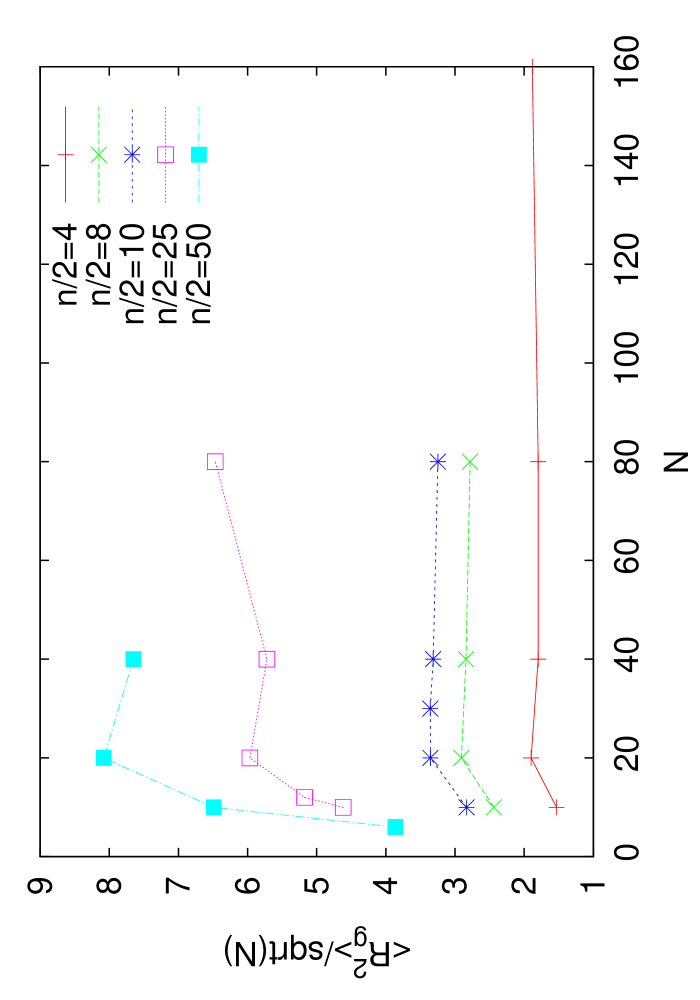
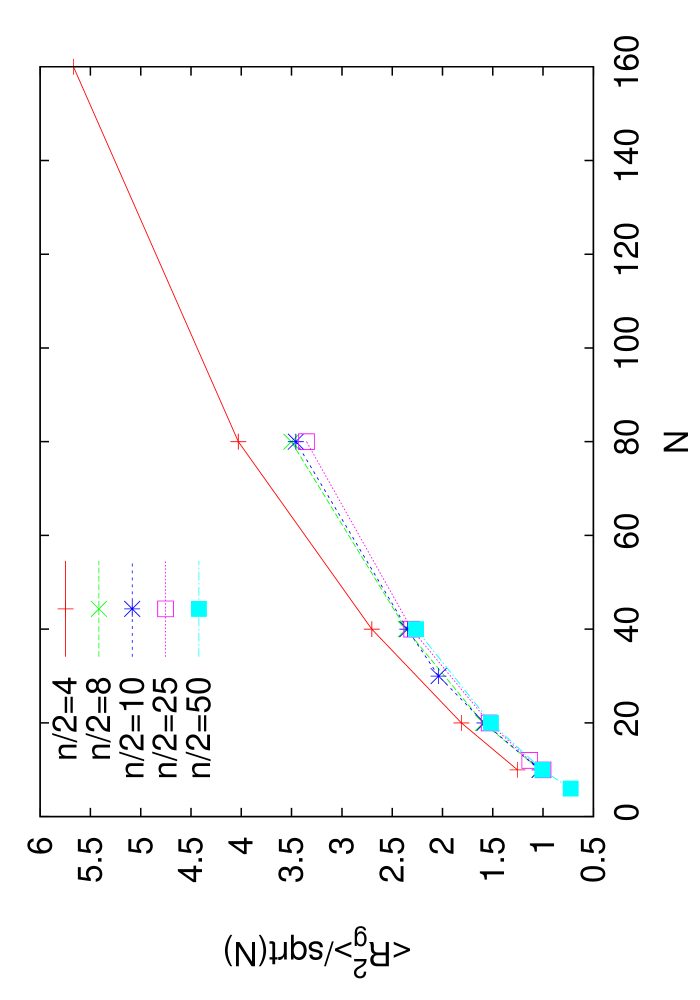
We can present correspondingly the dependence of the cluster sizes on the block length for different multiblock copolymer chains composed of different number of blocks (). Such plots are presented in figure 8 for two different temperatures, i.e., a low temperature where the chain is fully collapsed, and a temperature close to the temperature. We have seen that full phase separation between blocks can not take place when the block length is lower than in the range of temperatures which are studied here. In the regime of full phase separation as it has been discussed in this study (at rather low temperatures) the size of the clusters does not depend on the block length for different number of blocks, when the normalization of figure 8 is chosen. Below , full phase separation cannot take place, a variation in the number of clusters is observed, and higher dependence is seen on the block length for higher number of clusters, until a plateau is reached for . This behaviour is rather universal for multiblock chains of different number of blocks. Then, at our data show the same behaviour exhibiting an almost linear dependence on for all the cases of different . However, for small number of blocks length () the curve is shifted. For higher values of blocks this shift is smaller as this number of blocks increases. This behaviour is compatible with the picture obtained from overall properties, as it is, for example, the density profiles of figure 3(b).
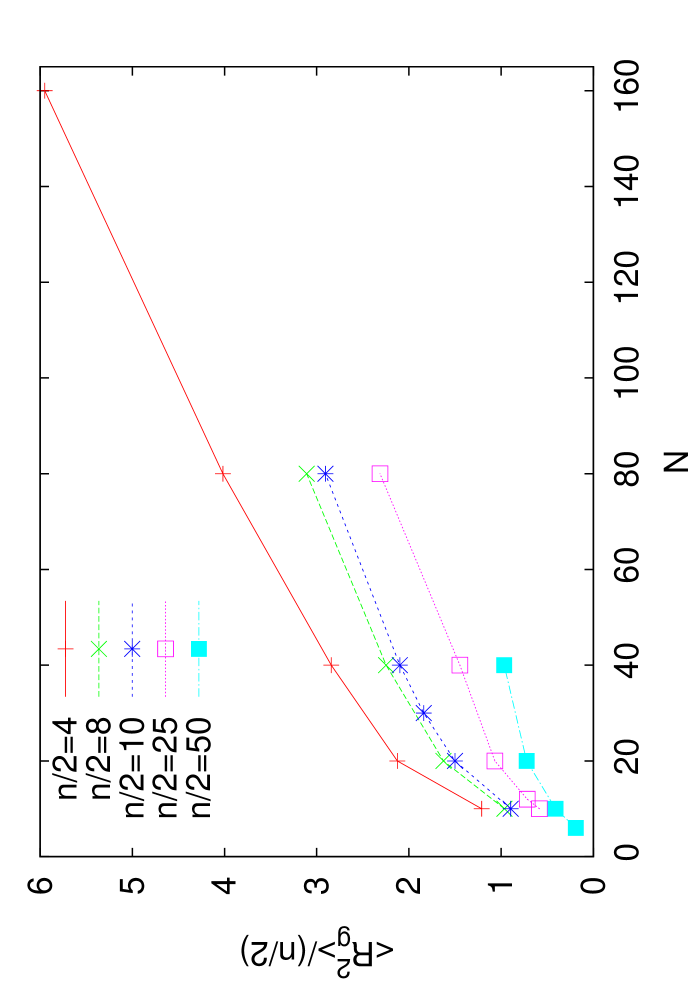
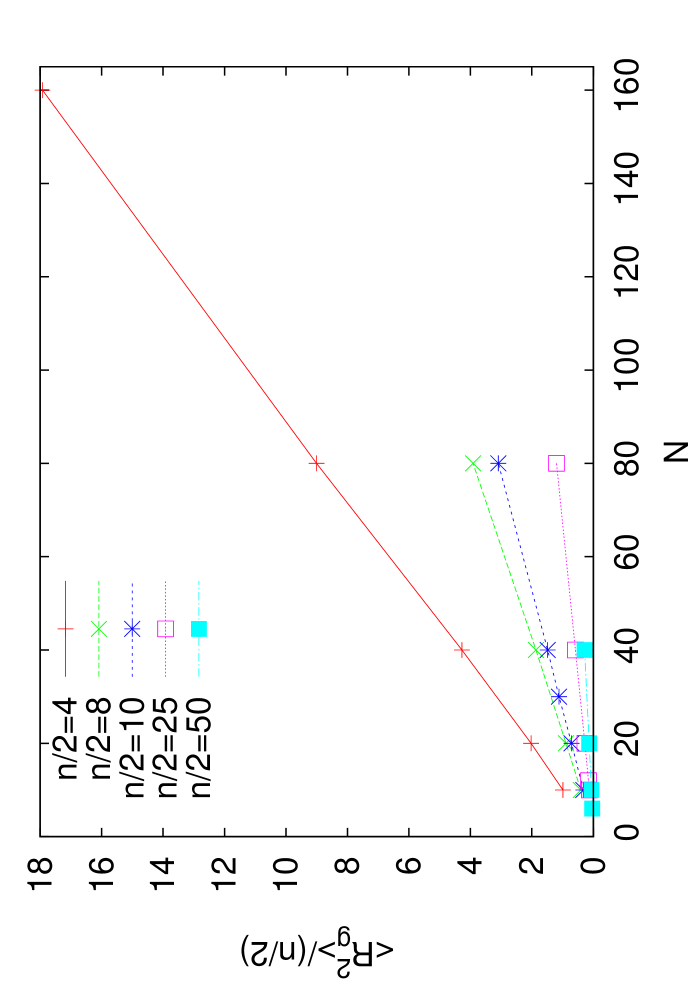
It is interesting to augment our discussion by dividing our data by the number of blocks (, figure 9). At lower temperatures (i.e., ) a universal boundary between two linear regimes is seen; when is small i.e., . Then a different regime is reached, where a linear dependence with a different slope from the first linear regime is seen. As the temperature increases close to , where the clusters are mainly composed by individual blocks, we can clearly see a single linear behaviour extending over all the considered block lengths . When the number of blocks is small, the slope describing the dependence on the block length is higher. In this case blocks of monomers of the same type have higher probability to cluster occasionally. As the number of blocks increases, this probability of occasional clustering globally decreases as the number of unfavorable interactions decrease. Such a linear behaviour shows that that the blocks individually behave “locally” like homopolymer chains, and it is only the A-B contacts between connected blocks that control such behaviour. Plots like figure 9 provide an indication of the proximity of the temperature for the chains.
4 Concluding remarks
In this study, we have investigated the static properties of a single multiblock copolymer chain under poor solvent conditions. The interactions were chosen symmetrically, as well as the structural parameters of the chains, i.e., the length of the blocks with monomers of type A or B were equal, and the number of blocks A was equal to the number of blocks B, while the blocks of different type alternated along the chain. We used standard molecular dynamics simulations of a bead-spring model for our simulations, and we focused our discussion on the dependence of the size of the cluster formations occurring at low temperatures on the varied parameters, i.e., the block length , the number of blocks , and the temperature which was used to tune the quality of the solvent. Our analysis was presented in the context of recent results on the phase behaviour of such macromolecules. We showed that the number of contacts at the interface between A and B monomers, in the case where the multiblock copolymer chain at a low temperature (e.g., ) is always split in two microphase separated clusters composed of blocks of the same type of monomers, varies linearly with the number of blocks and it is lower than ( was kept constant).
Accordingly, we studied the dependence of the clusters’ size on the temperature discussing our results in the context of recent results on the phase behaviour of such macromolecules. We could clearly distinguish the different regimes relating to the different phase behaviours. The dimensions of the clusters as a function of the number of blocks and the block length were independently studied. A comprehensive discussion of the dependence of the clusters’ size on the was given, discussing also the effect of the temperature. Furthermore, we showed (figure 7) that our data collapse onto a single curve when the chains leave the collapsed state and gradually adopt coil-like conformations. Thus, we could use such plots to identify this boundary. This occurs at temperature . Then, the dependence of the size of the formed clusters on the block length was presented. We showed that at lower temperature the collapsed state results in two different linear regimes with a smooth crossover between them. At temperatures close to temperature a linear dependence on the block length is seen for all block lengths with a different slope, i.e., as the number of blocks increases, there is a smaller dependence on the block length , when the data for gyration radius are normalized with the number of blocks. Our results, in combination with recent results on the phase behaviour of symmetric linear multiblock copolymers, provide a complete picture of the behaviour of the cluster formations in such macromolecules for the range of parameters accessible to simulations.
References
References
- [1] Benoit H 1953 J. Polym. Sci. 11 597
- [2] Flory P J and Abe A 1978 Macromolecules 6 1119
- [3] Glatter O and Kratky O 1982 Small angle X-Ray Scattering (New York: Academic Press)
- [4] Fried H and Binder K 1991 J. Chem. Phys. 94 8349
- [5] de Gennes P -G 1988 Small angle X-Ray Scattering (London: Cornell University Press)
- [6] Leibler L 1980 Macromolecules 13 1602
- [7] Benoit H and Hadziioannou G 1988 Macromolecules 21 1449
- [8] Hadziioannou G, Benoit H, Tang W, Shull K and Han C 1992 Polymer 33 4677
- [9] Mayes A M and de la Cruz M 1989 J. Chem. Phys. 91 7228
- [10] Löwenhaupt M and Hellmann G P 1991 Polymer 32 1065
- [11] Matsen M and Schick M 1994 Phys. Rev. Lett. 72 2660
- [12] Matsen M W and Schick M 1994 Macromolecules 27 6761
- [13] Matsen M W 1995 J. Chem. Phys. 102 3884
- [14] Fredrickson G H and Sides S W 2003 Macromolecules 36 5415
- [15] Fredrickson G H and Sides S W 2003 Macromolecules 36 5415
- [16] Erukhimovich I Ya and Dobrynin A V 1992 Macromolecules 25 4411
- [17] Angerman H, ten Brinke G and Erukhimovich I 1996 Macromolecules 29 3255
- [18] Dobrynin A V and Leibler L 1997 Macromolecules 30 4756
- [19] Slot J J M, Angerman H J and ten Brinke G 1998 J. Chem. Phys. 108 8677
- [20] Friedel P, John A, Netz R R, Pospiech D and Jehnichen D 2002 Macromol. Theory. Simul. 11 785
- [21] John A, Friedel P, Pospiech D, Jehnichen D and Kunert C 2004 Macromol. Theory. Simul. 13 702
- [22] Leibler L and Benoit H 1981 Polymer 22 195
- [23] Fredrickson G H 1991 Macromolecules 24 3456
- [24] Fredrickson G H, Milner S T and Leibler L 1992 Macromolecules 25 6341
- [25] Spontak R and Zelinksi J 1992 Macromolecules 25 6341
- [26] Spontak R 1994 Macromolecules 27 6363
- [27] Spontak R, Fung J, Braundfeld M, Sedat J, Agrad D, Ashaf A and Smith S 1996 Macromolecules 29 2850
- [28] Gross C and Paul W 2010 Soft Matter 6 3273
- [29] Khandpur A K, Förster S, Bates F S, Hamley I W, Ryan A J, Bras W, Almdal K and Mortensen K 1995 Macromolecules 28 8796
- [30] Sugiyama K, Toshiyuki O, El-Magd A A and Hirao A 2010 Macromolecules 43 1403
- [31] Matyjaszewski K and Xia J H 2001 Chem. Rev. 101 2921
- [32] Balazs A C, Gempe M and Brady J E 1990 J. Chem. Phys. 92 2036
- [33] Fredrickson G H and Milner S T 1991 Phys. Rev. Lett. 67 835
- [34] Glotzer S C, Bansil R, Gallagher P D, Gyure M F, Sciortino F and Stanley H E 1993 Physica A 201 482
- [35] Leibler L 1982 Macromolecules 15 1283
- [36] Matsen M W and Schick M 1994 Macromolecules 27 7157
- [37] Halperin A and Zhulina E B 1991 Europhys. Lett. 16 337
- [38] He X, Herz J and Guenet J-M 1987 Macromolecules 20 2003
- [39] He X, Herz J and Guenet J-M 1988 Macromolecules 21 1757
- [40] Houdayer J and Müller M 2004 Macromolecules 37 4283
- [41] de Gennes P -G 1979 Faraday Discuss. Chem. Soc. 68 96
- [42] Flory P J 1953 Principles of Polymer Chemistry (New York: Cornell University Press)
- [43] Fredrickson G H and Helfand E 1987 J. Chem. Phys. 87 697
- [44] Fredrickson G H and Binder K 1989 J. Chem. Phys. 91 7265
- [45] Almdal K, Rosedale J H, Bates F S, Wignall G V and Fredrickson G H 1990 Phys. Rev. Lett. 65 1112
- [46] Bates F S and Fredrickson G H 1990 Ann. Rev. Phys. Chem. 41 525
- [47] Leibler L 1980 Makromol. Chem., Rapid Commun. 2 393
- [48] de Gennes P-G 1970 J. Phys. (Paris) 31 235
- [49] Semenov A N 1985 Sov. Phys. JETP 61 733
- [50] Theodorakis P E and Fytas N G 2011 Soft matter 7 1038
- [51] Theodorakis P E and Fytas N G 2011 EPL 93 43001
- [52] Olaj O F, Neubauer B and Zifferer G 1998 Macromol. Theory Simul. 7 171
- [53] Molina L A and Freire J J 1995 Macromolecules 28 2705
- [54] Molina L A, Rodriquez A L and Freire J J 1994 Macromolecules 27 1160
- [55] Pham T T, Dünweg B and Prakash J R 2010 Macromolecules 43 10084
- [56] Olaj O F, Neubauer B and Zifferer G 1998 Macromol. Theory Simul. 7 171
- [57] Chen H, Cai J, Ye Z, Peng C, Liu H, Hu Y and Jiang J 2008 J. Phys. Chem. B 112 9568
- [58] Chen H, Chen X, Ye Z, Liu H and Hu Y 2009 Langmuir 26 6663
- [59] Chen H, Peng C, Sun L, Liu H, Hu Y and Jiang J 2007 Langmuir 23 11112
- [60] Chen H, Peng C, Ye Z, Liu H, Hu Y and Jiang J 2006 Langmuir 23 2430
- [61] Chen H and Ruckenstein E 2010 Polymer 51 968
- [62] Chen H and Ruckenstein E 2009 J. Chem. Phys. 131 244904
- [63] Yue K and Dill K A 1995 Proc. Natl. Acad. Sci. U. S. A. 92 146
- [64] Creigton T E 1994 Protein Folding (New York: Freeman)
- [65] Magee J E, Vasquez V R and Lue L 2006 Phys. Rev. Lett. 96 207802
- [66] Grest G S and Kremer K 1986 Phys. Rev. A: At., Mol., Opt. Phys. 33 3628
- [67] Theodorakis P E, Paul W and Binder K 2009 EPL 88 63002
- [68] Grest G S and Murat M 1995 Monte Carlo and Molecular Dynamics Simulations in Polymer Science (New York: Oxford University Press) ed Binder K
- [69] Grest G S 1999 Adv. Polym. Sci. 138 149
- [70] Theodorakis P E, Paul W and Binder K 2010 Macromolecules 43 5137
- [71] Erukhimovich I, Theodorakis P E, Paul W and Binder K 2011 J. Chem. Phys. 134 054906
- [72] Das S K, Horbach J and Binder K 2003 J. Chem. Phys. 119 1547
- [73] Grest G S and Murat M 1993 Macromolecules 26 3108
- [74] Theodorakis P E, Paul W and Binder K 2010 J. Chem. Phys. 133 104901
- [75] Theodorakis P E, Paul W and Binder K 2011 preprint
- [76] van Gunsteren W F and Berendsen H J C 1988 Mol. Simul. 1 173
- [77] Stillinger F H 1963 J. Chem. Phys. 38 1486
- [78] Müller M and Binder K 1995 Macromolecules 28 1825
- [79] Theodorakis P E, Avgeropoulos A, Freire J J, Kosmas M and Vlahos C 2007 J. Phys.: Condens. Matter 19 466111
- [80] Theodorakis P E, Avgeropoulos A, Freire J J, Kosmas M and Vlahos C 2007 J. Chem. Phys. 126 175904