Study of LINER sources with broad H emission.
X-ray
properties and comparison to luminous AGN and X-ray binaries.
An important number of multiwavelength studies of low ionization nuclear emission-line regions (LINERs) were dedicated to investigate the excitation mechanism responsible for the detected emission lines. Radiative emission from accretion into a super massive black hole (SMBH) is now believed to be, in an increasing number of LINERs, the source of excitation. However, the accretion mode is not yet firmly understood, and could be explained in either a thin accretion disk or a radiatively inefficient accretion flow (RIAF). Our purpose is to study the X-ray properties of LINER sources with definite detection of a broad H emission line in their optical spectra, LINER 1s from Ho et al. sample. These objects preferentially harbor a low luminosity active nucleus at the center and show small or no intrinsic absorption (1022cm-1). We compare their X-ray properties to both X-ray binaries and luminous AGN. We analyzed all available X-ray archived XMM-Newton and Chandra observations of 13 LINER 1s satisfying the above criterion in a systematic homogeneous way. We looked for any correlations between the X-ray properties and the intrinsic parameters of our sample of LINER 1s. An absorbed power-law gave a good fit to the spectra of 9 out of the 13 sources in our sample. A combination of a thermal component and an absorbed power-law were required in the remaining 4 sources. We found a photon index for our sample between for the hardest source and for the softest one with a mean value of and a dispersion . The thermal component had a mean temperature kT keV. Significant short (hours to days) time-scale variability is not common in the present sample and was observed in only 2 sources (NGC 3226 and NGC 4278). Three other sources indicate a possible variability with a low K-S test probability (2%–4%) that the nuclear emission originates from a constant source. On the other hand, significant variability on a longer time-scale (months to years) is detected in 7 out of the 9 sources observed more than once. No significant Fe K emission line at 6.4 keV was detected and upper limits were derived for the 4 sources with a high enough signal to noise ratio around 6 keV. Finally, we established, for the first time for a sample of LINER 1s, that the photon index is significantly anticorrelated to . Whereas this anticorrelation is in contrast to the positive correlation found for type 1 AGN, it is similar to the one seen in XRBs in their low/hard state where a radiatively inefficient accretion flow is thought to be responsible for the X-ray emitted energy.
Key Words.:
Accretion, accretion disks – galaxies: active – galaxies: nuclei – X-rays: galaxies1 Introduction
It is widely known that a large fraction of local galaxies contain emission line nuclei that are the result of low nuclear activity. Ho et al. (1995, 1997a, 1997b) showed that more than 40% of 486 nearby galaxies with mag could be considered as active with optical spectra classified as Seyfert nuclei, low-ionization nuclear emission-line regions (LINERs, Heckman 1980), or transition objects (objects having intermediate spectra between LINERs and H II nuclei). Pure LINER sources would be the most common component representing 20% of all 486 galaxies. The ionization mechanism responsible for the excitation of emission lines in LINER sources is an ongoing matter of debate and could be explained in terms of: shock heated gas (Dopita & Sutherland 1995), starburst activity (Alonso-Herrero et al. 2000; Terlevich & Melnick 1985), or a low luminosity active Galactic nucleus (AGN). Many multiwavelength studies were attributed to this subject, looking for a radio, sometimes variable, core (Nagar et al. 2005) or a variable UV core (Maoz et al. 2005) in nearby LINER sources. Nevertheless, the most used tool to search for an active nucleus in a LINER is to look for a hard 2-10 keV unresolved core that could not be due to diffuse emission from shock heated gas or from unusually hot stars (Terashima et al. 2000; Ho et al. 2001; Dudik et al. 2005; Flohic et al. 2006; González-Martín et al. 2006, 2009; Zhang et al. 2009). How do LINERs harboring a low luminosity active nucleus compare to luminous Seyfert galaxies and quasars?
Maoz (2007), using high angular resolution multiwavelength observations of 13 LINER sources, demonstrated that the luminosity ratios in different wavebands, mainly UV to X-ray and radio to UV luminosities, follow the same trend as luminous Seyfert galaxies. The authors did not find any sharp change in the spectral energy distribution (SED) of their sample of 13 LINERs compared to more luminous Seyfert and quasar nuclei, suggesting that a thin accretion disk may persist at low accretion rates. Moreover, Pian et al. (2010) detected up to 30% flux variations on half a day time-scale in 2 (NGC 3998 and M81) out of 4 LINER and low luminosity AGN sources observed in X-ray with the XRT onboard Swift. They combined their X-ray fluxes with simultaneous UV fluxes coming from the UVOT instrument and showed that the SED and the UV to X-ray flux ratios of their 4 sources sample are consistent with those of more luminous sources and that LINERs may have similar accretion and radiative processes at their center compared to luminous Seyfert nuclei.
On the other hand, the faintness of LINER sources compared to luminous Seyfert galaxies and quasars has been attributed to a different accretion mechanism owing to some observational contrast between the two classes. No broad nor narrow Fe K emission line at 6.4 keV have been detected in the spectra of the LINER sources with the highest signal to noise ratio (Ptak et al. 2004; Binder et al. 2009), X-ray short time-scale variability has been detected in only a few sources (Ptak et al. 1998; Awaki et al. 2001), and the disappearance of the big blue bump in the UV band in the SED of LINER sources (Ho 1999, 2008), all these signatures could indicate the disappearance of the thin accretion disk at low luminosities and that a different accretion mechanism is responsible for the emission in LINER sources. It has been suggested that when the mass accretion rate falls below a critical value , the density of the disk could become too low for radiative cooling to be effective. The trapped heat will expand the thin accretion disk into a pressure-supported thick disk with a very low radiative efficiency (see Quataert 2001; Narayan & McClintock 2008, for reviews). Such radiatively inefficient accretion flow (RIAF) models successfully explained the spectral energy distribution of a large number of LINER sources (Ptak et al. 2004; Nemmen et al. 2006, 2010).
Another way to assess the geometry of the accretion mode in AGN is to compare them to their less massive counterparts, X-ray binaries (XRBs). Shemmer et al. (2006) showed that the X-ray spectral slope, , of Seyfert 1 galaxies and quasars and the Eddington ratio, , are positively correlated, similar to XRBs in their high/soft state (see also Shemmer et al. 2008, and references therein). Such a behavior could be explained in an AGN accretion mode consistent with an optically thick geometrically thin accretion disk (Shakura & Sunyaev 1973). Gu & Cao (2009) performed a similar study on a broad sample of LINERs and low luminosity Seyfert galaxies. They found a significant anticorrelation between and the Eddington ratio for the local Seyfert galaxies in their sample analogous to XRBs in the low/hard state where a RIAF mode of accretion takes place. However, no strong correlation was found when considering only the LINER sources in their sample, owing, as suggested by the authors, to heterogeneous fitting models as they have collected their data from different studies. In a separate study, Constantin et al. (2009) analyzed the X-ray emission of a sample of 107 nearby galaxies including low luminosity Seyferts, LINERs, transitions (nuclei with spectra between Seyferts and LINERs), H II regions, and passive galaxies (lacking optical emission-line activity), none of which show broad-line components. Using a Spearman-rank correlation, the authors found an anticorrelation for their sample between and the . By considering each class separately, a spearman-rank test showed that the anticorrelation persists for the different objects, except for the low luminosity Seyfert galaxies.
Finally, broad optical emission lines, a characteristic property of classical Seyferts and quasars, are also found in nuclei of much lower luminosities. Thirty three sources out of the 221 nuclei classified as Seyfert, LINER, or transition objects in Ho et al. (1995) sample of nearby galaxies show definite detection of a broad H emission, 16 of those (17% of the total pure LINER sources) are LINERs (noted as LINER 1.9 in Ho et al. 1997b, LINER 1s hereinafter). In this paper, we are aiming for the study of the X-ray characteristics of these LINER 1s observed with the current generation of X-ray telescopes, XMM-Newton and Chandra. Such a sample insures the responsibility of accretion into a SMBH for the formation of the broad emission lines (given the early type class of this sample where outflows form massive stars and/or supernovae are not expected to be relevant), guarantees the non-existence of large obscuration, and enables X-ray comparison of this class with both XRBs and type 1 AGN. We introduce our sample in § 2, § 3 represents the observations and the data reduction. Temporal and spectral results are given in § 4. In § 5 we discuss the results in the context of LINER 1s-Seyfert-XRB connections, and a conclusion summarizing the main results is given in § 6. We report, in appendix A, some notes on the individual sources and in Appendix B we give spectral results to the surrounding sources around the centers of galaxies observed with Chandra. In the remainder of this paper, luminosities are calculated using the distances given in Table 1 derived with a Hubble constant km s-1 Mpc-1.
2 The sample
We selected objects classified as LINER 1.9 (LINER 1s) sources in Ho et al. (1997b) showing a definite detection of a broad H emission line. This implies the definite existence of an AGN at the center of all of the sixteen selected galaxies and its responsibility for the excitation of the detected optical emission lines.
| Galaxy Name | R.A. | Dec. | Hubble Type | Distancea | log()b |
|---|---|---|---|---|---|
| (Mpc) | () | ||||
| NGC-266 | 00 49 47.8 | +32 16 40 | SB(rs)ab | 62.4 | 8.44 |
| NGC-315 | 00 57 48.9 | +30 21 09 | E+: | 65.8 | 9.06 |
| NGC-2681 | 08 53 32.7 | +51 18 49 | (R’)SAB(rs)0/a | 17.2 | 6.78 |
| NGC-2787 | 09 19 18.5 | +69 12 12 | SB(r)0+ | 7.48 | 8.15 |
| NGC-3226 | 10 23 27.0 | +19 53 55 | E2:pec | 23.6 | 8.06 |
| NGC-3718 | 11 32 34.8 | +53 04 05 | SB(s)a pec | 17.0 | 7.61 |
| NGC 3998 | 11 57 56.1 | +55 27 13 | SA(r)0? | 14.1 | 9.07 |
| NGC 4143 | 12 09 36.0 | +42 32 03 | SAB(s)0 | 15.9 | 8.18 |
| NGC-4203 | 12 15 05.0 | +33 11 50 | SAB0-: | 15.1 | 7.73 |
| NGC-4278 | 12 20 06.8 | +29 16 51 | E1+ | 16.1 | 8.72 |
| NGC-4750 | 12 50 07.2 | +72 52 28 | (R)SA(rs)ab | 26.1 | 7.27 |
| NGC-4772 | 12 53 29.1 | +02 10 06 | SA(s)a | 16.3 | 7.46 |
| NGC-5005 | 13 10 56.2 | +37 03 33 | SAB(rs)bc | 21.3 | 7.79 |
We excluded three sources from the sample: NGC 3642, NGC 4636 and NGC 1052. NGC 3642 did not have any archived XMM-Newton or Chandra observations. As for NGC 4636, all of the X-ray archived observations were studied in extreme detail (Jones et al. 2002; Xu et al. 2002; Ohto et al. 2003; O’Sullivan et al. 2005; Baldi et al. 2009; Xu et al. 2010) and show a complicated spectrum that requires, for a good spectral parameters measurement, detailed imaging analysis and should be modeled including: sophisticated shock models, temperature and density gradients, and last but not least, steep abundance gradients in the core. Finally, the broad H emission line detected in the spectrum of NGC 1052 is attributed to polarization due to electron scattering within the opening cone of an obscuring torus (Barth et al. 1999). NGC 1052 was classified as an obscured AGN showing a large intrinsic absorption in the X-ray spectrum ( cm-2, Guainazzi & Antonelli 1999).
Table 1 shows the list of galaxies along with their corresponding right ascension and declination, Hubble type, distance (taken from Tonry et al. 2001, otherwise from Tully 1988), the mass of the black hole derived from the M- relation (Tremaine et al. 2002; Graham et al. 2010) where the velocity dispersion is taken from Ho et al. (2009). Multiple snapshot observations (exposure time ks) were excluded from the analysis either because of high background contamination (NGC 4143, obs.ID: 0150010201), low number of counts detected (NGC 2787, obs. ID: 388), or severe pile-up (NGC 4203 and NGC 4278, obs. IDs:397 and 398, respectively). The final sample consists of 13 LINER 1s with a total of 31 observations summarized in Table 2.
| Source Name | Satellite | Instrument | Start Date | Obs. ID | Net Exposure-time |
|---|---|---|---|---|---|
| (ks) | |||||
| NGC-266 | Chandra | ACIS-S | 2001 June 01 | 1610 | 2.0 |
| NGC-315 | Chandra | ACIS-S | 2000 October 08 | 855 | 4.7 |
| Chandra | ACIS-S | 2003 February 22 | 4156 | 55.0 | |
| XMM-Newton | EPIC | 2005 July 02 | 0305290201 | 13.2/23.2/23.2b | |
| NGC-2681 | Chandra | ACIS-S | 2001 January 30 | 2060 | 80.9 |
| Chandra | ACIS-S | 2001 May 02 | 2061a | 79.0 | |
| NGC-2787 | Chandra | ACIS-S | 2004 May 18 | 4689 | 30.8 |
| XMM-Newton | EPIC | 2004 October 10 | 0200250101 | 14.2/28.5/28.0b | |
| NGC-3226 | Chandra | ACIS-S | 1999 December 30 | 860 | 46.6 |
| Chandra | ACIS-S | 2001 march 23 | 1616 | 2.2 | |
| XMM-Newton | EPIC | 2002 March 29 | 0101040301 | 30.5/36.9/36.9 | |
| XMM-Newton | EPIC | 2008 January 09 | 0400270101 | 94.3b | |
| NGC-3718 | Chandra | ACIS-S | 2003 February 08 | 3993 | 4.9 |
| XMM-Newton | EPIC | 2004 May 02 | 0200430501a | 9.6 | |
| XMM-Newton | EPIC | 2004 November 04 | 0200431301a | 8.8 | |
| NGC 3998 | Chandra | ACIS-S | 2006 July 01 | 6781 | 13.6 |
| XMM-Newton | EPIC | 2001 May 09 | 0090020101 | 8.9/12.5/12.5 | |
| NGC 4143 | Chandra | ACIS-S | 2001 March 26 | 1617 | 2.5 |
| XMM-Newton | EPIC | 2003 November 22 | 0150010601a | 9.3/11.9/11.9 | |
| NGC-4203 | Chandra | ACIS-S | 2009 March 10 | 10535a | 41.6 |
| NGC-4278 | Chandra | ACIS-S | 2005 February 02 | 4741 | 37.5 |
| Chandra | ACIS-S | 2006 March 16 | 7077 | 110.3 | |
| Chandra | ACIS-S | 2006 July 25 | 7078 | 51.4 | |
| Chandra | ACIS-S | 2006 October 24 | 7079 | 105.1 | |
| Chandra | ACIS-S | 2007 February 20 | 7081 | 110.7 | |
| Chandra | ACIS-S | 2007 April 20 | 7080 | 55.8 | |
| XMM-Newton | EPIC | 2004 May 23 | 205010101 | 30.3/35.2/35.2 | |
| NGC-4750 | Chandra | ACIS-S | 2003 August 27 | 4020 | 4.9 |
| NGC-4772 | Chandra | ACIS-S | 2003 February 14 | 3999a | 4.7 |
| NGC-5005 | Chandra | ACIS-S | 2003 August 19 | 4021 | 4.9 |
| XMM-Newton | EPIC | 2002 December 12 | 0110930501 | 8.7/13.1/13.1 |
-
Notes.
aObservations reported for the first time for the LINER 1 nucleus study. bExposure time corrected for solar flare intervals.
3 X-ray observations and data reduction
3.1 Chandra observations
All of the LINER 1s in our sample have at least one Chandra observation. Snapshot observations with an exposure time less than 5 ks were performed for eight sources (NGC 266, NGC 315, NGC 3226, NGC 3718, NGC 4143, NGC 4750, NGC 4772, and NGC 5005). Seven sources have observations with a sufficient exposure time for a detailed temporal and spectral study (NGC 315, NGC 2681, NGC 2787, NGC 3226, NGC 3998, NGC 4203, and NGC 4278). All of the Chandra observations were obtained with the spectroscopic array (ACIS-S; Weisskopf et al. 2002) where the nucleus was placed on the aim point, except for NGC 3226, of the ACIS-S3 back-illuminated chip. They were taken in either Faint or Very Faint mode to increase their sensitivity. All of the observations are Chandra archival data obtained from chaser111http://cda.harvard.edu/chaser/Descriptions.. The log of the Chandra observations are listed in Table 2.
All Chandra observations were reduced and analyzed in a systematic, homogeneous way (as in Younes et al. 2010, hereinafter Y10) using the CIAO software package version 4.2, Chandra Calibration Database, CALDB, version 4.3.1, and the ACIS Extract (AE) software package version 3.175 222 The ACIS Extract software package and User’s Guide are available at http://www.astro.psu.edu/xray/acis/acis_analysis.html. (Broos et al. 2010). We started by using the level 1 event file produced by the Chandra X-ray Center (CXC) to suppress the position randomization applied by the CXC Standard Data Processing when creating a level 2 event file. We also corrected for the effects of charge-transfer inefficiency on event energies and grades. We filtered for bad event grades (only ASCA grades 0, 2, 3, 4 and 6 are accepted) and hot columns to take account of several potential issues such as cosmic rays and bad pixels. Good time intervals, supplied by the pipeline, were applied to the final products.
The LINER nucleus source position is determined after running a wavelet transform detection algorithm, the wavdetect program within the CIAO data analysis system (Freeman et al. 2002). This position is then given to the AE software that refines it, extract source photons, construct local backgrounds, extract source, and background spectra, compute redistribution matrix files (RMFs) and auxiliary response files (ARFs), by spawning the mkarf and mkacisrmf routines of CIAO, and perform spectral grouping and fitting.
Source events are extracted around the source centroid, inside a polygonal shape of the local PSF, generated by MARX333http://space.mit.edu/ASC/MARX/ at the energy 1.497 keV using the ae_make_psf tool implemented in AE. Background region is defined following the AE procedure. The background region is an annular region centered on the source position where the inner radius delimit 1.1 99% encircled energy radius and the outer radius is set such that the background includes between 100 counts and 200 counts (depending on the brightness of the source). This background is obtained from a special image where all events within the % PSF circles of all the sources in the field were excluded (swiss cheese image). Background was modeled for snapshot observations.
Piled-up observations were accounted for by excluding the core of the PSF (see Y10 for more details). We use the tool dmextract, called by the AE software, to create spectra over the energy range 0.5–8 keV. We used the tool ae_group_spectrum implemented in AE to group the spectra. Channels between 0.5 and 8 keV are grouped to have a three sigma () signal to noise ratio, which corresponds to a minimum of 20 counts per bin, to enable the use of the statistics in the spectral analysis. The cash statistic (C-stat) is used to derive spectral parameters for snapshot Chandra observations with the background being modeled with the cplinear background model developed by Broos et al. (2010). The background model is arbitrarily chosen to consist of continuous piecewise-linear (cplinear) functions with 2 to 10 vertexes. The model has 2 to 10 parameters representing the X-ray fluxes at the different vertexes. These vertexes are placed on the energy scale so that they divide the energy range into intervals with approximately equal numbers of observed counts in the background spectrum (0.1 to 10 keV). Vertex energies are chosen to coincide with the energies of actual events in the background which helps to prevent the vertex flux from being driven to the hard limit of zero during the fitting process (see § 7.5 of Broos et al. 2010).
3.2 XMM-Newton observations
The log of the XMM-Newton observations is listed in Table 2. Eight sources were observed at least once with XMM-Newton (NGC 315, NGC 2787, NGC 3226, NGC 3718, NGC 3998, NGC 4143, NGC 4278, and NGC 5005) and two have multiple observations (NGC 3226 and NGC 3718). In all of the observations, the EPIC-pn (Strüder et al. 2001) and MOS (Turner et al. 2001) cameras were operated in Imaging, Prime Full Frame or Large Window Mode (except for the long NGC 3226 observation, where MOS cameras were operating in Small Window Mode444NGC 3226 is off axis during the long observation and hence is not detected with the MOS cameras when operating in a Small Window Mode) using the thin or medium filter. The Reflection Grating Spectra show only few counts for all the different observations and therefore they were not included in our analysis. We did not make use of the optical/UV data taken with the optical/UV monitor (OM) instrument (Mason et al. 2001) since this paper concentrates on the X-ray characteristics of this sample. A multiwavelength study of our sample will be treated in a forthcoming paper. All data products were obtained from the XMM-Newton Science Archive (XSA)555http://xmm.esac.esa.int/xsa/index.shtml and reduced using the Science Analysis System (SAS) version 9.0. Data are selected using event patterns 0–4 and 0–12 for pn and MOS, respectively, during only good X-ray events (“FLAG0”). None of the EPIC observations were affected by pile-up, although severe intervals of enhanced solar activity, where the background count rate even exceeds the source count rate, were present during several observations (NGC 315, NGC2787, NGC 3226). In these cases, we reduced the background to by excluding the high background intervals which reduces the observation time usable for spectral analysis, sometimes to less than 30 of the raw exposure time (NGC 315).
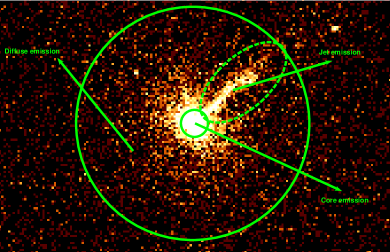
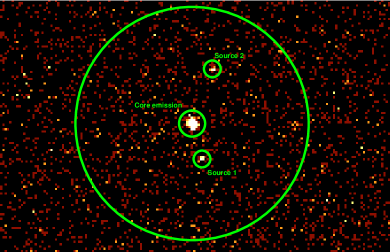
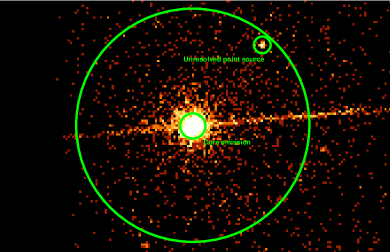
XMM-Newton source events of all of the LINER 1s in our sample were extracted from a circle centered at the nucleus using two different radii of 10′′ and 25′′666The lower 10′′ limit was taken so to encircle at least 50% of the EPIC XMM-Newton PSF.. We compared light curves and spectra of both extraction regions to check if any of the sources (jet emission, diffuse emission, and/or unresolved point-like sources) detected in the Chandra image between 10′′ and 25′′ around the nucleus contaminate the XMM-Newton nucleus emission (see Appendix B and online Fig. 1–4). No change is seen in the light curves, and the fit parameters of the two extracted spectra were consistent, within the error bars. Therefore, and to achieve better statistics and better constrain fit parameters, source events of all of the LINER 1s in our sample observed with XMM-Newton were taken from the 25′′-radius circle centered on the nucleus. We added the spectral contribution of the different sources (jet emission, diffuse emission, and/or unresolved point-like sources), derived from the Chandra observation and detected in a 25′′-radius circle around the nucleus (see Appendix B for more details), to the spectral model used to fit the XMM-Newton spectrum. The particular case of NGC 4278 is discussed in detail in Y10. Background events are extracted from a source–free circle with a radius twice of the source on the same CCD. We generated response matrix files using the SAS task rmfgen, while ancillary response files were generated using the SAS task arfgen. The EPIC spectra were created in the energy range 0.5–10 keV to enable flux and model–parameter comparison with Chandra spectra. They were grouped to have a signal to noise ratio of 3 with a minimum of 20 counts per bin to allow the use of the statistic.
1
2

3
4
4 Results
4.1 Light curves and hardness ratios
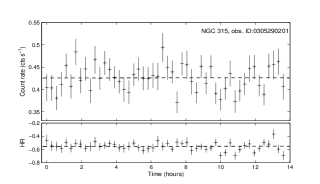
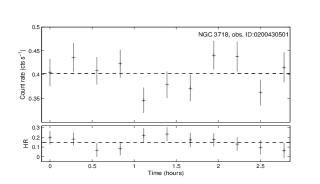
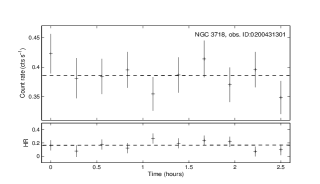
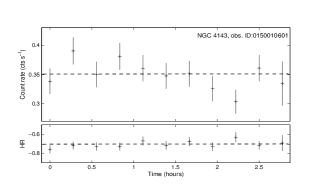
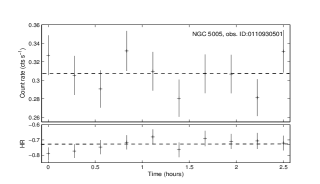
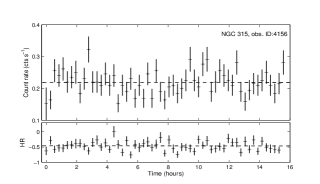
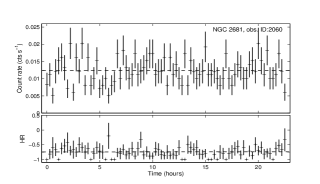
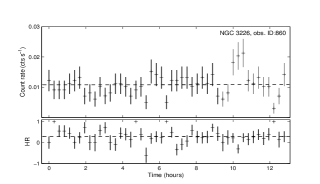
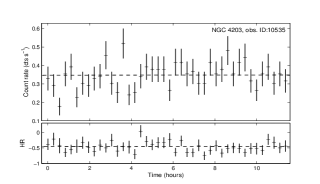
Temporal analysis was only done for long exposure observations, not including snapshot Chandra observations. Light curves and corresponding hardness ratios, defined as , where is the count rate in the soft 0.5-2 keV band and is the count rate in the hard 2-10 keV band, were extracted for all of the long observations. We corrected the net count rate of the piled-up sources for the excluded fraction of the PSF. Chandra and XMM-Newton light curves were all binned with a time bin size of 1 ks for a reliable rms variability analysis.
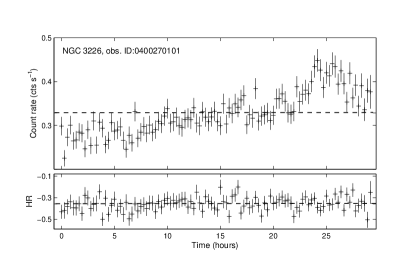
We first conducted a Kolmogorov-Smirnov, K-S, test to examine any potential variability within each observation. Based on this test, we do not find short time-scale (hours to days) variability in 5/10 sources (NGC 315, NGC 2681, NGC 3718, NGC 3998, and NGC 5005) with a K-S test probability 10 that the nuclear emission originates from a constant source. Three sources (NGC 2787, NGC 4143, and NGC 4203) indicate a possible variability with a K-S test probability between 4% and 2% that the nuclear emission originates from a constant source. Two XMM-Newton observations of two different sources exhibit significant short time-scale variability, both already reported in the literature, NGC 4278 (obs. ID: 205010101, Y10) and NGC 3226 (obs.ID: 0400270101, Binder et al. 2009), where the K-S test gives a probability less than that the core emission is originating from a constant source. NGC 4278 shows an increase at the beginning of the observation of 10 on a time-scale of 1.5 hour, the emission remains constant for the rest of the observation following that hint of variability. As for NGC 3226, variability is clear through the whole observation where a total increase of 60 is detected between the beginning and the end of the 100 ks observation (Binder et al. 2009). XMM-Newton light curve of NGC 3226 is shown in Fig. 5 and the XMM-Newton and Chandra light curves of the other sources are given in online Fig. 6 and Fig. 7.
6


7


| Galaxy Name | Exposure Timea | Exposure timea | ||
|---|---|---|---|---|
| XMM-Newton | Chandra | |||
| NGC-315 | 49.7 | 55.0 | ||
| NGC-2681 | 159.9 | |||
| NGC-2787 | 37.1 | 30.8 | ||
| NGC-3226 | 94.3 | 46.6 | ||
| NGC-3718 | 18.4 | |||
| NGC 3998 | 8.9 | 13.6 | ||
| NGC 4143 | 9.3 | |||
| NGC-4203 | 41.6 | |||
| NGC-4278 | 30.3 | 470.8 | ||
| NGC-5005 | 8.7 | |||
-
Notes.
aThe exposure times in ks used to calculate the value of . bValue corresponding to only the longest observation of NGC 3226. Including the other XMM-Newton observation would result in a upper limit of 0.013.
To check more accurately any intrinsic variability amplitude from the different sources, we calculated the normalized excess variance (Nandra et al. 1997a) for all of the long observations with the following expression:
| (1) |
where is the number of bins in a given light curve, and are the count rate and uncertainty of each bin, respectively, and is the arithmetic mean of the counting rates. To enable comparison between the different light curves, the bin size and the light curve segment duration should be taken equally. For that purpose, we first decided to use light curve segments of 20 ks, as usually done for luminous Seyfert galaxies, splitting any longer observations into multiple ones. That limited our sample to 6 sources observed with Chandra and 5 observed with XMM-Newton, not enough to draw any safe conclusions. Therefore, and owing to the heterogeneous sampling of the observations for this type of study, we decided to use the whole corrected exposure time of all of the long observations. The mean of the is taken for every source with multiple Chandra or XMM-Newton observations. The time bin size choice of 1 ks for all of the observations was taken to have a good signal to noise ratio with at least 20 counts in each bin and an acceptable number of bins in each light curve.
Estimating the error on the could be a tricky task. The variability in an AGN light curve depends, on one hand, on the measurement errors of the data (e.g. Poisson noise) and, on the other hand, on the stochastic nature of the process underlying AGN variability (e.g. red noise, see Vaughan et al. 2003, for a detailed discussion on this issue); even if a source is not intrinsically variable the mean and the variance of different light curves based on observations performed at different times will not be identical. We estimated error due to Poisson noise using the Vaughan et al. (2003) equation
| (2) |
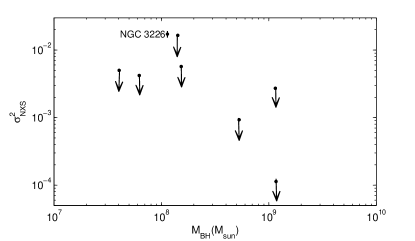
The uncertainty owing to the red noise process has been presented by Vaughan et al. (2003) to depend on the power-spectrum shape of the source which we do not know a priori. Therefore, O’Neill et al. (2005) estimated the error on the red noise process directly from the data. Our observations are not well sampled to use O’Neill et al. (2005) method to determine any error due to the stochastic nature of the AGN X-ray variability. The error on shown in equation 2 was also used to estimate upper limits to the excess variance in the case of non-variability detection whenever is negative or consistent with zero. Only one object, NGC 3226, in our sample shows a clear short time-scale variability during the longest 100 ks observation with (comparable to the value of 0.014 found by Binder et al. 2009). Upper limits were obtained for the rest of the sample. Table 3 and Fig. 8 summarizes the results that are discussed in § 5.1.
4.2 X-ray spectral results
The spectral analysis was performed using XSPEC (Arnaud 1996) version 12.6.0. The photo-electric cross sections and the solar abundances of Wilms et al. (2000) are used throughout to account for absorption by neutral gas. An absorbed Galactic column density derived for every single source from Kalberla et al. (2005) (obtained with the W3NH tool777http://heasarc.gsfc.nasa.gov/cgi-bin/Tools/w3nh/w3nh.pl) was applied to the different spectral models. Spectral uncertainties are given using of 2.71, corresponding to 90% confidence for one interesting parameter, and to 95% confidence for upper limits.
4.2.1 snapshot observations
We began our spectral analysis with the study of the Chandra snapshot observations. Table 4 gives the best fit parameters to the snapshot observations of our sample of LINER 1s. Complicated models, like partial covering and/or two power-law components could not be tested due to the low number of counts. A power-law modified by Galactic absorption gave a good fit in the case of NGC 266 and NGC 4143. An additional intrinsic neutral absorption was needed in the remainder of the cases. The photon indices vary between for the hardest spectra to for the softest ones with a mean value of about 1.7. The hydrogen column density of the intrinsic absorber had an upper limit of cm-2 in the case of NGC 4750 and NGC 5005. A value consistent with cm-2 was derived for the rest of the snapshot observations. In one case, NGC 3718, we find a somewhat larger column density with in the order of cm-2. For NGC 5005, a thermal component (mekal model, Mewe et al. 1985, using the abundance table of Wilms et al. 2000) with a keV temperature, was included in the model to take account for some low energy features, most likely due to diffuse emission from hot gas. In order to rigorously confirm the validity of our best fit spectral-parameter values derived using the C-stat and a modeled background, we compared our results to the results derived from fits applying the statistics to all of the snapshots observations. Spectral parameters derived using the C-stat were all in agreement, within the error bars, with the results derived using the statistics; with smaller deviation from the central value of one interesting parameter. We decided, as a consequence, to use the C-stat fits to calculate model fluxes in the soft, 0.5-2 keV, and in the hard, 2-10 keV, bands. Table 6 gives the corresponding 0.5-2 keV and 2-10 keV observed fluxes and corrected luminosities.
| Galaxy Name | Obs. ID | Nh | Pl Norm. at 1 keV | kT | EM(a) | |
|---|---|---|---|---|---|---|
| ( cm-2) | ( Photons keV-1 cm-2 s-1) | (keV) | (1062 cm-3) | |||
| NGC 266 | 1610 | () | 1.4 [0.9-1.9] | 2 [1-3] | () | () |
| NGC 315 | 855 | 20 [10-30] | 1.3 [1.1-1.5] | 13 [10-16] | () | () |
| NGC 3226 | 1616 | 74 [47-105] | 1.7 [1.3-2.1] | 22 [15-34] | () | () |
| NGC 3718 | 3993 | 114 [97-132] | 1.5 [1.4-1.7] | 66 [53-81] | () | () |
| NGC 4143 | 1617 | () | 1.9 [1.6-2.1] | 7.2 [6.6-8.3] | () | () |
| NGC 4750 | 4020 | 31 | 1.8 [1.4-2.3] | 5 [3-8] | () | () |
| NGC 4772 | 3999 | 46 [24-53] | 1.69 [1.29-1.74] | 7 [4-11] | () | () |
| NGC 5005 | 4021 | 39 | 2.1 [1.4-2.8] | 5 [3-11] | 0.8 [0.6-1.1] | 3 [1-4] |
-
Notes.
(a)The emission measure (EM) of the mekal model, EM=nenHdV.
4.2.2 Long-exposure observations
| Galaxy Name | Obs. ID | Nh | Pl Norm. at 1 keV | kT | EM(a) | d.o.f. | ||
| ( cm-2) | ( Photons keV-1 cm-2 s-1) | (keV) | (1062 cm-3) | |||||
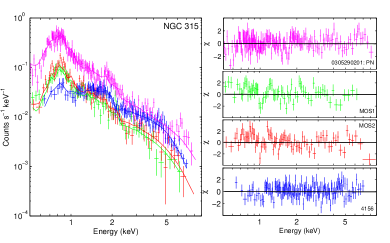
| NGC 315 | 4156 | 10 [9-13] | 1.5 [1.4-1.6] | 18 [16-21] | 0.55 [0.47-0.59] | 15 [13-17] | 1.13 | 465 |
| 0305290201 | L. | 2.1 [1.9-2.2] | 20 [17-25] | L. | L. | |||
| NGC 2681 | 2060 | 29 | 1.5 [1.2-1.8] | 0.6 [0.5-0.8] | 0.67 [0.63-0.70] | 0.4 [0.3-0.5] | 0.90 | 74 |
| 2061 | L. | L. | L. | L. | L. | |||
| NGC 2787 | 4689 | 16 [8-24] | 2.4 [2.1-2.6] | 3 [2-4] | () | () | 1.12 | 118 |
| 0200250101 | L. | L. | 4 [3-5] | () | () | |||
| NGC 3226 | 860 | 25 [60] | 1.7 [1.5-2.0] | 13 [9-19] | () | () | 0.98 | 467 |
| 0101040301 | 89 [82-96] | 1.8 [1.7-1.9] | 25 [23-27] | () | () | |||
| 0400270101 | 42 [39-44] | 2.05 [2.0-2.1] | 27 [26-28] | () | () | |||
| NGC 3718 | 0200430501 | 138 [121-155] | 1.8 [1.7-1.9] | 57 [48-66] | () | () | 0.88 | 122 |
| 0200431301 | L. | L. | 47 [40-55] | () | () | |||
| NGC 3998 | 6781 | 3 [2-4] | 2.1 [2.0-2.2] | 282 [267-298] | () | () | 1.10 | 590 |
| 0090020101 | L. | 1.84 [1.82-1.85] | 323 [318-328] | () | () | |||
| NGC 4143 | 0150010601 | 6 [3-9] | 2.2 [2.1-2.3] | 17 [15-19] | () | () | 0.98 | 118 |
| NGC 4203 | 10535 | () | 2.3 [2.2-2.4] | 83 [78-89] | () | () | 0.83 | 51 |
| NGC 4278 | 4741 | 6.78 | 2.1 [2.0-2.3] | 43 [39-47] | 0.62 [0.58-0.66] | 2.6 [2.3-3.0] | 0.93 | 310 |
| 7077 | L. | 2.3 [2.2-2.4] | 18 [17-20] | L. | L. | |||
| 7078 | L. | 2.3 [2.2-2.5] | 42 [39-46] | L. | L. | |||
| 7079 | L. | 2.4 [2.3-2.5] | 38 [35-41] | L. | L. | |||
| 7080 | L. | 2.0 [1.8-2.2] | 11 [10-13] | L. | L. | |||
| 7081 | L. | 2.1 [2.0-2.3] | 12.5 [11.4-12.9] | L. | L. | |||
| 0205010101 | 3.8[3.1 4.6] | 2.05 [2.03-2.07] | 81 [79-82] | () | () | 1.01 | 487 | |
| NGC 5005 | 0110930501 | 9 [2-18] | 1.7 [1.5-1.8] | 8 [6-9] | 0.64 [0.61-0.67] | 5.2 [4.7-5.7] | 1.2 | 107 |
-
Notes.
(L.) represents a linked paramter in the fit. (a)The emission measure (EM) of the mekal model, EM=nenHdV.
| Galaxy Name | Obs. ID | 0.5-2 keV Flux | 2-10 keV Flux | Corr. 0.5-2 keV Lum. | Corr. 2-10 keV Lum. | Pla | Log(/) |
|---|---|---|---|---|---|---|---|
| (Logarithmic scale; erg s-1 cm-2) | (1041 erg s-1) | % | |||||
| NGC 266 | 1610 | -13.40 [-13.50 -13.30] | -12.90 [-13.10 -12.80] | 0.23 [0.14 0.29] | 0.59 [0.37 0.74] | 100 | -5.77 |
| NGC 315 | 855 | -12.74 [-12.78 -12.71] | -11.99 [-12.03 -11.95] | 1.56 [1.42 1.71] | 5.42 [4.94 5.94] | 100 | -5.42 |
| 4156 | -12.80 [-12.82 -12.78] | -12.04 [-12.05 -12.02] | 2.42 [2.36 2.53] | 5.06 [4.83 5.18] | 96 | -5.45 | |
| 0305290201 | -12.80 [-12.82 -12.78] | -12.37 [-12.39 -12.35] | 2.42 [2.36 2.53] | 2.37 [2.26 2.48] | 94 | -5.78 | |
| NGC 2681 | 2060 | -13.56 [-13.58 -13.55] | -13.47 [-13.49 -13.45] | 0.011 [0.010 0.012] | 0.012 [0.011 0.013] | 73 | -5.80 |
| 2061 | -13.56 [-13.58 -13.55] | -13.47 [-13.49 -13.45] | 0.011 [0.010 0.012] | 0.012 [0.011 0.013] | 73 | -5.80 | |
| NGC 2787 | 4689 | -13.30 [-13.33 -13.26] | -13.28 [-13.32 -13.25] | 0.0054 [0.0049 0.0058] | 0.004 [0.002 0.007] | 100 | -7.70 |
| 0200250101 | -13.34 [-13.38 -13.31] | -13.33 [-13.37 -13.29] | 0.0048 [0.0044 0.0052] | 0.0032 [0.0029 0.0034] | 100 | -7.74 | |
| NGC 3226 | 1616 | -12.76 [-12.81 -12.71] | -12.07 [-12.12 -12.02] | 0.32 [0.28 0.36] | 0.59 [0.51 0.66] | 100 | -5.38 |
| 860 | -12.76 [-12.80 -12.73] | -12.32 [-12.36 -12.29] | 0.19 [0.17 0.20] | 0.33 [0.30 0.35] | 100 | -5.64 | |
| 0101040301 | -12.77 [-12.77 -12.76] | -12.07 [-12.07 -12.06] | 0.37 [0.36 0.38] | 0.61 [0.60 0.62] | 100 | -5.37 | |
| 0400270101 | -12.56 [-12.57 -12.56] | -12.21 [-12.22 -12.21] | 0.39 [0.38 0.40] | 0.42 [0.41 0.43] | 100 | -5.53 | |
| NGC 3718 | 3993 | -12.40 [-12.41 -12.37] | -11.50 [-11.52 -11.48] | 0.50 [0.48 0.54] | 1.15 [1.10 1.23] | 100 | -4.64 |
| 0200430501 | -12.58 [-12.59 -12.56] | -11.76 [-11.78 -11.74] | 0.44 [0.42 0.45] | 0.66 [0.63 0.68] | 100 | -4.88 | |
| 0200431301 | -12.65 [-12.68 -12.63] | -11.84 [-11.86 -11.82] | 0.36 [0.34 0.38] | 0.55 [0.51 0.58] | 100 | -4.96 | |
| NGC 3998 | 6781 | -11.25 [-11.26 -11.23] | -11.19 [-11.21 -11.17] | 1.47 [1.44 1.54] | 1.54 [1.47 1.61] | 100 | -5.98 |
| 0090020101 | -11.183 [-11.186 -11.180] | -10.975 [-10.978 -10.973] | 1.70 [1.69 1.71] | 2.53 [2.51 2.54] | 100 | -5.76 | |
| NGC 4143 | 1617 | -12.81 [-12.87 -12.75] | -12.63 [-12.70 -12.57] | 0.05 [0.04 0.06] | 0.07 [0.06 0.08] | 100 | -6.43 |
| 0150010601 | -12.53 [-12.54 -12.52] | -12.51 [-12.52 -12.49] | 0.112 [0.109 0.115] | 0.096 [0.092 0.098] | 100 | -6.30 | |
| NGC 4203 | 10535 | -11.75 [-11.77 -11.72] | -11.86 [-11.89 -11.84] | 0.51 [0.48 0.53] | 0.38 [0.35 0.40] | 100 | -5.25 |
| NGC 4278 | 4741 | -11.99 [-12.02 -11.97] | -12.05 [-12.08 -12.02] | 0.33 [0.31 0.35] | 0.28 [0.26 0.30] | 94 | -6.37 |
| 7077 | -12.30 [-12.32 -12.28] | -12.50 [-12.52 -12.48] | 0.16 [0.15 0.17] | 0.10 [0.09 0.11] | 83 | -6.83 | |
| 7078 | -12.00 [-12.02 -11.97] | -12.18 [-12.21 -12.16] | 0.33 [0.31 0.35] | 0.20 [0.19 0.21] | 93 | -6.51 | |
| 7079 | -12.04 [-12.06 -12.02] | -12.25 [-12.27 -12.23] | 0.30 [0.29 0.32] | 0.17 [0.16 0.18] | 90 | -6.58 | |
| 7080 | -12.46 [-12.49 -12.44] | -12.56 [-12.59 -12.54] | 0.11 [0.10 0.12] | 0.08 [0.07 0.09] | 80 | -6.89 | |
| 7081 | -12.42 [-12.44 -12.40] | -12.57 [-12.59 -12.55] | 0.12 [0.11 0.13] | 0.08 [0.07 0.09] | 81 | -6.90 | |
| 0205010101 | -11.808 [-11.812 -11.804] | -11.718 [-11.722 -11.714] | 0.55 [0.54 0.56] | 0.60 [0.59 0.61] | 100 | -6.04 | |
| NGC 4750 | 4020 | -13.14 [-13.21 -13.07] | -12.84 [-12.92 -12.78] | 0.08 [0.07 0.09] | 0.12 [0.10 0.14] | 100 | -5.30 |
| NGC 4772 | 3999 | -13.25 [-13.33 -13.17] | -12.67 [-12.76 -12.59] | 0.04 [0.03 0.05] | 0.07 [0.06 0.08] | 100 | -5.72 |
| NGC 5005 | 4021 | -12.86 [-12.92 -12.81] | -12.95 [-13.01 -12.90] | 0.08 [0.06 0.11] | 0.06 [0.05 0.07] | 72 | -6.11 |
| 0110930501 | -12.55 [-12.57 -12.54] | -12.49 [-12.51 -12.48] | 0.17 [0.16 0.18] | 0.18 [0.17 0.19] | 76 | -5.64 | |
-
Notes.
(a)The power-law component fraction to the 0.5-10 keV corrected luminosity.
10


We then turned to the analysis of observations with relatively long exposure times. We started with a simple absorbed power-law fit to each of the spectra of the different sources, separately. The fits were acceptable for 6/10 sources but residuals at energies less than 2 keV persisted in the other 4 sources (NGC 315, NGC 2681, NGC 4278, and NGC 5005), suggesting the presence of diffuse hot gas.
In order to have a better signal to noise ratio and photon statistics, we decided to fit the different Chandra and/or XMM-Newton spectra of each source simultaneously (the normalizations of the different models in a fit were left free between the different EPIC instruments to take care of any potential cross calibration uncertainties). Simultaneous fitting routines of different observations performed at different times is done for the first time for any sample of LINER sources. For this purpose, whenever a source is observed with both Chandra and XMM-Newton, we carried out careful imaging analysis of the Chandra observations to disentangle the different components (diffuse emission, LMXBs, and/or jet emission) that are blended in one point-like source in the XMM-Newton extraction region of 25′′-radius circle (see Appendix B and online Fig. 1–4). These components, that we assume non-variable, are included in the simultaneous Chandra/XMM-Newton fit. We do not expect diffuse hot gas to vary on a time-scale of a few years (Fabbiano 1989), although off-nuclear point-like sources and jet X-ray emission could exhibit variation on such time-scales (e.g., Harris 2003). We present in Appendix B the surrounding medium around the different LINER 1s that are observed with both Chandra and XMM-Newton, and we give spectral results to the different components.
We tested multiple models on the data in order to determine the mechanism responsible for the observed X-ray spectra, noticeably: (1) a simple absorbed power-law, (2) same as (1) but including a thermal mekal component to take account of any diffuse hot gas features in the soft band, (3) two power-law components with different photon index values with one representing the hard 2-10 keV emission and the other representing a possible 0.5-2 keV soft excess emission commonly seen in the nuclei of luminous galaxies(e.g., Porquet et al. 2004). We investigated spectral variability in a source by permitting one spectral parameter of a given fit to vary independently between different observations. We then used the F-test to evaluate the improvement in the fit where a 99% probability for an improvement to occur by chance is considered valid. The case for NGC 4278 is already analyzed in Y10 and best fit spectral parameters and fluxes are taken from Y10.
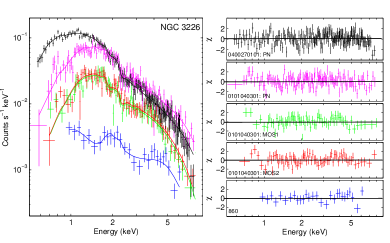
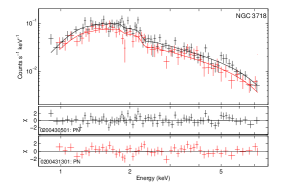
We find that 6/10 sources are best fit with model (1) with no additional need for any thermal or two power-law components (NGC 2787, NGC 3226, NGC 3718, NGC 3998, NGC 4143, and NGC 4203). The rest of the sources were best fit with model (2) showing features at low energies below 2 keV, indicating emission from diffuse hot gas (NGC 315, NGC 2681, NGC 4278, and NGC 5005). Model (3) did not improve the quality of the fit in any of the cases, giving worse fits at times. We found that the intrinsic hydrogen column density varies significantly in NGC 3226 decreasing from cm-2 to cm-2. This is clearly seen in the lower panels of Fig. 9 where the soft part of the spectrum during the short XMM-Newton observation is much more absorbed compared to the long observation. Additionally, the power-law photon index varies in seven sources (NGC 315, NGC 3226, NGC 3718, NGC 3998, NGC 4143, NGC 4278, and NGC 5005) with the most drastic change being the one observed in NGC 315 where increased from during the Chandra observation to during the XMM-Newton one (upper panels of Fig. 9). This increase is accompanied by a decrease in the 2-10 keV flux from to erg s-1. This behavior is typical of X-ray emission originating in a RIAF structure, which is the accretion flow believed to exist at the center of NGC 315 (Wu et al. 2007), where the Eddington ratio, which is proportional to L, is inveresly proportional to the photon index (Gu & Cao 2009). Best fit models and residuals of the other LINER 1s in our sample are shown in online Fig. 10.
The photon indicies we derived for all of the sources in our sample observed with a relatively long exposure time varied between and with a mean value of 2.0. Intrinsic column density covered two orders of magnitude, with varying between cm-2 for unabsorbed sources, and up to cm-2 for the only mildly absorbed source NGC 3718. The thermal component had a temperature mean value of 0.63 keV, consistent with all LINER-type sources embedded in diffuse emission (Flohic et al. 2006). Table 5 gives the best fit model parameters for our sample of LINER 1s with a relatively long exposure time, and Table 6 gives the 0.5-2 keV and 2-10 keV observed fluxes and corrected luminosities, as well as the corresponding “Eddington ratios”, . The hard, 2-10 keV, luminosity spans three orders of magnitude from 3.2 erg s-1 to 5.4 erg s-1 which resulted in a range from to which is at least one to two orders of magnitude smaller than seen in luminous AGN (e.g.: Porquet et al. 2004; Nandra et al. 2007).


| Correlations | Coefficient | Probability (%) | Coefficient | Probability (%) |
|---|---|---|---|---|
| Spearman-rank | Bevington & Robinson (2003) | |||
| -0.62 | 99.9 | -0.65 | 99.9 | |
| 0.61 | 99.9 | 0.65 | 99.9 | |
| 0.43 | 99.0 | 0.70 | 99.9 | |
| -0.41 | 97.9 | -0.11 | 72 | |
| 0.33 | 90 | 0.26 | 90 | |
We looked for any sign of narrow Fe K emission line at 6.4 keV in the EPIC-pn XMM-Newton observations of our sample of LINER 1s. None of the observations have clear evidence for the line. Good signal to noise ratio around 6 keV is only found in the spectra of 4 sources that enable the estimate of an upper limit: 112 eV for NGC 3718 (obs.ID: 0200430501), 38 eV for NGC 3226 (obs.ID: 0400270101), 33 eV for NGC 3998, and 22 eV for NGC 4278. Even though a hint for an Fe K emission line around 6.4 keV seems to be apparent in the EPIC-pn spectrum of NGC 315, the addition of a gaussian line to the best fit model does not improve the quality of the fit with an F-test probability of 60% for an improvement to occur by chance.
4.3 X-ray correlations
We looked for any correlations between the X-ray properties, mainly the photon index and the 2-10 keV luminosity, and the LINER 1s intrinsic parameters, black hole mass and the ratio , which could be directly linked to the Eddington ratio considering that (, Ho 2009). We investigated the validity of a correlation by fitting the data with a least square fit to a straight line using the equations of York (1966) and by minimizing the weighted residuals in both parameters and . We assessed the goodness of the fit following the criteria explained in Bevington & Robinson (2003). If a dependent variable is correlated to a variable with a line slope , then the reciprocity in fitting as a function of should lead to a line with a slope . Therefore, the linear correlation coefficient , , varies between 0, when there is no correlation, to , when there is complete correlation. This correlation coefficient cannot be used directly to indicate the degree of correlation, instead a probability should be calculated that a random sample of N uncorrelated data points would yield to a linear-correlation coefficient as large as or larger than .
We found a strong anticorrelation between the photon index , and , for our sample. The fit of these two quantities with a least square fit to a straight line resulted in the following equation:
| (3) |
with a linear-correlation coefficient and a probability greater than 99.99% that and yield a linear-correlation coefficient . Additionally, we performed a spearman-rank correlation between and and found that these two quantities are correlated with a probability greater than 99.99% and a spearman-rank correlation coefficient of -0.62. Figure 11 shows the anticorrelation between and , and the least square best fit to a straight line. Snapshots, Chandra, and XMM-Newton observations are shown in different colours.
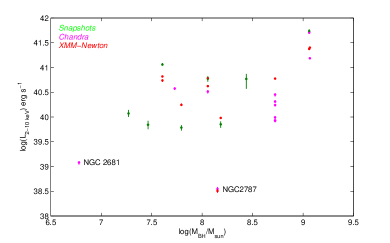
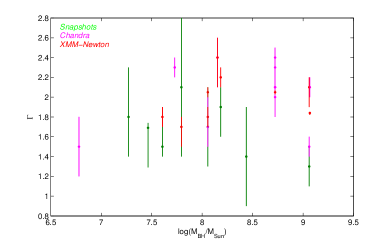
Using the same criteria as above, we found a positive correlation between the hard X-ray luminosity, , and , with a linear correlation coefficient and a probability that these two quantities would yield to a linear-correlation coefficient as large as or larger than . Another strong positive correlation we found is the increase of the 2-10 keV luminosity with increasing BH mass with and a probability greater than 99.9. We did not find any strong dependence of the spectral slope or on the BH mass with correlation coefficients of 0.26 and -0.11 respectively and a probability that these quantities are correlated. To strengthen our conclusions we performed a spearman-rank test on the four different correlations and the results are shown in Table 7. Our previous results are in agreement with the spearman-rank test, except for a weak anticorrelation emerging between and the BH mass not seen using our principal correlation test. Fig. 12 shows the dependence of the fit parameters to the LINER 1s parameters. We discuss these results in § 5.4 and § 5.5.
5 Discussion
In the following discussion, we are comparing X-ray timing and spectral results of our sample of LINER 1s to other results derived on broad samples of LINERs (including type 1 and type 2 LINERs, and transition nucleus) and/or low luminosity AGN. We compare our findings, X-ray variability and absence of an Fe K emission line, to type 1 luminous AGN (Seyfert galaxies and quasars). We discuss correlations between the fit parameters, and , and the intrinsic parameters of our LINER 1 sample, and , and compare our results to luminous AGN and XRBs in order to find out the accretion mechanism in LINER 1s.
5.1 X-ray variability
One of the most important characteristics of AGN is the X-ray flux-variability on different time-scales. An anti-correlation between the variability amplitude, characterized by the normalized excess variance , with both the 2-10 keV luminosity and the black hole mass has been established for a considerable number of AGN (Nandra et al. 1997a; Turner et al. 1999; Papadakis 2004; O’Neill et al. 2005). Such variability on time-scales of less than a day was never detected for LINER sources in the past, with observations taken with low spatial resolution telescopes, e.g.:ASCA, (Komossa et al. 1999; Terashima et al. 2002). Ptak et al. (1998) showed that LINER and low luminosity AGN sources do not follow the same anticorrelation of luminous AGN showing stronger variability with decreasing luminosity. The authors attributed the non-detection of short time-scale variability in LINERs and low luminosity AGN to a bigger X-ray emitting region, e.g. RIAF, compared to luminous AGN.
Three sources in our sample of LINER 1s (NGC 2787, NGC 4143, and NGC 4203) show hint of inter-day variability with a K-S test probability between 4% and 2% that the X-ray emission originates from a constant source. Two sources in our sample exhibit significant short time-scale variability, both already reported in the literature (NGC 4278: Y10 and NGC 3226: Binder et al. 2009).
NGC 4278 exhibited a short time-scale variability ( h) during the XMM-Newton observation where the X-ray flux level was highest (compared to the other 6 Chandra observations, where no short time-scale variability was detected). During this 1.5 h time-scale, the flux of NGC 4278 increased by 10%. Y10 proposed that this variability could be the result of a more compact X-ray emission region, e.g. an accretion disk truncated at a lower radius during the XMM-Newton observation compared to the Chandra observations.
On the other hand, NGC 3226 (Binder et al. 2009), which is the only source observed for 100 ks with XMM-Newton, shows significant flux variability during the entire observation, increasing almost continuously. Binder et al. (2009) reported a , comparable to 0.02 reported here, which is a variability amplitude similar to the one observed in more luminous AGN, but on shorter time-scales (O’Neill et al. 2005). Binder et al. (2009), assuming a BH mass of M⊙ and an Eddington ratio of , predicted, using McHardy et al. (2006) relation, a variability amplitude of on a one day time-scale. The discrepancy between the observed and the predicted value of is the fact that the McHardy et al. (2006) relation is derived for objects in a high/soft state. As we show in paragraph 5.4, LINER sources, in contrast to luminous Seyfert galaxies, could be in a low/hard state similar to XRBs in their low/hard state. The derived for the NGC 3226 longest observation, where the variability was observed, did not increase compared to the other three observations, in fact it decreased from 4.27 to 2.95. Therefore, the significant variability seen during the ks observation cannot be attributed to an increase in (as also denied by Binder et al. 2009). Markowitz & Uttley (2005) showed that the PSD break time-scale of the LLAGN NGC 4258 is greater than 4.5 days at % confidence level. The authors suggested that LLAGN, like XRBs in their low/hard state, might have longer break time-scales compared to luminous AGN and XRBs in the high/soft state. The X-ray variability detected in the case of NGC 3226 could be the result of a break time-scale of day ( Hz) in the NGC 3226 PSD, however, this assumption is purely speculative and PSD measurement of NGC 3226, which is not possible with the present 100 ks observation due to a low number of counts for this kind of study, could help confirm or discard this idea. Similar to NGC 3226, variability on short time-scales (half a day to several days) was observed in the LINER 1 source NGC 3998 (Pian et al. 2010) and in the low luminosity AGN M 81 (Ishisaki et al. 1996; Iyomoto & Makishima 2001; Pian et al. 2010).

Although all of the normalized excess variance derived for our sample consist of upper limits, except for NGC 3226, we show in Fig. 8 as a function of BH mass. Fig. 8 rules out any variability on time-scales shorter than 50 ks in our sample of LINER 1s, commonly observed in more luminous AGN (O’Neill et al. 2005), except for NGC 4278 that shows a 10% flux increase in a h time-scale.
Variability on time-scales of months to years is common in our sample. Seven out of nine sources observed for more than once show variability on months (NGC 5005 and NGC 4278) to years (NGC 315, NGC 3226, NGC 3718, NGC 3998, NGC 4143, and NGC 4278) time-scales888All of the sources reported to show variability on years time-scale and not on months time-scale lack inter-year observations and therefore, monthly variability cannot be tested. with a 5 times flux increase in the most variable source, NGC 4278, and a 1.4 times flux increase in the least variable source, NGC 4143. The only two sources that do not show variability on long time-scales are the ones with a very low : NGC 2681 and NGC 2787 (Table 6). Both sources were observed twice in less than a 5 months period and therefore, variability on years-timescale cannot be tested. For illustration purposes, we report in Figure 13 the fluxes derived for the sources observed more than once. All but NGC 2681 and NGC 2787 exhibit months and/or years time-scale variability.
With the increasing number of X-ray observations of LINER and low luminosity AGN sources, more sources are revealing short time-scale variability ( day). This variability is detected with the help of the current generation of X-ray telescopes (Chandra, XMM-Newton, and Swift) which have a good spatial resolution to isolate the nucleus X-ray emission from contaminating sources. Nevertheless, and before any firm conclusions are made about variability from low accretion rate sources, a homogeneous well sampled population of LINERs and/or low luminosity AGN, with long X-ray observations ( ks), should be available.
5.2 X-ray spectral shape
Most recently, Zhang et al. (2009) studied the X-ray nuclear activity of a distance limited sample, D15 Mpc, of 187 galaxies. The authors found that the X-ray emission from 60% of the elliptical and early type spiral galaxies is consistent with nuclear accreting supermassive BH. They fit the spectra of each source with an absorbed power-law and found a photon index and an intrinsic column density covering almost 4 orders of magnitude from cm-2 to cm-2. The authors found a luminosity ranging from erg s-1 to erg s-1 corresponding to a LLEdd ratio between to . Similar results were derived in previous work such as the work of González-Martín et al. (2006, 2009) on a sample of 82 nearby LINER sources. The authors found that 60% of the sample shows a hard unresolved X-ray point-like source in the 4.5-8.0 keV band consistent with an AGN assumption. The data were fit mainly by an absorbed power-law, with a mean photon index and an intrinsic column density ranging from cm-2 to cm-2, and a thermal component with a mean temperature keV.
The results we derive for our homogeneous and optically selected sample of LINER 1s showing definite detection of broad H emission are in agreement with all of the results derived on broad samples of LINERs and low luminosity AGN in the past. X-ray spectra in the whole 0.5-10 keV band of the majority of our sample are well fitted with an absorbed power-law (9/13). This could mean that the X-ray emission in the soft and in the hard band is originating from the same region. In the remaining 4 sources (NGC 315, NGC 2681, NGC 4278, and NGC 5005), we included a thermal component to take into account some low energy residuals, most likely from diffuse hot gas. We found a photon index ranging from for the hardest source to for the softest one with a mean value of and a dispersion , similar to values reported in Komossa et al. (1999) and Terashima et al. (2002). The absorption column density observed in our sample spans two orders of magnitude from cm-2 for unabsorbed sources (e.g. NGC 3998, NGC 4143) to cm-2 for the mildly absorbed source NGC 3718. This is consistent with the fact that strong absorption is not expected in objects showing broad optical emission line, e.g. LINER 1s, as found in luminous type 1 AGN. This result was already confirmed by Terashima et al. (2002) who studied the ASCA X-ray observations of 21 LINER and 17 low luminosity Seyfert galaxies. The authors found a discrepancy in the intrinsic absorbing column density between type 1 LINERs, cm-2 (except for NGC 1052 which is not included in our sample, see § 2), and type 2 LINERs absorbed with a column density consistent with a few cm-2. The origin of the slight excess absorption in some of the sources in our sample of LINER 1s could be due to either the host galaxy and/or some compton thin material intrinsic to the central engine. We find a mean value to the temperature of the thermal component of keV typical of diffuse hot gas in early type galaxies (, Fabbiano 1989). Similar values were reported in Flohic et al. (2006) for a sample of 19 LINER sources observed with Chandra. The 2-10 keV luminosities of the LINER 1s in our sample span a range from 3.2 erg s-1 to 5.4 erg s-1 which resulted in range from to , in agreement with results derived on broad samples of LINERs and low luminosity AGN. These corresponding “Eddington ratios” are at least an order of magnitude smaller than those reported for luminous AGN (Porquet et al. 2004; Nandra et al. 2007).
Although the photon indices measured for our sample of LINER 1s are similar to those of type 1 Seyfert galaxies (Nandra et al. 1997b), this does not necessarily mean that the X-ray emission in LINER 1s is originating from an accretion flow similar to that of more luminous galaxies (e.g. NGC3998, Ptak et al. 2004). Other X-ray timing and spectral aspects could help shed light on the accretion mechanism in LINER 1s.
5.3 The absence of an Fe K line
It is now believed that a narrow emission Fe K line at 6.4 keV is a common feature in the X-ray spectra of Seyfert galaxies. The origin of this neutral narrow emission line is generally attributed to fluorescence originating from parsec-scale distances (torus) to distances closer than the broad line region (Shu et al. 2010). An X-ray Baldwin effect was discovered by Iwasawa & Taniguchi (1993) where the EW of the Fe line decreases with increasing luminosity. Page et al. (2004) suggested that this Baldwin effect observed in X-rays could be the result of a luminosity-dependent covering fraction of the putative torus. The increase in radiation pressure flattens the torus leading to a bigger opening angle for the torus and, hence, smaller covering factor (Konigl & Kartje 1994). This effect was later confirmed on bigger samples of radio-quiet and radio-loud AGN (Nandra et al. 1997c; Bianchi et al. 2007; Chaudhary et al. 2010, but also see Jiménez-Bailón et al. 2005). LINER 1s individually studied in the literature with a high signal to noise ratio around 6.4 keV do not show any sign of Fe K emission line with stringent upper limits on the EW: 25 eV for NGC 3998 (Ptak et al. 2004), 35 eV for NGC 3226 (Binder et al. 2009), and 22 eV for NGC4278 (Y10). Therefore, it appears that the X-ray Baldwin effect do not hold down to very low luminosity AGN.
We do not detect any significant Fe K emission line in our sample with upper limits obtained for the sources with the highest signal to noise ratio around 6 keV (38 eV: NGC 3226, 112 eV: NGC 3718, 33 eV: NGC 3998, and 22 eV: NGC 4278). If the broad line region is responsible for the emission of an Fe K line, such as the case for the intermediate Seyfert-LINER source NGC 7213 (Lobban et al. 2010; Bianchi et al. 2008), we would expect to detect it in at least the sources with high signal to noise ratio around 6.4 keV, since our sample consists of LINER 1s showing a definite detection of broad H emission. Instead, the disappearance of the torus structure at low Eddington ratios as suggested by Ho (2008) and Zhang et al. (2009) could explain the lack of Fe emission lines in our sample, assuming that the torus is responsible for the formation of the fluorescence Fe line. Interestingly, we find that the highest upper limit on the EW of the Fe K line is found for NGC 3718 which has the highest hydrogen column density ( cm-2) in our sample of LINER 1s.
5.4 Accretion mode in LINER 1s?
The accretion mechanism responsible for the bulk of energy from radio to X-rays in LINER sources is still poorly understood. Ho (2009) recently demonstrated that through local mass loss from evolved stars and Bondi accretion of hot gas, the accretion rate supply needed for the luminosities observed in LINERs and other LLAGN is easily attained. The author argued that the gas supply present at the center of nearby galaxies should generate more active nuclei and the luminosity deficit seen in the nearby universe is the result of a low radiative efficiency. Indeed, radiatively inefficient accretion flow (RIAF, see Narayan & McClintock 2008; Quataert 2001, for reviews) models have been applied to a growing number of LINERs and LLAGN to explain their energy budget and their spectral energy distribution: M 81 and NGC 4579 (Quataert et al. 1999), NGC 4258 (Gammie et al. 1999), NGC 3998 (Ptak et al. 2004), and NGC 1097 (Nemmen et al. 2006). Wu et al. (2007) fit the SED of a small sample of eight FR I sources with RIAF and/or jet models and confirmed the prediction of Yuan & Cui (2005) that below a critical value of the Eddington ratio () the X-ray emission becomes dominated by the jet rather than the RIAF. Ho (2009) suggested an even lower value to distinguish between objects in the “low” state, where an outer thin disk persists, and those in the “quiescent” state containing a pure RIAF. Since we are only considering the X-ray properties of this sample in our study, we decided to examine the relation which was shown to be a good indicator of accretion rate in luminous AGN (Shemmer et al. 2006).
In luminous AGN, a positive correlation is found between the hard X-ray power-law slope and the ratio of the 2-10 keV luminosity to the Eddington luminosity (Wang et al. 2004; Shemmer et al. 2006; Sobolewska & Papadakis 2009). Greene & Ho (2007b) showed that the relation holds for intermediate-mass ( M⊙) BHs in active galaxies and Porquet et al. (2004) showed that the relation extends up to more luminous objects when studying a sample of 21 low-redshift quasars. A viable explanation is that whenever the disk emission increases, the corona, the origin of the hard X-ray emission, cools more efficiently exhibiting a steepening of the hard X-ray spectrum. This relation was examined for LLAGN (local Seyferts and LINERs) by Gu & Cao (2009) (see also Constantin et al. 2009) who found a significant anticorrelation between the hard X-ray photon index and the Eddington ratio, Lbol/LEdd=30, for the local Seyfert galaxies in their sample. However, no strong correlation was found when considering only the LINER sources in their sample owing most likely to heterogeneous fitting models as they have collected their data points from different studies. The authors suggested that this anticorrelation found in their sample, which is in contrast to the positive correlation found for more luminous AGN, could signify that LLAGN resemble XRBs in the low/hard state where a similar anticorrelation is found (Yamaoka et al. 2005; Yuan et al. 2007; Wu & Gu 2008). Wu & Gu (2008) suggested that the anticorrelation could mean an accretion mode consistent with a RIAF whereas a positive correlation could mean the existence of the classical thin accretion disk. A plausible explanation for the hardening of the spectrum as the accretion rate increases in a RIAF context (as seen in the - anticorrelation) is the increase of the optical depth of the RIAF which leads to an increase in the Compton -parameter resulting in a harder X-ray spectrum.
Our well defined optically-selected sample of LINER 1s and our homogeneous data analysis techniques allowed us to establish a strong anticorrelation between and for our sample of LINER 1s (see § 4.3), not seen in the LINER sample of Gu & Cao (2009). This strong anticorrelation support the idea suggested by Gu & Cao (2009) that LLAGN might be similar to XRBs in the low/hard state where the emission is presumably generated in a RIAF structure. Qiao & Liu (2010) predicted such an anticorrelation in the low/hard state for their accretion flow model consisting of an outer-cool optically-thick disk and inner-hot optically-thin RIAF within the framework of disk and corona with mass evaporation (Liu et al. 2002). Qiao & Liu (2010) found that their model can reproduce the anticorrelation between the X-ray photon index and the Eddington ratio observed for the X-ray binary XTE~J1118+480.

Wu & Gu (2008) noted that the transition between the two different accretion modes in their sample of XRBs is different for different sources but roughly converge to the transitional point where and keV). Assuming that the accretion mode in the high luminosity AGN sample of Shemmer et al. (2008) is the standard thin disk and the accretion mode in our sample of LINER 1s is a RIAF, then the transition point between the two accretion modes in AGNs would be at and (Fig. 14) in good agreement, within the error bars, with the values reported for the XRBs and for the sample of Constantin et al. (2009). One should keep in mind that these two values are affected by several parameters, mainly the BH mass and the bolometric luminosity, that are calculated by different means between Shemmer et al. (2008) and this work. Indeed, Shemmer et al. (2008) calculated the BH masses and the Eddington ratios, , of their sample of luminous AGNs using the (5100Å) and FWHM(H), whereas our calculation of the BH masses of our sample are based on the relation and is calculated using the bolometric correction of Ho (2008).
We do not detect any sharp cut below the critical value of of 10-6 indicating a change in the X-ray emission, becoming dominated by synchrotron emission from a jet (Yuan & Cui 2005). This could be due to selection effects where none of our sources, except for NGC 315, comprises strong jets. Moreover, a transition between a “low” and a “quiescent” state whenever the accretion rate drops below a critical value () as suggested most recently by Ho (2009) could not be tested since, as stressed by the author, this kind of analysis should be conducted on large samples.
5.5 Other correlations and implications
We found a positive correlation between the hard X-ray luminosity, , and . An increase in the hard X-ray luminosity with increasing is independent of the accretion model and seen in different types of galaxies from transition nuclei to high luminosity Seyfert nuclei and quasars (Ho 2009; Greene & Ho 2007a). Another strong positive correlation we found for our sample of LINER 1s is the increase of the 2-10 keV luminosity with increasing BH mass. A similar trend is seen in a sample of 112 early-type galaxies within a distance of 67 Mpc (Pellegrini 2010). Therefore, both the BH mass and the (equivalent to the Eddington ratio Lbol/LEdd) are driven factors of the hard keV luminosity. This could be seen in the right upper panel of Fig. 12 in § 4.3 where NGC 2787 with a relatively high BH mass of M⊙ has a low 2-10 keV luminosity as a consequence of a low (). We did not find any strong dependence of the spectral slope or the Eddington ratio on the BH mass (although a spearman-rank correlation showed that is weakly anticorrelated to the BH mass). This is in contrast with the anti-correlation between the X-ray spectral slope and the BH mass seen in a sample of low redshift PG quasars (Porquet et al. 2004). It appears that in our sample of LINER 1s, which have a very low accretion rate, the BH mass – here spanning 2 orders of magnitude in log() space – is not the main driver of the X-ray photon index.
6 Summary and conclusion
In the present work, we studied the X-ray properties of a sample of nearby LINER galaxies showing definite detection of broad H emission (Ho et al. 1997b). Such a sample insures the responsibility of accretion into a SMBH for the detection of the broad emission lines, guarantees the non-existence of large obscuration, and enables X-ray comparison of this class with both XRBs and type 1 AGN.
Only two sources in our sample exhibit significant hours to days time-scale variability. The NGC 4278 flux increased by a factor of 10% on a hour period, to remain constant for the rest of the observation (see Y10). On the other hand, NGC 3226 shows variability for the whole observation of ks, increasing continuously. Three other sources show hint of inter-day variability with a K-S test probability between 2% and 4% that the X-ray emission originates from a constant source. Short time-scale variability study from a homogeneous well sampled population of LINERs and/or low luminosity AGN, with long X-ray observations ( ks) should be conducted before any firm conclusions are made about variability from low accretion rate sources. On the other hand, variability on longer (months to years) time-scales is common in our sample where 7 out of 9 sources exhibit long time-scale variability. The two sources not exhibiting variability are the ones with a very low .
The X-ray spectra of our sample of LINER 1s are typical of all types of LINER sources, fit with an absorbed power-law, or a combination of a thermal component and an absorbed power-law. We found a photon index for our sample between for the hardest source and for the softest one with a mean value of and a dispersion . None of the sources in our sample is heavily absorbed with NGC 3718 having the highest intrinsic hydrogen column density of cm-2. The thermal component had a mean temperature kT keV, typical of other LINER sources embedded in diffuse emission (Flohic et al. 2006). Our sample spans three orders of magnitude in both luminosity and space, ranging from 1038 to 1041 erg s-1 and from 10-8 to 10-5 respectively, which is at least an order of magnitude smaller than the Eddington ratios observed in luminous AGN (Seyferts and quasars).
We do not detect any significant Fe K emission line at 6.4 keV in the spectra of our sample of LINER 1s. We obtained upper limits on the Fe line for the four sources with the highest signal to noise ratio around 6.4 keV (38 eV: NGC3226, 112 eV: NGC 3718, 33 eV: NGC3998, and 22 eV: NGC 4278). The lack of a narrow Fe line could be due to the disappearance of a torus structure in LLAGN and LINER sources (Ho 2008; Zhang et al. 2009). This implies that the X-ray Baldwin effect or the “Iwasawa-Tanigushi” effect of decreasing Fe K EW with increasing 2-10 keV luminosity does not extend down to LINER 1s.
Finally, we looked for correlations between the X-ray properties and the AGN properties of our LINER 1 sample. We found a strong anticorrelation between the power-law photon index and the Eddington ratio suggesting that LINER 1s differ from more luminous Seyfert and quasar galaxies that show a positive correlation between the photon index and the Eddington ratio. This anticorrelation, established for the first time for LINER 1s, suggest that LINER 1s mode of accretion could be similar to that of XRBs in their low-hard state, and a RIAF could be responsible for the emitting energy from the nucleus. We found that the 2-10 keV luminosity in our sample is positively correlated to two parameters, the BH mass and the Eddington ratio, , confirming the results found for broad samples of LINERs and low luminosity AGN. On the other hand, it appears that in our sample of LINER 1s, which have a very low accretion rate, the BH mass is not the main driver of the X-ray photon index, as the two quantities do not show any strong correlation.
Acknowledgements.
This research has made use of the data obtained from the Chandra Data Archive and the Chandra Source Catalog, and software provided by the Chandra X-ray Center (CXC) in the application packages CIAO and Chips. This work is based on observations with XMM-Newton, an ESA science mission with instruments and contributions directly funded by ESA Member States and the USA (NASA). This research has made use of the SIMBAD database, operated at CDS, Strasbourg, France. This research has made use of the NASA/IPAC Extragalactic Database (NED) which is operated by the Jet Propulsion Laboratory, California Institute of Technology, under contract with the National Aeronautics and Space Administration. G.Y. would like to thank I. Papadakis for helpful and enlightening discussions. The authors would also like to thank the referee for fruitful comments that improved the quality of the manuscript.Appendix A Notes on individual sources
NGC 266. Terashima & Wilson (2003) studied the 2 ks snapshot observation made with Chandra and discussed here. They model the X-ray spectrum with an absorbed power-law and derive a hydrogen column density and a photon index of cm-2 and 1.4, respectively. They find a 2-10 keV flux of erg s-1 cm-2. The values of the photon index and the 2-10 keV flux are with a good agreement with the value we report here (within the error bars), but no additional absorption is added to our model.
NGC 315. Worrall & Birkinshaw (1994) first suggested the presence of an active galactic nucleus at the center of NGC 315 using ROSAT data. This assumption was later confirmed by Matsumoto et al. (2001) when studying a 37 ks ASCA observation (see also Terashima et al. (2002)). The authors fit the hard 2-10 keV spectrum with a power-law and find a photon index of and a luminosity of erg s-1. A resolved X-ray jet emission was first reported by Worrall et al. (2003) when studying the Chandra snapshot observation (obs. ID: 855). The fit to the jet emission with a power-law gave a photon index of and a erg s-1 luminosity. The authors fit the unresolved core emission with a moderately absorbed power-law with an intrinsic hydrogen column density of cm-2 and a photon index of . Worrall et al. (2007) found similar results when studying the longer Chandra observation reporting a harder core spectrum than the jet with photon indicies of and respectively. Moreover, Croston et al. (2008), after solar flare cleaning, studied the only XMM-Newton observation and fit the core spectrum with a combination of a mekal and a power-law. Our analysis of the two Chandra observations and the XMM-Newton one gives similar results to all of the above studies with a simultaneous fit to the different extracted spectra where a combination of a mekal ( keV) and a mildly absorbed ( cm-2) power-law ( between 1.5 and 2) were used. The increase in the power-law slope from during the Chandra observation to during the XMM-Newton one is accompanied by a decrease in the 2-10 keV flux from to erg s-1. This behavior (see § 5.4) is typical of X-ray emission originating in a RIAF structure which is believed to be the accretion mechanism responsible for the bulk of energy from radio to X-rays in NGC 315 (Wu et al. 2007).
NGC 2681. One of the two observations performed with Chandra has been already reported in Satyapal et al. (2005). The authors fit the 0.5-8 keV spectrum with a combination of a thermal component with keV and a power-law with a photon index . No intrinsic absorption was required. The same observation was treated in González-Martín et al. (2009) and same results were derived after fitting the spectrum with a mekal and a power-law. González-Martín et al. (2009) derived a 2-10 keV flux of erg s-1 cm-2. We fit the spectrum of the two Chandra observations of NGC 2681 simultaneously with a combination of a thermal component and an absorbed power-law. We found similar results to that derived in the previous works ( and keV) with a 2-10 keV flux of erg s-1 cm-2.
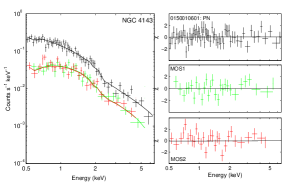
NGC 2787. Ho et al. (2001), after studying a Chandra snapshot, gave this source a class III X-ray morphology, showing hard X-ray nucleus embedded in diffuse emission. Terashima & Wilson (2003) derived a 2-10 keV flux of about erg s-1 cm-2, after assuming a photon index of 2 and a Galactic absorption. González-Martín et al. (2009) analyzed both Chandra and XMM-Newton long observations and fit the Chandra spectrum with a power-law with a rather soft of 2.3 and fit the XMM-Newton spectrum with a combination of two power-laws and a thermal component with a power-law absorption of cm-2. We found a good fit for both Chandra and XMM-Newton spectra simultaneously with a single absorbed power-law and found little absorption of cm-2 and a soft power-law photon index, , and a 2-10 keV flux of erg s-1 cm-2.
NGC 3226. George et al. (2001) fit the 0.5-10 keV spectrum extracted from the long Chandra observation with an absorbed ( cm-2) power-law (). Terashima & Wilson (2003) fit the spectrum of the 2.5 ks snapshot Chandra observation with a moderately absorbed power-law with cm-2 and . Gondoin et al. (2004) fit the data of the 35 ks XMM-Newton observation with a partial covering absorber to a bremsstrahlung and found that the X-ray emitting region, with a temperature keV is 90% covered by an absorber with cm-2. Binder et al. (2009) studied the 100 ks XMM-Newton observation and fit the spectrum with a partially covered power-law with , a covering fraction of 90%, and an intrinsic hydrogen column density of cm-2. We fit the spectra of both XMM-Newton and the long Chandra observations simultaneously with an absorbed power-law and found an intrinsic column density varying between the observations from cm-2 to cm-2 and a mean photon index .
NGC 3718. Satyapal et al. (2005) studied the snapshot Chandra observation and fit the spectrum with an absorbed ( cm-2) power-law () in excellent agreement with our fit results to the same observation. We studied two XMM-Newton observations of NGC 3718, being in the field of view of the observations of the heavily absorbed Seyfert 2 galaxy UGC~6527. We fit the spectra with an absorbed power-law and found an intrinsic hydrogen column density similar to the one derived for the Chandra observation of cm-2 but a somewhat softer power-law with . This softening is accompanied with a 2-10 keV flux decrease from erg s-1 cm-2 to erg s-1 cm-2.
NGC 3998. Ptak et al. (2004) studied the 10 ks XMM-Newton observation and fit the spectrum with a slightly absorbed ( cm-2) power-law (). Same results were found for observations made with BeppoSAX (Pellegrini et al. 2000) and ASCA (Ptak et al. 1999). González-Martín et al. (2009) fit the Chandra spectrum with a combination of two absorbed power-laws and a thermal component. We fit the XMM-Newton and the Chandra spectra simultaneously with a mildly absorbed ( cm-2) power-law and found a varying from 1.8 to 2.1 respectively, occurring with a flux decrease from erg s-1 cm-2 to erg s-1 cm-2.
NGC 4143. Terashima & Wilson (2003) fit the Chandra snapshot observation with an absorbed power-law with cm-2 and . We fit the same snapshot observation with a power-law without a requirement of an intrinsic absorption and found a similar power-law photon index within the error bars, . We fit the XMM-Newton observation with an absorbed power-law and found a cm-2 and a .
NGC 4203. A power-law fit to the ASCA spectrum resulted in a (Iyomoto et al. 1998). Ho et al. (2001) gave NGC 4203 a class I X-ray morphology showing dominant X-ray nucleus. We find that the 40 ks Chandra spectrum is well fitted with a simple power-law affected by Galactic absorption with , softer than the result reported for ASCA, most likely due to contamination from X-ray sources in the ASCA extraction region of 1′.
NGC 4278. See Y10.
NGC 4750. Dudik et al. (2005), and according to the only Chandra snapshot observation, gave this source a morphological X-ray type II, exhibiting multiple, hard off-nuclear point sources of comparable brightness to the nuclear source. We fit the spectrum of this same observation with an absorbed power-law with cm-2 and .
NGC 4772. We fit the spectrum of the only, Chandra snapshot, observation with an absorbed ( cm-2) power-law ().
NGC 5005. Terashima et al. (2002) fit the ASCA spectrum with a combination of an absorbed ( cm-2) power-law () and a thermal component (). Dudik et al. (2005) gave NGC 5005 a morphological X-ray type III, showing a hard nuclear point source embedded in diffuse emission. González-Martín et al. (2009) fit the XMM-Newton spectrum with a combination of a thermal component with keV and an absorbed ( cm-2) power-law (). We find a hotter thermal component when fitting the same data set with keV and a mildly absorbed power-law with cm-2 and .
Appendix B Surrounding sources of the centers of galaxies observed with Chandra
In this Appendix, we report the spectral analysis of resolved and/or unresolved off-nucleus sources detected with the Chandra telescope, but blended within the central LINER in the XMM-Newton extraction region (§ 3.2). Fig. 1-4 show the surrounding sources of these LINER 1s detected with Chandra within a 25′′-radius circle. The surrounding medium of NGC 4278 is already reported in Y10.
NGC 315. This source is the only source in our sample that shows a resolved X-ray jet. We extracted from the longer Chandra observation the spectrum of the jet from an ellipse with a semi-major axis of about 11.3′′ and semi-minor axis of 5.6′′. The base of the ellipse extends down to the PSF of the central source. We fit the spectrum with a combination of an absorbed power-law and a thermal mekal component and found a good fit with a reduced of 0.9 for 42 d.o.f. We find a hydrogen column density upper limit of cm-2 and a photon index . The thermal component had a temperature of keV. We find a corrected 0.5-10 keV flux for the jet emission of erg s-1 cm-2, which corresponds to a 0.5-10 keV luminosity of erg s-1, corresponding to 8% of the nuclear flux. The power-law emission contributes to 95% to the total emission of the jet. For the diffuse emission, we extracted the spectrum from an annulus with inner circle delimited by PSF of the central source and an outer radius of 25′′ excluding the jet extraction region. The same model fit to the jet gave a good fit with a reduced of 1.3 for 61 d.o.f. We find an intrinsic absorption to the powerlaw component cm-2 and a photon index , possibly representing emission from unresolved X-ray binaries. The thermal component has a temperature similar to the one derived for the jet emission with keV. We found a corrected 0.5-10 keV flux of erg s-1 cm-2 with the power-law contributing only to 30% of the total emission. This corresponds to a luminosity of erg s-1 which is % of the total core luminosity.
NGC 2787. An X-ray source south-east of the nucleus of NGC 2787 at a distance less than 10′′ is present. We fit the spectrum of this source with an absorbed power-law. We used the same redshift and Galactic absorption as for the NGC 2787 nucleus, assuming that this X-ray source is located in NGC 2787 and not a background quasar. The fit is acceptable with a reduced of 1.0 for 19 d.o.f. We found a power-law photon index , typical of X-ray binaries in nearby galaxies (Irwin et al. 2003; Fabbiano 2006), and an upper limit on the intrinsic hydrogen column density of cm-2. We derived a 0.5-10 keV corrected flux of erg s-1 cm-2, which resulted in a luminosity of, adapting the NGC 2787 distance of 7.48 Mpc, erg s-1. This luminosity is close to the NGC 2787 core luminosity of erg s-1. Such a source could be a luminous low mass X-ray binary (LMXB) similar to some seen in early type galaxies (Fabbiano 2006). The rest of the medium in an annulus of outer radius 25′′ around NGC 2787 is formed by six other X-ray sources, much fainter than the closest one to the center. We could not perform spectral analysis on the different sources aside, so we fit the spectrum of the six sources simultaneously with a power-law only affected by Galactic absorption. We found a photon index of 2 for the six sources and a total corrected 0.5-10 keV flux of erg s-1 cm-2, resulting in a 0.5-10 keV luminosity of erg s-1, corresponding to 5% of the nucleus luminosity, when adapting the NGC 2787 distance of 7.48 Mpc.
NGC 3226. Two X-ray sources are within a 12′′ distance from the nucleus of NGC 3226 (source 1: CXOU J102334.1+195347, source 2: CXOU J102326.7+195407). Both sources were reported in George et al. (2001). Based on the hardness ratio between the counts in the 0.3-2 keV band and the counts in the 2-10 keV band, the authors estimated the sources to have a flux of a few erg s-1 cm-2, and therefore a luminosity between a few times erg s-1 to a few times erg s-1. We fit the spectrum of both sources with an absorbed power-law, using the cash statistic due to a low number of counts. We find that source 1 and source 2 have an intrinsic absorption upper limit of cm-2 and cm-2, respectively. The photon index we found for source 2 is typical, within the error bars, of accreting objects with a . On the other hand, we found a harder spectrum for source 1 with a . The corrected 0.5-10 keV flux we derive for source 1 and source 2 are erg s-1 cm-2 and erg s-1 cm-2, respectively. This implies, assuming the distance of NGC 3226 to both sources, a corrected 0.5-10 keV luminosity of erg s-1 and erg s-1 for source 1 and source 2 respectively. Both luminosities are well beyond the luminosity of a typical neutron star LMXB of erg s-1, and hence could be BHs greater than or equal to a few solar masses, very young supernovae, or microquasars (George et al. 2001).
NGC 3998. Only one source is detected within a 25′′ circle around NGC 3998 in the Chandra image. We fit the source with an absorbed power-law, using the cash statistic. We found an upper limit on the intrinsic column density of cm-1 and a power-law photon index of . We derived a corrected 0.5-10 keV flux of erg s-1 cm-2, which corresponds to a luminosity of erg s-1, adapting the NGC 3998 distance of 14.1 Mpc. This corresponds to only 0.2% of the total core luminosity of NGC 3998 and match the luminosity of XRBs in nearby galaxies.
References
- Alonso-Herrero et al. (2000) Alonso-Herrero, A., Rieke, M. J., Rieke, G. H., & Shields, J. C. 2000, ApJ, 530, 688
- Arnaud (1996) Arnaud, K. A. 1996, in ASP Conf. Ser. 101: Astronomical Data Analysis Software and Systems V, 17
- Awaki et al. (2001) Awaki, H., Terashima, Y., Hayashida, K., & Sakano, M. 2001, PASJ, 53, 647
- Baldi et al. (2009) Baldi, A., Forman, W., Jones, C., et al. 2009, ApJ, 707, 1034
- Barth et al. (1999) Barth, A. J., Filippenko, A. V., & Moran, E. C. 1999, ApJ, 515, L61
- Bevington & Robinson (2003) Bevington, P. R. & Robinson, D. K. 2003, Data reduction and error analysis for the physical sciences, ed. Bevington, P. R. & Robinson, D. K.
- Bianchi et al. (2007) Bianchi, S., Guainazzi, M., Matt, G., & Fonseca Bonilla, N. 2007, A&A, 467, L19
- Bianchi et al. (2008) Bianchi, S., La Franca, F., Matt, G., et al. 2008, MNRAS, 389, L52
- Binder et al. (2009) Binder, B., Markowitz, A., & Rothschild, R. E. 2009, ApJ, 691, 431
- Broos et al. (2010) Broos, P. S., Townsley, L. K., Feigelson, E. D., et al. 2010, ApJ, 714, 1582
- Chaudhary et al. (2010) Chaudhary, P., Brusa, M., Hasinger, G., Merloni, A., & Comastri, A. 2010, A&A, 518, A58+
- Constantin et al. (2009) Constantin, A., Green, P., Aldcroft, T., et al. 2009, ApJ, 705, 1336
- Croston et al. (2008) Croston, J. H., Hardcastle, M. J., Birkinshaw, M., Worrall, D. M., & Laing, R. A. 2008, MNRAS, 386, 1709
- Dopita & Sutherland (1995) Dopita, M. A. & Sutherland, R. S. 1995, ApJ, 455, 468
- Dudik et al. (2005) Dudik, R. P., Satyapal, S., Gliozzi, M., & Sambruna, R. M. 2005, ApJ, 620, 113
- Fabbiano (1989) Fabbiano, G. 1989, ARA&A, 27, 87
- Fabbiano (2006) Fabbiano, G. 2006, ARA&A, 44, 323
- Flohic et al. (2006) Flohic, H. M. L. G., Eracleous, M., Chartas, G., Shields, J. C., & Moran, E. C. 2006, ApJ, 647, 140
- Freeman et al. (2002) Freeman, P. E., Kashyap, V., Rosner, R., & Lamb, D. Q. 2002, ApJS, 138, 185
- Gammie et al. (1999) Gammie, C. F., Narayan, R., & Blandford, R. 1999, ApJ, 516, 177
- George et al. (2001) George, I. M., Mushotzky, R. F., Yaqoob, T., et al. 2001, ApJ, 559, 167
- Gondoin et al. (2004) Gondoin, P., Orr, A., & Siddiqui, H. 2004, A&A, 420, 905
- González-Martín et al. (2009) González-Martín, O., Masegosa, J., Márquez, I., Guainazzi, M., & Jiménez-Bailón, E. 2009, A&A, 506, 1107
- González-Martín et al. (2006) González-Martín, O., Masegosa, J., Márquez, I., Guerrero, M. A., & Dultzin-Hacyan, D. 2006, A&A, 460, 45
- Graham et al. (2010) Graham, A. W., Onken, C. A., Athanassoula, E., & Combes, F. 2010, ArXiv e-prints
- Greene & Ho (2007a) Greene, J. E. & Ho, L. C. 2007a, ApJ, 667, 131
- Greene & Ho (2007b) Greene, J. E. & Ho, L. C. 2007b, ApJ, 656, 84
- Gu & Cao (2009) Gu, M. & Cao, X. 2009, MNRAS, 399, 349
- Guainazzi & Antonelli (1999) Guainazzi, M. & Antonelli, L. A. 1999, MNRAS, 304, L15
- Harris (2003) Harris, D. E. 2003, New A Rev., 47, 617
- Heckman (1980) Heckman, T. M. 1980, A&A, 87, 152
- Ho (1999) Ho, L. C. 1999, ApJ, 516, 672
- Ho (2008) Ho, L. C. 2008, ARA&A, 46, 475
- Ho (2009) Ho, L. C. 2009, ApJ, 699, 626
- Ho et al. (2001) Ho, L. C., Feigelson, E. D., Townsley, L. K., et al. 2001, ApJ, 549, L51
- Ho et al. (1995) Ho, L. C., Filippenko, A. V., & Sargent, W. L. 1995, ApJS, 98, 477
- Ho et al. (1997a) Ho, L. C., Filippenko, A. V., & Sargent, W. L. W. 1997a, ApJS, 112, 315
- Ho et al. (1997b) Ho, L. C., Filippenko, A. V., Sargent, W. L. W., & Peng, C. Y. 1997b, ApJS, 112, 391
- Ho et al. (2009) Ho, L. C., Greene, J. E., Filippenko, A. V., & Sargent, W. L. W. 2009, ApJS, 183, 1
- Irwin et al. (2003) Irwin, J. A., Athey, A. E., & Bregman, J. N. 2003, ApJ, 587, 356
- Ishisaki et al. (1996) Ishisaki, Y., Makishima, K., Iyomoto, N., et al. 1996, PASJ, 48, 237
- Iwasawa & Taniguchi (1993) Iwasawa, K. & Taniguchi, Y. 1993, ApJ, 413, L15
- Iyomoto & Makishima (2001) Iyomoto, N. & Makishima, K. 2001, MNRAS, 321, 767
- Iyomoto et al. (1998) Iyomoto, N., Makishima, K., Matsushita, K., et al. 1998, ApJ, 503, 168
- Jiménez-Bailón et al. (2005) Jiménez-Bailón, E., Piconcelli, E., Guainazzi, M., et al. 2005, A&A, 435, 449
- Jones et al. (2002) Jones, C., Forman, W., Vikhlinin, A., et al. 2002, ApJ, 567, L115
- Kalberla et al. (2005) Kalberla, P. M. W., Burton, W. B., Hartmann, D., et al. 2005, A&A, 440, 775
- Komossa et al. (1999) Komossa, S., Böhringer, H., & Huchra, J. P. 1999, A&A, 349, 88
- Konigl & Kartje (1994) Konigl, A. & Kartje, J. F. 1994, ApJ, 434, 446
- Liu et al. (2002) Liu, B. F., Mineshige, S., Meyer, F., Meyer-Hofmeister, E., & Kawaguchi, T. 2002, ApJ, 575, 117
- Lobban et al. (2010) Lobban, A. P., Reeves, J. N., Porquet, D., et al. 2010, MNRAS, 408, 551
- Maoz (2007) Maoz, D. 2007, MNRAS, 377, 1696
- Maoz et al. (2005) Maoz, D., Nagar, N. M., Falcke, H., & Wilson, A. S. 2005, ApJ, 625, 699
- Markowitz & Uttley (2005) Markowitz, A. & Uttley, P. 2005, ApJ, 625, L39
- Mason et al. (2001) Mason, K. O., Breeveld, A., Much, R., et al. 2001, A&A, 365, L36
- Matsumoto et al. (2001) Matsumoto, Y., Fukazawa, Y., Nakazawa, K., Iyomoto, N., & Makishima, K. 2001, PASJ, 53, 475
- McHardy et al. (2006) McHardy, I. M., Koerding, E., Knigge, C., Uttley, P., & Fender, R. P. 2006, Nature, 444, 730
- Mewe et al. (1985) Mewe, R., Gronenschild, E. H. B. M., & van den Oord, G. H. J. 1985, A&AS, 62, 197
- Nagar et al. (2005) Nagar, N. M., Falcke, H., & Wilson, A. S. 2005, A&A, 435, 521
- Nandra et al. (1997a) Nandra, K., George, I. M., Mushotzky, R. F., Turner, T. J., & Yaqoob, T. 1997a, ApJ, 476, 70
- Nandra et al. (1997b) Nandra, K., George, I. M., Mushotzky, R. F., Turner, T. J., & Yaqoob, T. 1997b, ApJ, 477, 602
- Nandra et al. (1997c) Nandra, K., George, I. M., Mushotzky, R. F., Turner, T. J., & Yaqoob, T. 1997c, ApJ, 488, L91+
- Nandra et al. (2007) Nandra, K., O’Neill, P. M., George, I. M., & Reeves, J. N. 2007, MNRAS, 382, 194
- Narayan & McClintock (2008) Narayan, R. & McClintock, J. E. 2008, New A Rev., 51, 733
- Nemmen et al. (2010) Nemmen, R. S., Storchi-Bergmann, T., Eracleous, M., & Yuan, F. 2010, ArXiv e-prints
- Nemmen et al. (2006) Nemmen, R. S., Storchi-Bergmann, T., Yuan, F., et al. 2006, ApJ, 643, 652
- Ohto et al. (2003) Ohto, A., Kawano, N., & Fukazawa, Y. 2003, PASJ, 55, 819
- O’Neill et al. (2005) O’Neill, P. M., Nandra, K., Papadakis, I. E., & Turner, T. J. 2005, MNRAS, 358, 1405
- O’Sullivan et al. (2005) O’Sullivan, E., Vrtilek, J. M., & Kempner, J. C. 2005, ApJ, 624, L77
- Page et al. (2004) Page, K. L., O’Brien, P. T., Reeves, J. N., & Turner, M. J. L. 2004, MNRAS, 347, 316
- Papadakis (2004) Papadakis, I. E. 2004, MNRAS, 348, 207
- Pellegrini (2010) Pellegrini, S. 2010, ApJ, 717, 640
- Pellegrini et al. (2000) Pellegrini, S., Cappi, M., Bassani, L., della Ceca, R., & Palumbo, G. G. C. 2000, A&A, 360, 878
- Pian et al. (2010) Pian, E., Romano, P., Maoz, D., et al. 2010, MNRAS, 401, 677
- Porquet et al. (2004) Porquet, D., Reeves, J. N., O’Brien, P., & Brinkmann, W. 2004, A&A, 422, 85
- Ptak et al. (1999) Ptak, A., Serlemitsos, P., Yaqoob, T., & Mushotzky, R. 1999, ApJS, 120, 179
- Ptak et al. (2004) Ptak, A., Terashima, Y., Ho, L. C., & Quataert, E. 2004, ApJ, 606, 173
- Ptak et al. (1998) Ptak, A., Yaqoob, T., Mushotzky, R., Serlemitsos, P., & Griffiths, R. 1998, ApJ, 501, L37+
- Qiao & Liu (2010) Qiao, E. & Liu, B. F. 2010, PASJ, 62, 661
- Quataert (2001) Quataert, E. 2001, in Astronomical Society of the Pacific Conference Series, Vol. 224, Probing the Physics of Active Galactic Nuclei, ed. B. M. Peterson, R. W. Pogge, & R. S. Polidan, 71–+
- Quataert et al. (1999) Quataert, E., Di Matteo, T., Narayan, R., & Ho, L. C. 1999, ApJ, 525, L89
- Satyapal et al. (2005) Satyapal, S., Dudik, R. P., O’Halloran, B., & Gliozzi, M. 2005, ApJ, 633, 86
- Shakura & Sunyaev (1973) Shakura, N. I. & Sunyaev, R. A. 1973, A&A, 24, 337
- Shemmer et al. (2006) Shemmer, O., Brandt, W. N., Netzer, H., Maiolino, R., & Kaspi, S. 2006, ApJ, 646, L29
- Shemmer et al. (2008) Shemmer, O., Brandt, W. N., Netzer, H., Maiolino, R., & Kaspi, S. 2008, ApJ, 682, 81
- Shu et al. (2010) Shu, X. W., Yaqoob, T., & Wang, J. X. 2010, ApJS, 187, 581
- Sobolewska & Papadakis (2009) Sobolewska, M. A. & Papadakis, I. E. 2009, MNRAS, 399, 1597
- Strüder et al. (2001) Strüder, L., Briel, U., Dennerl, K., et al. 2001, A&A, 365, L18
- Terashima et al. (2000) Terashima, Y., Ho, L. C., & Ptak, A. F. 2000, ApJ, 539, 161
- Terashima et al. (2002) Terashima, Y., Iyomoto, N., Ho, L. C., & Ptak, A. F. 2002, ApJS, 139, 1
- Terashima & Wilson (2003) Terashima, Y. & Wilson, A. S. 2003, ApJ, 583, 145
- Terlevich & Melnick (1985) Terlevich, R. & Melnick, J. 1985, MNRAS, 213, 841
- Tonry et al. (2001) Tonry, J. L., Dressler, A., Blakeslee, J. P., et al. 2001, ApJ, 546, 681
- Tremaine et al. (2002) Tremaine, S., Gebhardt, K., Bender, R., et al. 2002, ApJ, 574, 740
- Tully (1988) Tully, R. B. 1988, Nearby galaxies catalog, ed. Tully, R. B.
- Turner et al. (2001) Turner, M. J. L., Abbey, A., Arnaud, M., et al. 2001, A&A, 365, L27
- Turner et al. (1999) Turner, T. J., George, I. M., Nandra, K., & Turcan, D. 1999, ApJ, 524, 667
- Vaughan et al. (2003) Vaughan, S., Edelson, R., Warwick, R. S., & Uttley, P. 2003, MNRAS, 345, 1271
- Wang et al. (2004) Wang, J., Watarai, K., & Mineshige, S. 2004, ApJ, 607, L107
- Weisskopf et al. (2002) Weisskopf, M. C., Brinkman, B., Canizares, C., et al. 2002, PASP, 114, 1
- Wilms et al. (2000) Wilms, J., Allen, A., & McCray, R. 2000, ApJ, 542, 914
- Worrall & Birkinshaw (1994) Worrall, D. M. & Birkinshaw, M. 1994, ApJ, 427, 134
- Worrall et al. (2003) Worrall, D. M., Birkinshaw, M., & Hardcastle, M. J. 2003, MNRAS, 343, L73
- Worrall et al. (2007) Worrall, D. M., Birkinshaw, M., Laing, R. A., Cotton, W. D., & Bridle, A. H. 2007, MNRAS, 380, 2
- Wu & Gu (2008) Wu, Q. & Gu, M. 2008, ApJ, 682, 212
- Wu et al. (2007) Wu, Q., Yuan, F., & Cao, X. 2007, ApJ, 669, 96
- Xu et al. (2010) Xu, H., Gu, J., Gu, L., et al. 2010, Research in Astronomy and Astrophysics, 10, 220
- Xu et al. (2002) Xu, H., Kahn, S. M., Peterson, J. R., et al. 2002, ApJ, 579, 600
- Yamaoka et al. (2005) Yamaoka, K., Uzawa, M., Arai, M., Yamazaki, T., & Yoshida, A. 2005, Chinese Journal of Astronomy and Astrophysics Supplement, 5, 273
- York (1966) York, D. 1966, Canadian Journal of Physics, 44, 1079
- Younes et al. (2010) Younes, G., Porquet, D., Sabra, B., et al. 2010, A&A, 517, A33+
- Yuan & Cui (2005) Yuan, F. & Cui, W. 2005, ApJ, 629, 408
- Yuan et al. (2007) Yuan, F., Taam, R. E., Misra, R., Wu, X., & Xue, Y. 2007, ApJ, 658, 282
- Zhang et al. (2009) Zhang, W. M., Soria, R., Zhang, S. N., Swartz, D. A., & Liu, J. F. 2009, ApJ, 699, 281