ALPHA Collaboration
Centrifugal separation and equilibration dynamics in an electron-antiproton plasma
Abstract
Charges in cold, multiple-species, non-neutral plasmas separate radially by mass, forming centrifugally-separated states. Here, we report the first detailed measurements of such states in an electron-antiproton plasma, and the first observations of the separation dynamics in any centrifugally-separated system. While the observed equilibrium states are expected and in agreement with theory, the equilibration time is approximately constant over a wide range of parameters, a surprising and as yet unexplained result. Electron-antiproton plasmas play a crucial role in antihydrogen trapping experiments.
pacs:
52.27.Jt, 52.25.Fi, 36.10.-kNon-neutral (charged) plasmas held in a Penning-Malmberg trap rotate around the trap’s magnetic axis. Such traps use a solenoidal field to provide radial plasma confinement, and electrostatic fields to provide axial confinement. The rotation results from the drift induced by the plasma’s self electric field. If the plasma contains multiple species, the heavier will be pushed outwards by centrifugal forces. This effect, first predicted by O’Neil O’Neil (1981), can lead to almost complete separation of the species in sufficiently cold plasmas. Centrifugally separated states have been observed in several laser cooled Be+–ion Larson et al. (1986); Imajo et al. (1997); Gruber et al. (2001) and Be+–positron Jelenković et al. (2003) systems.
This paper presents the first images and detailed measurements of centrifugal separation in an electron (e-)–antiproton () plasma system. Figure 1 shows images of two such centrifugally-separated plasmas in the ALPHA antihydrogen trapping apparatus Andresen et al. (2007). (Recently, the ATRAP collaboration reported Gabrielse et al. (2010) indirect observations of centrifugally-separated states in a e-– system.) We also report the first measurements of the separation dynamics in any centrifugally-separated system. Specifically, we report the timescale on which the distribution comes into equilibrium in response to changes in the e- temperature and density. Depending on the type of change in the e- parameters, the equilibration time scale varies from milliseconds to seconds, but it is notable that the time scale is approximately seventy milliseconds for a wide range of changes. Not all of these time scales can be explained by previously explored theoretical mechanisms.
The ’s will separate from the e-’s when the rotational velocity at the plasma edge starts to exceed the thermal velocity of the ’s. In the limit, common in this paper, that there are few ’s compared to e-’s, the radial density will be given by , where is the e- radial density, and the edge scale length is
| (1) |
where is the plasma temperature, is the mass, is the central e- density, and is the unit charge. The rightmost expression holds only in the long plasma limit.
Images like those shown in Fig. 1 are obtained destructively Andresen et al. (2009). One of the electrostatic well walls that confine the mixed plasmas is lowered, thereby allowing the plasmas to flow out of the uniform solenoidal region (1 T or 3 T) and onto a micro-channel plate (MCP)/phosphor screen/CCD imaging system, yielding an axially-integrated image of the plasma densities. The MCP/phosphor is located far into the solenoid’s fringing field, in a field of only 0.024 T. Electrons follow the field lines well, but, because of their heavier mass, ’s are not as tightly bound to the field lines. We observe that initially overlapping e-’s and ’s image to different locations; the locations depend on the originating magnetic field magnitude and the distance the particles travel to the MCP/Phosphor. When these two factors are held fixed, the centers of the e- and images are constant for all variations of particle number and radial profile, and are independent of the presence or absence of the other species. Further, the magnetic system is astigmatic for ’s, and the resulting images are always elliptical. The response of the imaging system to ’s is more than greater than it is for e-’s because the annihilations greatly enhance the response Andresen et al. (2009), so the relative brightness of the e- and images can be deceiving. For instance, in Fig. 1b there are as many e-’s than ’s.
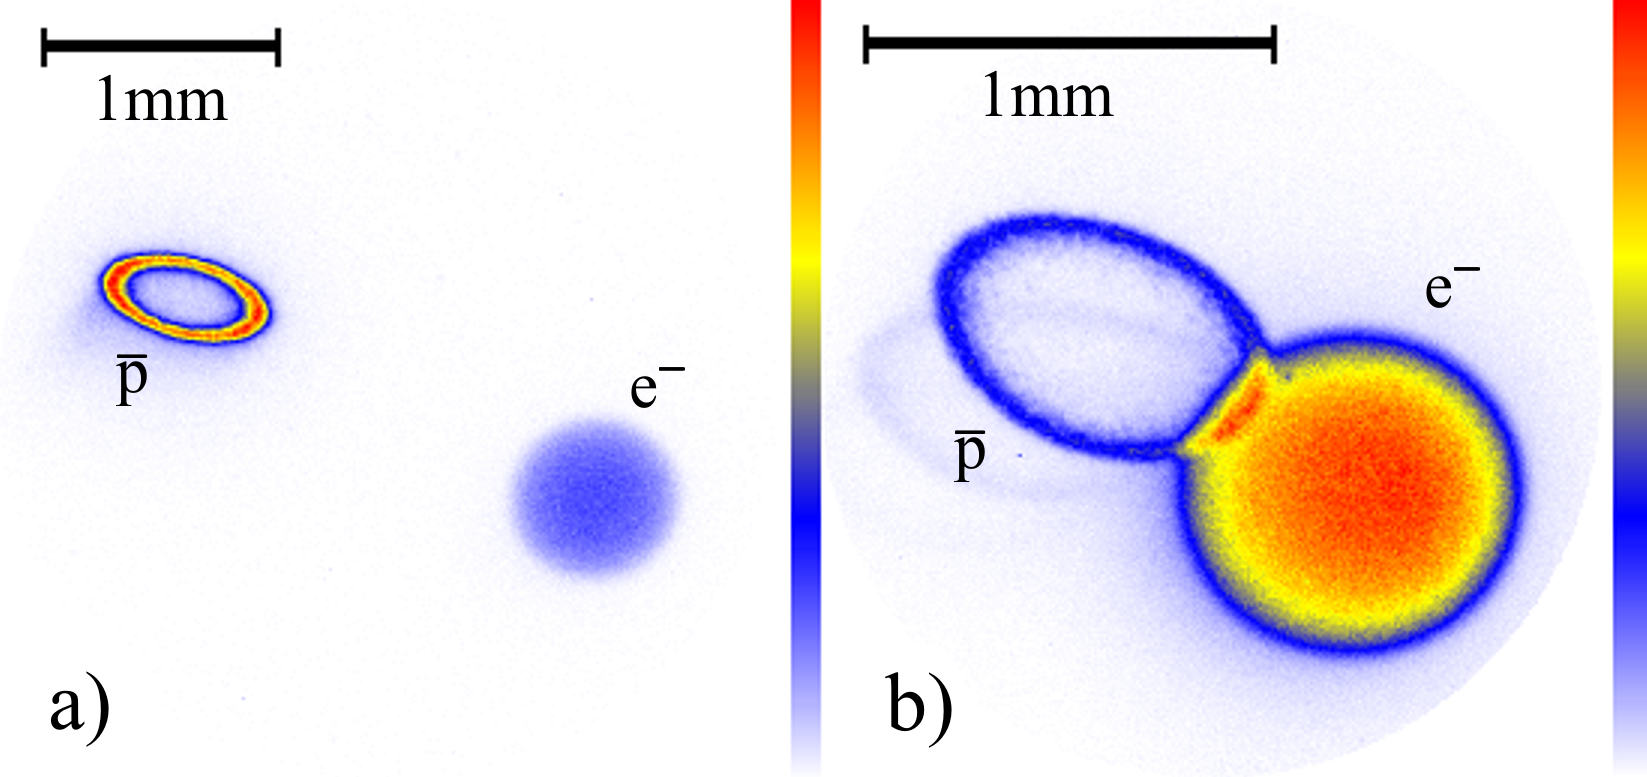
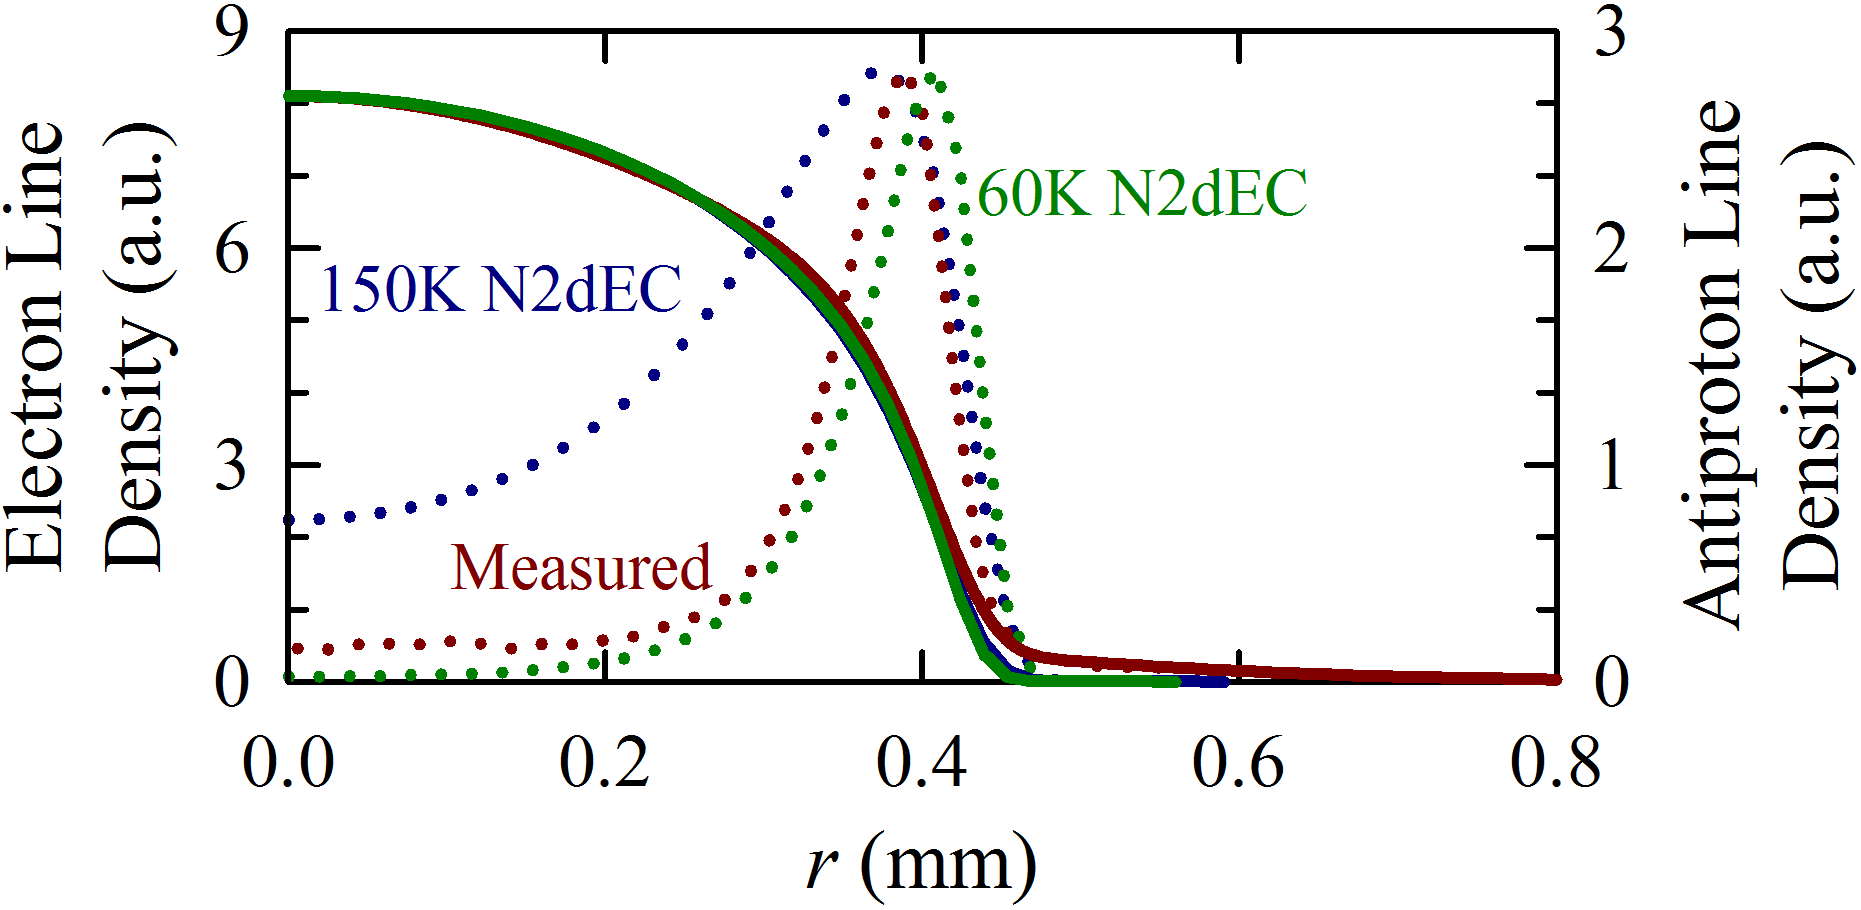
Figure 2 shows a scan of the equilibrium as a function of the radius of the e- plasma. In all cases, the plasmas contain approximately e-’s and ’s, and the average temperature for the series is Eggleston et al. (1992); Andresen et al. (2010a). The radius of the plasma was controlled by varying the amount of radial compression Andresen et al. (2008) applied to the plasma before the equilibrium was established. The central e- densities range from to . Under the constant total charge conditions of Fig. 2, the relative scale ratio is proportional to . Thus, we would expect that the e-’s and ’s would separate less as the plasma radius increases, a trend clearly observed in Fig. 2. Our plasmas are close to ellipsoids with length to diameter ratios of 30; to more accurately estimate the degree of separation, we developed a numeric, two-dimensional (–) equilibrium code (N2dEC) which includes the necessary finite-length effects Larson et al. (1986); Imajo et al. (1997); Gruber et al. (2001). Figure 3 replots the smallest radius plasma from Fig. 2, and the results of N2dEC calculations at bracketing temperatures. As the measured temperatures are subject to systematic and shot-by-shot errors, it is not surprising that the best-fit temperature demanded by the code does not perfectly match the measured temperature.
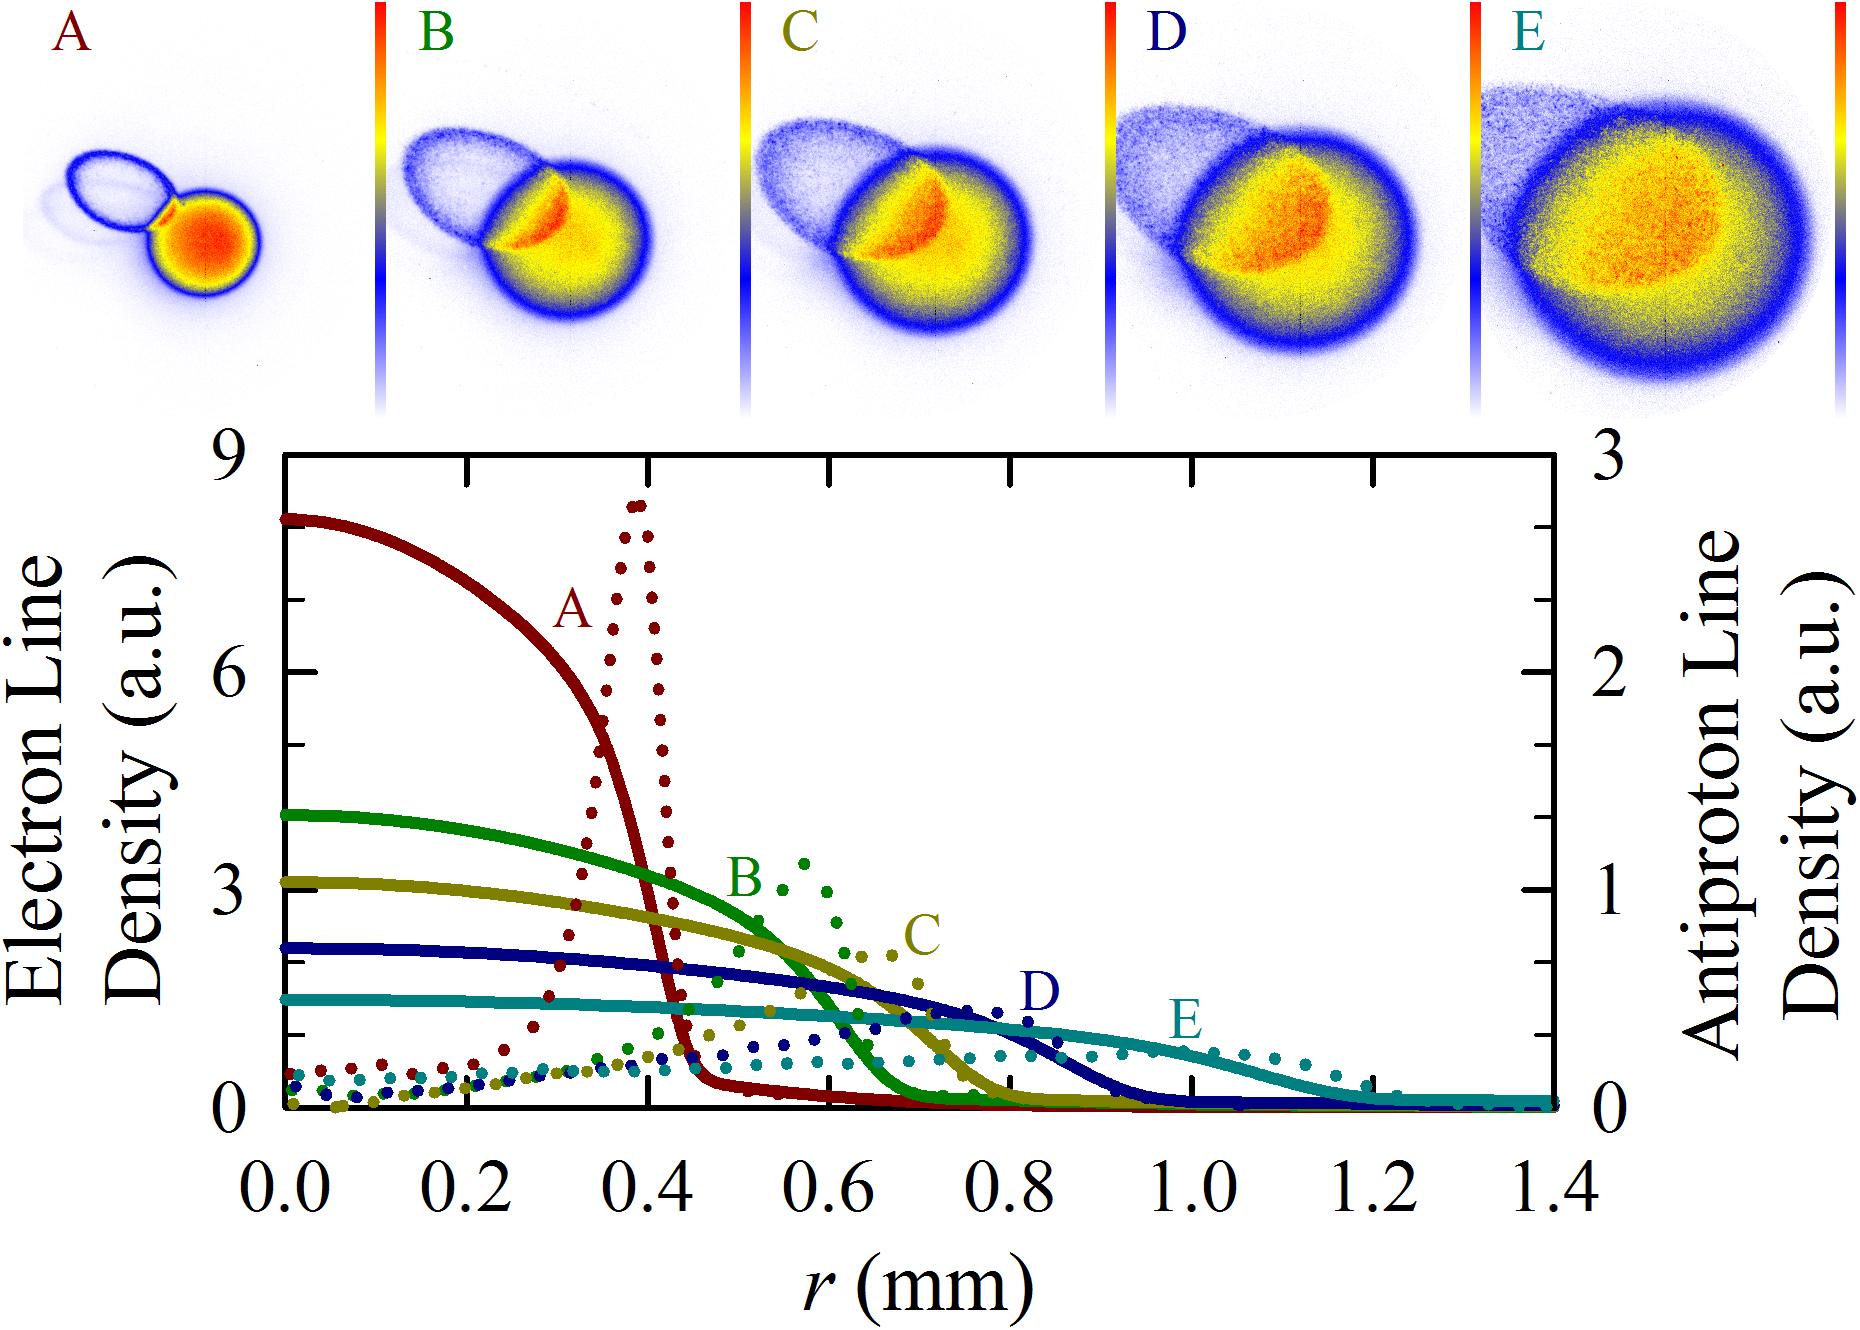
The line densities and (in later figures) moments used throughout this paper are computed from one-dimensional fits to the two dimensional images from the MCP/Phosphor. The fits also correct for the ellipticity of the images; charge along all points on any given ellipse is mapped to the major radius of that ellipse.
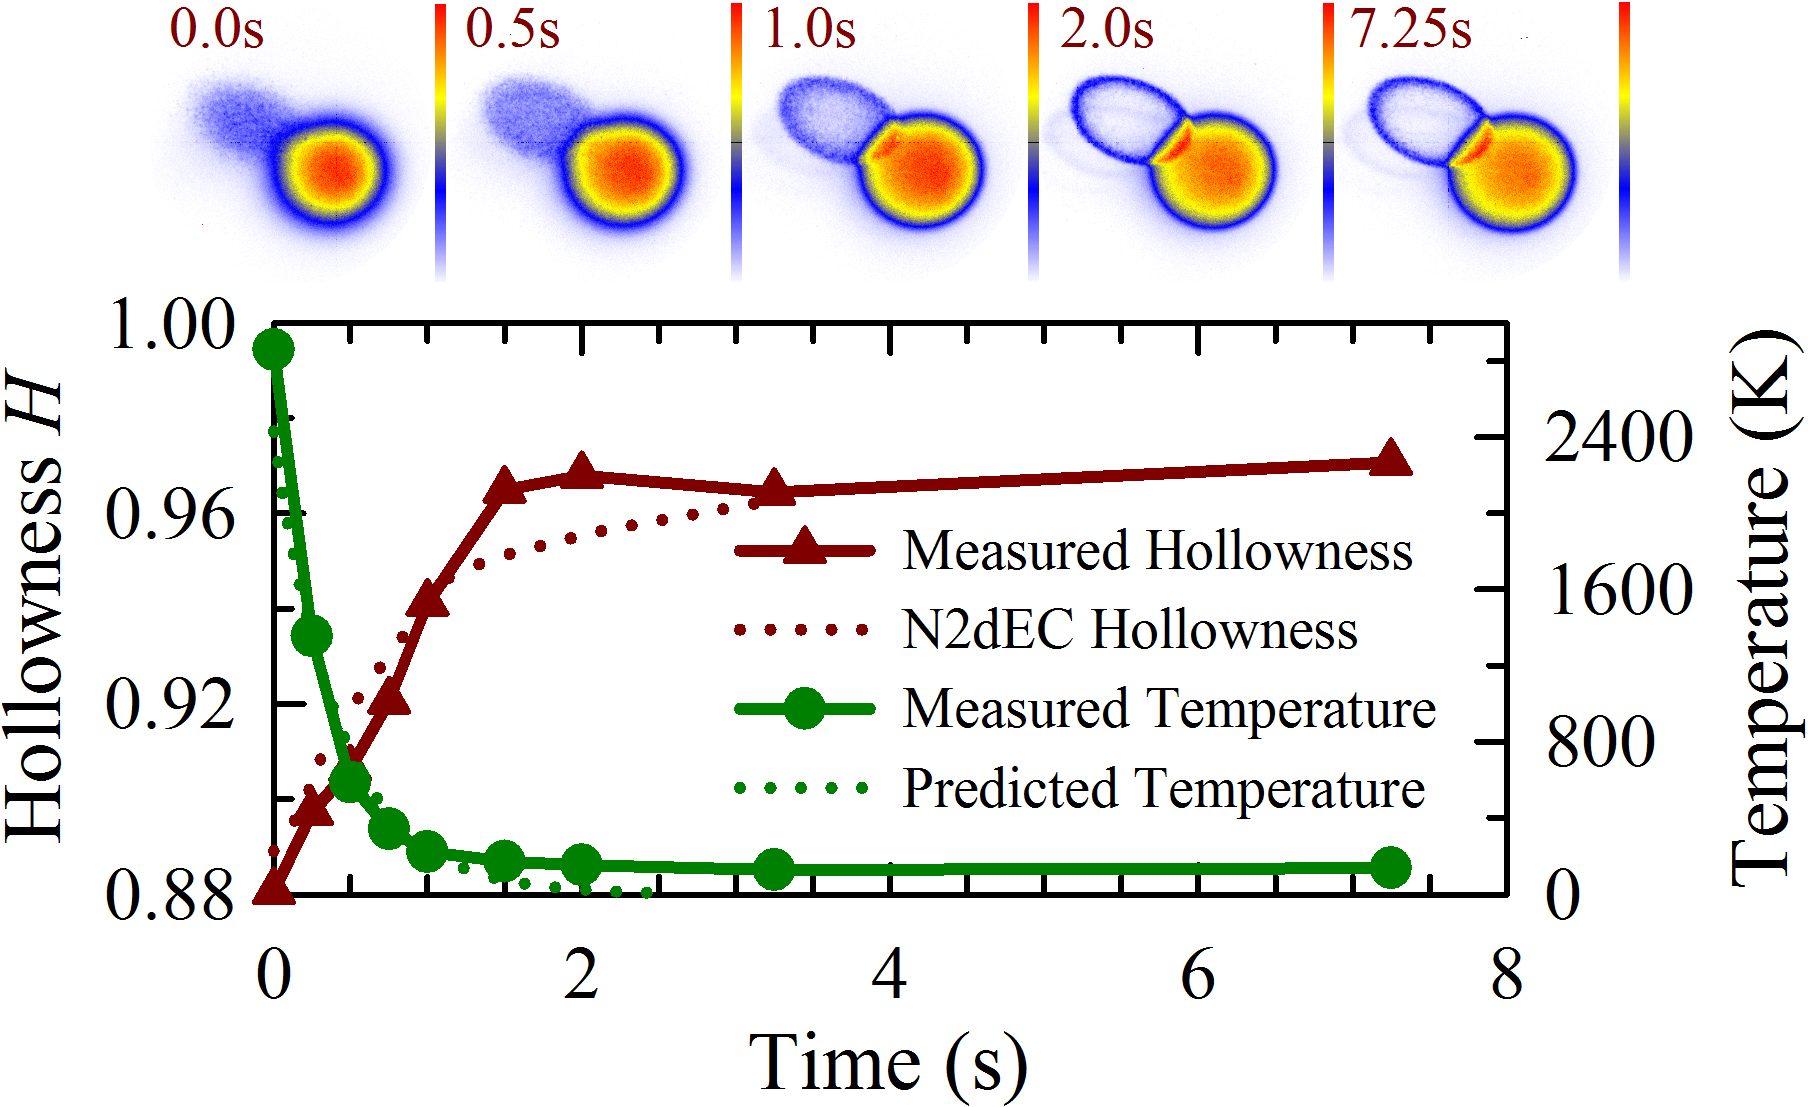
The e-’s in our plasmas cool via cyclotron radiation with a calculated e-folding time of 0.427 s at 3 T Beck et al. (1992); the e-’s cool the ’s by collisions. If we actively heat a mixed e-– plasma, we can watch the centrifugal separation reemerge as the plasma cools. Figure 4 shows the measured and predicted temperature as a function of time in such an experiment. The measured temperatures follow the predicted temperatures until they level off, for unknown reasons, at about 130 K. Figure 4 also shows the measured hollowness of the radial profile as a function of time, and predicted by N2dEC calculations at the measured temperatures. This metric is defined by , where denotes an average over the radial profile. for a Gaussian profile, for a constant density ellipsoid, and for a thin annulus. The value of is robust to many forms of experimental noise, and does not depend on the overall plasma radius, but is subject to a small offset if the background in the images is imperfectly subtracted. Figure 4 shows that the hollowness follows the plasma temperature, suggesting that the ’s go through a series of quasi-equilibrium states. No delay in attaining equilibrium is visible.
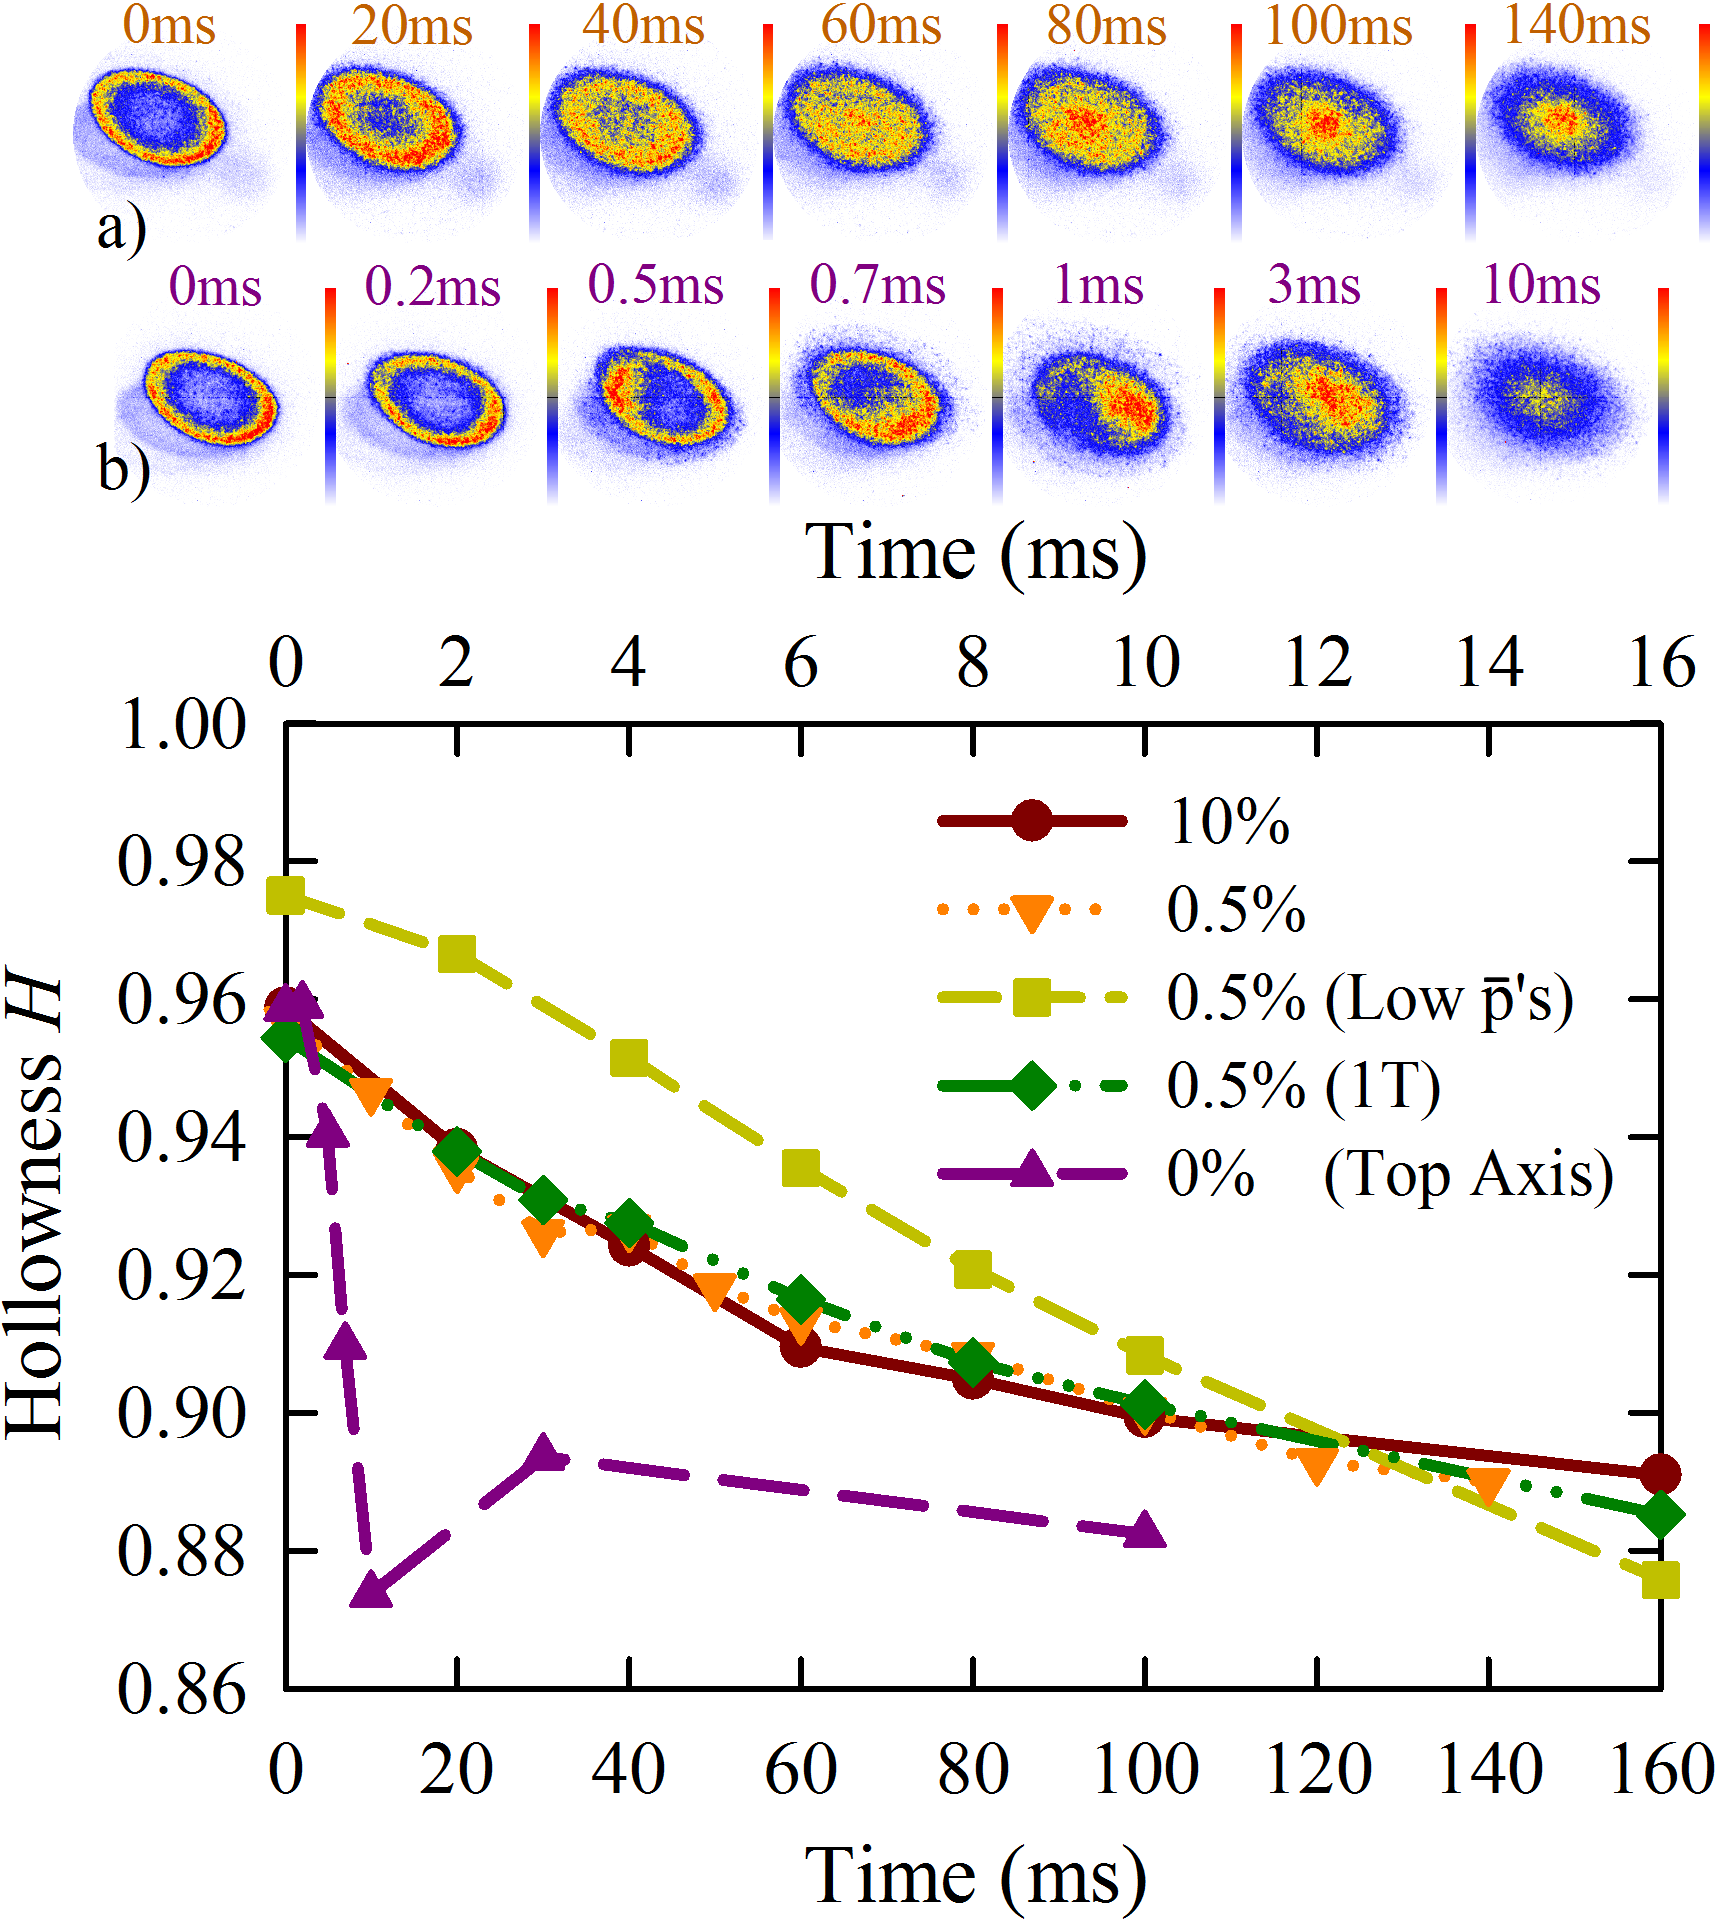
If we change the e- conditions suddenly, the ’s must relax to the new equilibrium corresponding to these new conditions. Figure 5 shows a study of this process when a specified fraction of the electrons is suddenly removed. This is accomplished by lowering an electrostatic well sidewall for a time short () compared to the time over which the ’s can move, but long enough for the required fraction of e-’s to escape. This process, called “e-kicking”, substantially heats the remaining e-’s to several thousand Kelvin. Several cases were studied: leaving 10% of the e-’s, so that the density of e-’s is ; leaving 0.5% of the e-’s, so that the density is ; leaving 0.5% of the e-’s, but with ’s rather than ’s as in all the other data; leaving 0.5% of the e-’s, but at 1 T rather than at 3 T as in all the other data; and leaving 0% of the e-’s.
The e-kicking process leaves the ’s in their initial, ring-like distribution, but, because the e- density is now low and the temperature now high, the final equilibrium profile is Gaussian-like. Considering the first four, non-0% cases only, the time to re-establish equilibrium (somewhat arbitrarily set at ) is approximately 60 ms (slightly longer for the low case.) The images (Fig. 5a) for this class of relaxation show no sign of instability; the center appears to fill in gradually and uniformly. The last case, in which all the e-’s are removed, is very different. The relaxation is approximately faster, and proceeds (Fig. 5b) via a classic diocotron instability Driscoll (1990). Three-dimensional molecular dynamics simulations verify that the plasmas are indeed unstable under these conditions. In the other cases, leaving even as few as 95,000 e-’s (the 0.5% case) reduces the rotational shear to below the threshold necessary to drive the instability.
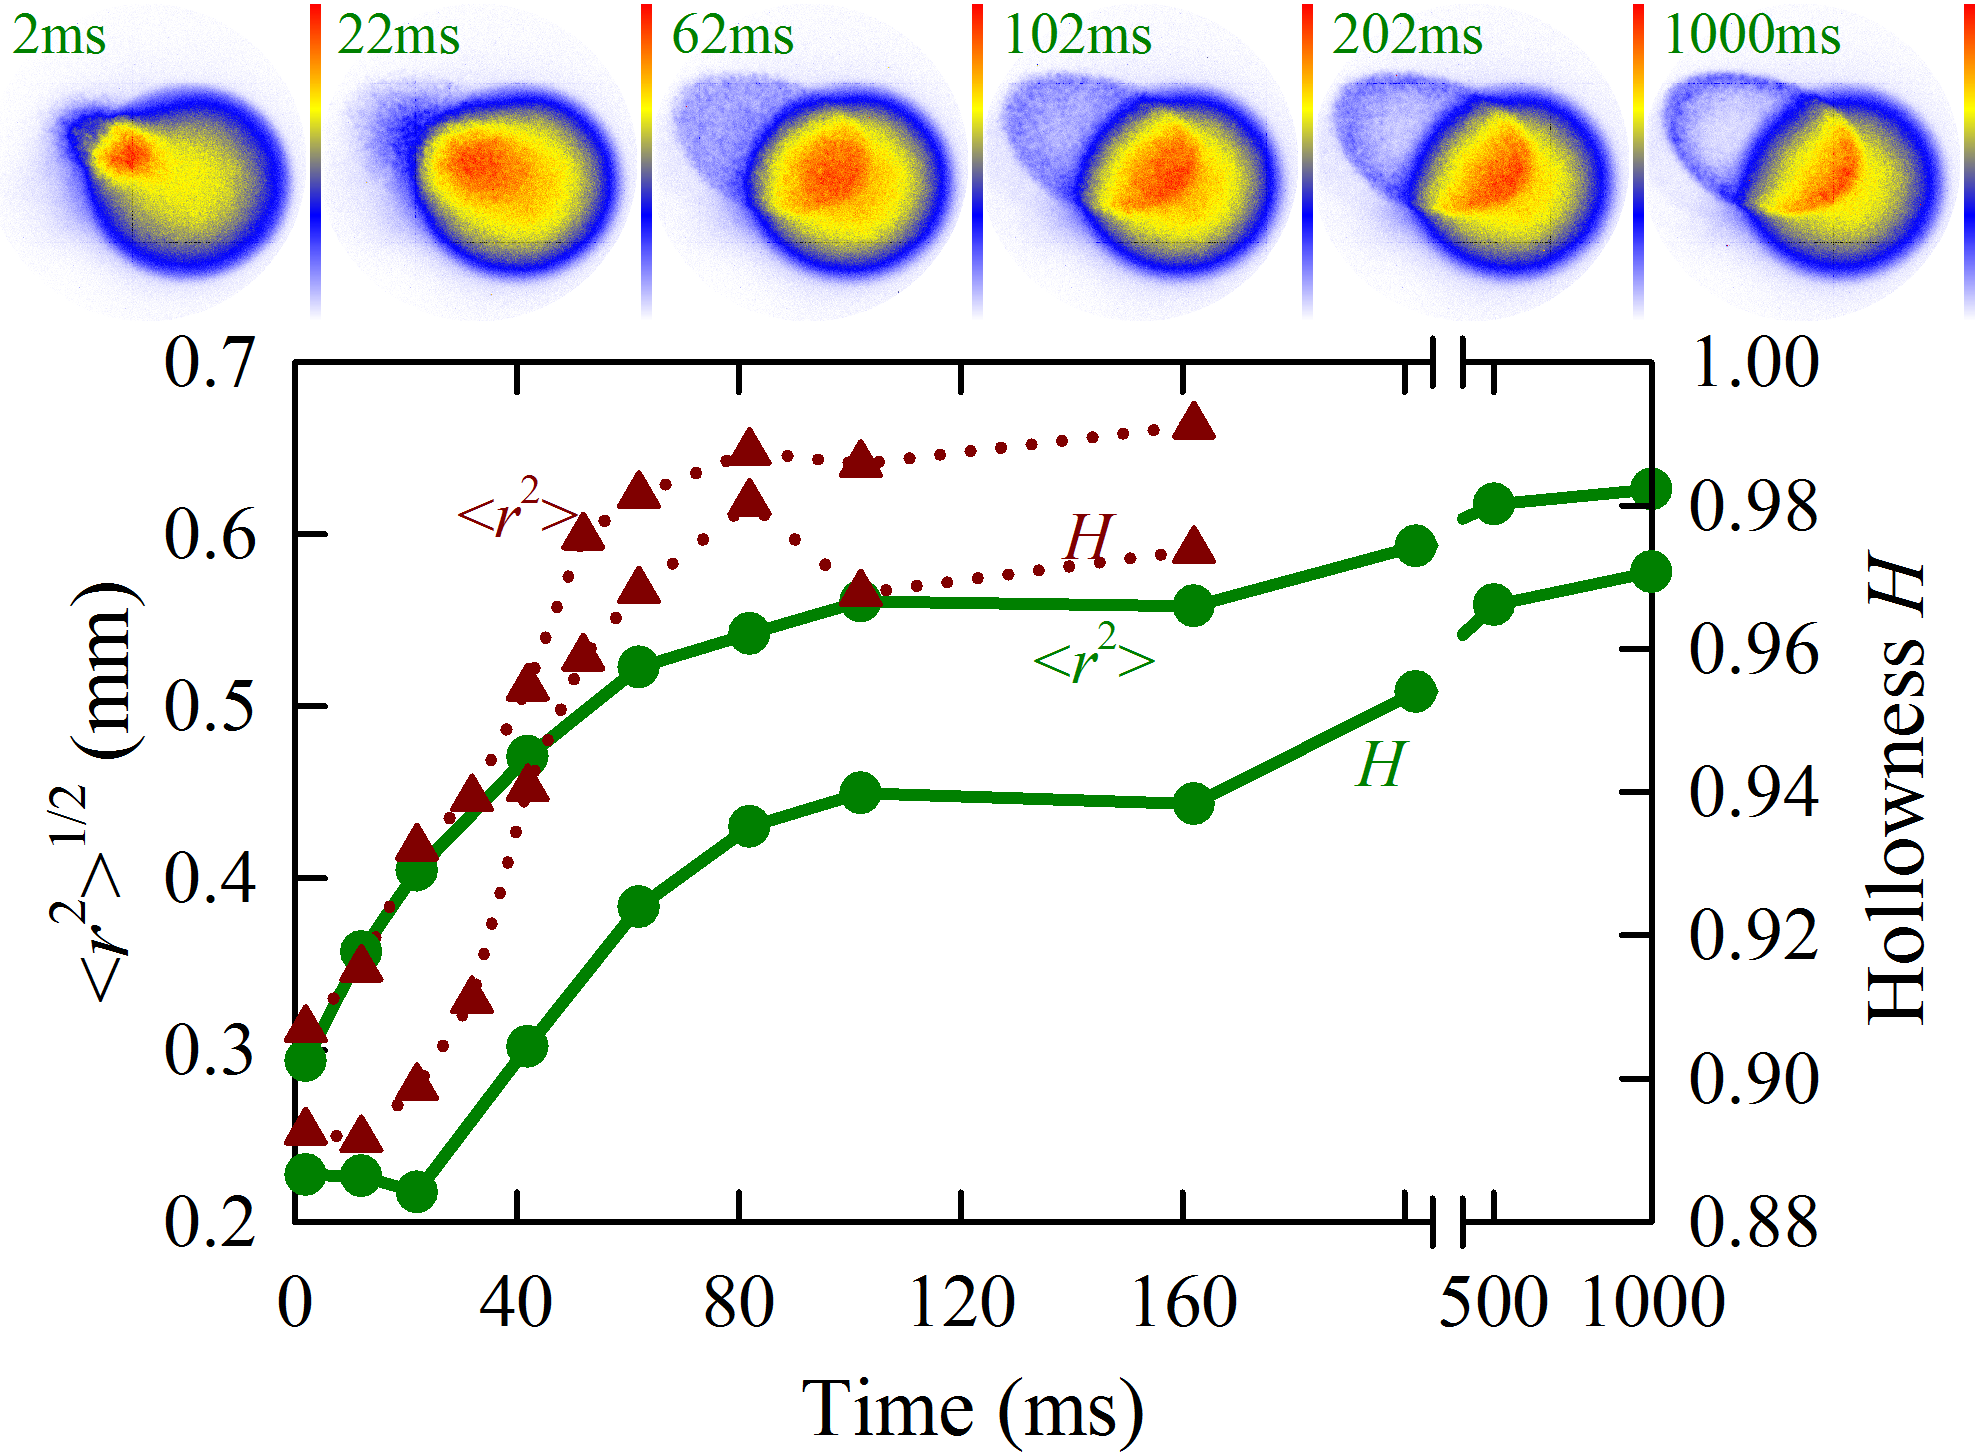
We have also studied the injection of a very small radius “slug” into a pre-existing, larger radius, cold e- plasma. We then track two distinct measures: the expansion of the slug out to the radius of the e-’s, and the subsequent hollowing of the ’s. Figure 6 shows two such series, corresponding to the injection of a standard load of ’s () into a standard e- plasma (Fig. 1b-like, but with an e- density of ), and injection of a reduced load of ’s () into the same e- plasma. The ’s begin to expand immediately, reaching a plateau after approximately 80 ms. Hollowing begins after about 20 ms, and plateaus shortly after the plasma stops expanding. Injecting the slug heats the e-’s, particularly for the standard load where the increase in temperature is approximately 150 K. The late-time evolution ( visible in the standard load series is probably due to the e- plasma radiating away the energy brought in during the injection. The reduced load heats the e- plasma less (approximately 50 K); consequently, it becomes hollow somewhat faster.
In conclusion, the ’s in an initially hot e- plasma appear to follow an evolving equilibrium as the e- cool. The evolution time scale is set by the cooling timescale. When all the e-’s supporting a well-developed ring equilibrium are removed (Fig. 5b), the ring collapses via an diocotron instability on a time scale of a few milliseconds. In all other observed cases (Fig. 5), including the injection of a slug into a cold e- plasma (Fig. 6), equilibration takes on the order of 60–80 ms. These cases range in e- density over a factor of nearly 30, in e- temperature over more than a factor of 10, in magnetic field over a factor of 3, and in number over a factor of 11. The relevant collision frequencies, gyro radii, Debye lengths, etc. will vary over a proportionate range. The equilibration time scale for the higher density, lower temperature data shown in Fig. 6 is compatible with the predictions of particle diffusion/mobility theory Dub (2010), but the data in Fig. 5 are not; the densities for these cases are too low, and the temperatures too high. Test particle calculations Amoretti et al. (2006) predict equilibration times that are too slow by several orders of magnitude, even for the data shown in Fig. 6. A more exotic theory appears to be required, perhaps like that in Ref. Dubin (2010).
The results presented here are relevant to several of the processes employed in antihydrogen () trapping experiments at CERN Andresen et al. (2007); Gabrielse et al. (2008). For example, e-’s are used to sympathetically cool the ’s, but are generally removed (e-kicked) before synthesis of is initiated. Our measurements are the first detailed exploration of the radial and temporal dynamics of the equilibration during this process. We have found it necessary to minimize the radius of the ’s to enhance the probability of trapping Andresen et al. (2010b); we do this by compressing the e-’s in a still mixed e-– plasma, and relying on equilibration between the two species to compress the ’s Andresen et al. (2008). Compressing the e-’s too quickly leaves some ’s behind; the measurements here give a lower bound for the compression scale time. Finally, in some proposed mixing schemes Hu (2007), the ’s and e-’s are left unseparated; the effects of centrifugal separation must be considered in these schemes.
This work was supported by CNPq, FINEP/RENAFAE (Brazil), ISF (Israel), MEXT (Japan), FNU (Denmark), VR (Sweden), NSERC, NRC/TRIUMF AIF FQRNT(Canada), DOE, NSF (USA), and EPSRC, the Royal Society and the Leverhulme Trust (UK). We thank D.H.E. Dubin for his helpful comments, and S. Kemp and C. Ø Rasmussen.
References
- O’Neil (1981) T. M. O’Neil, Phys. Flu. 24, 1447 (1981).
- Larson et al. (1986) D. J. Larson, J. C. Bergquist, J. J. Bollinger, W. M. Itano, and D. J. Wineland, Phys. Rev. Lett. 57, 70 (1986).
- Imajo et al. (1997) H. Imajo, K. Hayasaka, R. Ohmukai, U. Tanaka, M. Watanabe, and S. Urabe, Phys. Rev. A 55, 1276 (1997).
- Gruber et al. (2001) L. Gruber, J. P. Holder, J. Steiger, B. R. Beck, H. E. DeWitt, J. Glassman, J. W. McDonald, D. A. Church, and D. Schneider, Phys. Rev. Lett. 86, 636 (2001).
- Jelenković et al. (2003) B. M. Jelenković, A. S. Newbury, J. J. Bollinger, W. M. Itano, and T. B. Mitchell, Phys. Rev. A 67, 063406 (2003).
- Andresen et al. (2007) G. Andresen, W. Bertsche, A. Boston, P. D. Bowe, C. L. Cesar, S. Chapman, M. Charlton, M. Chartier, A. Deutsch, J. Fajans, M. C. Fujiwara, R. Funakoshi, D. R. Gill, K. Gomberoff, J. S. Hangst, R. S. Hayano, R. Hydomako, M. J. Jenkins, L. V. Jørgensen, L. Kurchaninov, N. Madsen, P. Nolan, K. Olchanski, A. Olin, A. Povilus, F. Robicheaux, E. Sarid, D. M. Silveira, J. W. Storey, H. H. Telle, R. I. Thompson, D. P. van der Werf, J. S. Wurtele, and Y. Yamazaki, Phys. Rev. Lett. 98, 023402 (2007), ALPHA Collaboration.
- Gabrielse et al. (2010) G. Gabrielse, W. S. Kolthammer, R. McConnell, P. Richerme, J. Wrubel, R. Kalra, E. Novitski, D. Grozonka, W. Oelert, T. Sefzick, M. Zielinski, J. S. Borbely, D. Fitzakerley, M. C. George, E. A. Hessels, C. H. Storry, M. Weel, A. Mullers, J. Walz, and A. Speck, Phys. Rev. Lett. (2010), ATRAP Collaboration. Centrifugal separation of antiprotons and electrons, in press.
- Andresen et al. (2009) G. B. Andresen, W. Bertsche, P. D. Bowe, C. C. Bray, E. Butler, C. L. Cesar, S. Chapman, M. Charlton, J. Fajans, M. C. Fujiwara, D. R. Gill, J. S. Hangst, W. N. Hardy, R. S. Hayano, M. E. Hayden, A. J. Humphries, R. Hydomako, L. V. Jørgensen, S. J. Kerrigan, L. Kurchaninov, R. Lambo, N. Madsen, P. Nolan, K. Olchanski, A. Olin, A. P. Povilus, P. Pusa, E. Sarid, S. Seif El Nasr, D. M. Silveira, J. W. Storey, R. I. Thompson, D. P. van der Werf, and Y. Yamazaki, Rev. Sci. Instrum. 80, 123701 (2009), ALPHA Collaboration.
- Eggleston et al. (1992) D. L. Eggleston, C. F. Driscoll, B. R. Beck, A. W. Hyatt, and J. H. Malmberg, Phys. Fluids B 4, 3432 (1992).
- Andresen et al. (2010a) G. B. Andresen, M. D. Ashkezari, M. Baquero-Ruiz, W. Bertsche, P. D. Bowe, E. Butler, C. L. Cesar, S. Chapman, M. Charlton, J. Fajans, T. Friesen, M. C. Fujiwara, D. R. Gill, J. S. Hangst, W. N. Hardy, R. S. Hayano, M. E. Hayden, A. Humphries, R. Hydomako, S. Jonsell, L. Kurchaninov, R. Lambo, N. Madsen, S. Menary, P. Nolan, K. Olchanski, A. Olin, A. Povilus, P. Pusa, F. Robicheaux, E. Sarid, D. M. Silveira, C. So, J. W. Storey, R. I. Thompson, D. P. van der Werf, D. Wilding, J. S. Wurtele, and Y. Yamazaki, Phys. Rev. Lett. 105, 013003 (2010a), ALPHA Collaboration.
- Andresen et al. (2008) G. B. Andresen, W. Bertsche, P. D. Bowe, C. C. Bray, E. Butler, C. L. Cesar, S. Chapman, M. Charlton, J. Fajans, M. C. Fujiwara, R. Funakoshi, D. R. Gill, J. S. Hangst, W. N. Hardy, R. S. Hayano, M. E. Hayden, R. Hydomako, M. J. Jenkins, L. V. Jørgensen, L. Kurchaninov, R. Lambo, N. Madsen, P. Nolan, K. Olchanski, A. Olin, A. Povilus, P. Pusa, F. Robicheaux, E. Sarid, S. Seif El Nasr, D. M. Silveira, J. W. Storey, R. I. Thompson, D. P. van der Werf, J. S. Wurtele, and Y. Yamazaki, Phys. Rev. Lett. 100, 203401 (2008), ALPHA Collaboration.
- Beck et al. (1992) B. R. Beck, J. Fajans, and J. H. Malmberg, Phys. Rev. Lett. 68, 317 (1992).
- Driscoll (1990) C. F. Driscoll, Phys. Rev. Lett. 64, 645 (1990).
- Dub (2010) (2010), D. H. E. Dubin, private communication.
- Amoretti et al. (2006) M. Amoretti, C. Canali, C. Carraro, V. Lagomarsino, A. Odino, G. Testera, and S. Zavatarelli, Phys. Plasmas 13, 012308 (2006).
- Dubin (2010) D. H. E. Dubin, Phys. Plasma (2010), Electrostatic waves and instabilities in multi-species nonneutral plasmas, in press.
- Gabrielse et al. (2008) G. Gabrielse, P. Larochelle, D. LeSage, B. Levitt, W. S. Kolthammer, R. McConnell, P. Richerme, J. Wrubel, A. Speck, M. C. George, D. Grzonka, W. Oelert, T. Sefzick, Z. Zhang, A. Carew, D. Comeau, E. A. Hessels, C. H. Storry, M. Weel, and J. Walz, Phys. Rev. Lett. 100, 113001 (2008), ATRAP Collaboration.
- Andresen et al. (2010b) G. B. Andresen, M. D. Ashkezari, M. Baquero-Ruiz, W. Bertsche, P. D. Bowe, C. C. Bray, E. Butler, C. L. Cesar, S. Chapman, M. Charlton, J. Fajans, T. Friesen, M. C. Fujiwara, D. R. Gill, J. S. Hangst, W. N. Hardy, R. S. Hayano, M. E. Hayden, A. J. Humphries, R. Hydomako, S. Jonsell, L. V. Jørgensen, L. Kurchaninov, R. Lambo, N. Madsen, S. Menary, P. Nolan, K. Olchanski, A. Olin, A.Povilus, P. Pusa, F. Robicheaux, E. Sarid, S. Seif El Nasr, D. M. Silveira, C. So, J. W. Storey, R. I. Thompson, D. P. van der Werf, D. Wilding, J. S. Wurtele, and Y. Yamazaki, Phys. Lett. B (2010b), 10.1016/j.physletb.2010.11.004, ALPHA Collaboration. Search for trapped antihydrogen, in press.
- Hu (2007) S. X. Hu, Phys. Rev. A 75, 010501 (2007).