A New Evolutionary Phase of Supernova Remnant 1987A
Abstract
We have been monitoring the supernova remnant (SNR) 1987A with Chandra observations since 1999. Here we report on the latest change in the soft X-ray light curve of SNR 1987A. For the last 1.5 yr (since day 8000), the soft X-ray flux has significantly flattened, staying (within uncertainties) at 5.7 10-12 erg cm-2 s-1 (corresponding to 3.6 1036 erg s-1) in the 0.5–2 keV band. This remarkable change in the recent soft X-ray light curve suggests that the forward shock is now interacting with a decreasing density structure, after interacting with an increasing density gradient over 10 yr prior to day 8000. Possibilities may include the case that the shock is now propagating beyond a density peak of the inner ring. We briefly discuss some possible implications on the nature of the progenitor and the future prospects of our Chandra monitoring observations.
1 INTRODUCTION
The known distance ( 50 kpc to the Large Magellanic Cloud [LMC]) and the identification of the progenitor (Sk –69∘202, a B3 I star) make SN 1987A a uniquely useful object for a detailed study of core-collapse supernova and the earliest stages of evolution of a supernova remnant (SNR). For the last 10 yr, SNR 1987A has been dominated by emission from the blast wave interacting with the dense circumstellar medium (CSM), dubbed “the inner ring”, which was produced by interaction between the slow equatorial wind from the progenitor’s red supergiant (RSG) phase and the fast spherical wind from the subsequent blue supergiant (BSG) phase (Burrows et al., 1995; Lundqvist & Fransson, 1991; Luo & McCray, 1991). We have been monitoring SNR 1987A with Chandra since 1999. Thanks to the high angular resolution, our Chandra monitoring observations have allowed us to reveal unprecedented details of the dynamical and thermal evolution of the hot gas in SNR 1987A (e.g., Burrows et al. 2000; Michael et al. 2002; Park et al. 2002,2004,2005,2006; Racusin et al. 2009). SNR 1987A has also been observed by XMM-Newton (e.g., Haberl et al. 2006; Sturm et al. 2010).
The evolution of SNR 1987A has been highlighted by two characteristic events: (1) the emergence of optically-bright hot spots since 1997 (day 3700) and (2) the up-turn in the soft X-ray light curve that was coincident with a deceleration in the radial expansion rate in 2004 (day 6000). The former indicated the start of the interaction between the blast wave and the dense protrusions that had grown inward along the surface of the inner ring (Michael et al., 2000). The latter was interpreted as the event of the blast wave reaching the main body of the inner ring (Park et al., 2005). The continuous propagation of the blast wave into and/or beyond the inner ring would provide an excellent observational opportunity to study chemical and density structures of the progenitor’s stellar winds and thus to reveal its detailed late-stage evolution.
Here we report the latest soft X-ray light curve from our Chandra monitoring observations. It is evident that the soft X-ray flux from SNR 1987A has been nearly constant over the last 1.5 yr. This recent X-ray light curve is in contrast to the rapid brightening for the prior 10 yr. This remarkable change in the light curve indicates that SNR 1987A may now be entering yet another evolutionary phase. In this Letter, we report this new behavior in the soft X-ray light curve and briefly discuss possible implications. This work is based on ACIS and HETGS zeroth-order observations that we have performed as of 2010 September. The detailed analysis of the first-order HETGS spectrum obtained by our monitoring observations will be presented elsewhere.
2 OBSERVATIONS & DATA REDUCTION
As of 2010 September, we have performed a total of twenty-two monitoring observations of SNR 1987A with the Advanced CCD Imaging Spectrometer (ACIS) and the High Energy Transmission Gratings Spectrometer (HETGS) on board Chandra. To mitigate increasing photon pileup effects in the ACIS data due to the continuous brightening of SNR 1987A, we have switched our monitoring instrument configuration from the ACIS to the HETGS since 2008 July (day 7800). The soft X-ray flux increase has been 10–15% per 6-month, and the cross-calibration of the observed flux between these configurations is critical to make a smooth, reliable transition. Thus, we have performed contemporaneous observations using both the ACIS and HETGS (separated by one week) for two epochs (2008 July and 2009 January). During the same time period, the correction tool for the charge transfer inefficiency (CTI) in the ACIS data has become available as part of the standard Chandra data reduction software CIAO. Thus, we adopted this standard CTI-correction instead of our previous method developed by Townsley et al. (2002). We carefully investigated the effect caused by these new instrument setup and CTI-correction method using the zeroth-order HETGS and bare ACIS data. The net effect is small (3% discrepancy in the observed 0.5–2 keV band flux, primarily caused by the new CTI-correction). This correction factor is accounted for in our updated X-ray light curves. We re-generated auxiliary response files for all twenty-two epochs using CALDB version 4.3.0. Other than these changes, we used the same data reduction process as that used in our previous work.
In the spectral analysis to measure the X-ray fluxes, we used the non-equilibrium ionization (NEI) plane shock model (Borkowski et al., 2001). We implemented the NEI version 2 in XSPEC with an augmented plasma model using the updated atomic data that account for the inner-shell lines111The updated model has been provided by K. Borkowski: cf. the discussion by Badenes et al. 2006.. To be consistent with our previous works, we used a two-component NEI shock model to fit the observed X-ray spectra. We varied the electron temperature, ionization timescale, and normalization for each of the soft and hard component in the model fits. We fixed elemental abundances for N, O, Ne, Mg, Si, S, and Fe at the best-fit values estimated by our deep Chandra grating data (Zhekov et al., 2006, 2009). We fixed the absorbing column at = 2.35 1021 cm-2 based on our previous work (Park et al., 2006). Our Chandra monitoring observations are summarized in Table 1. The observed X-ray fluxes for all Chandra monitoring observations are presented in Table 2. We estimated the ACIS pileup effect based on the event grade distribution (Park et al., 2007). In Table 2, the observed 0.5–2 keV band fluxes have been corrected for the pileup using the correction factor shown in Table 1.
3 Light Curve and Expansion Rate
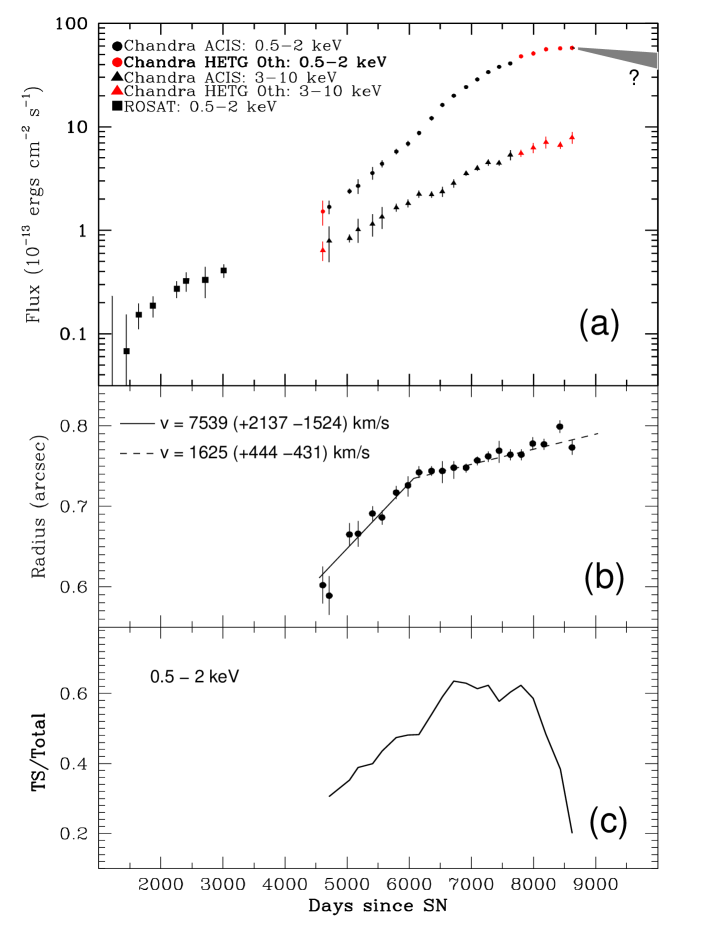
The latest X-ray light curves of SNR 1987A are shown in Figure 1a. As of 2010 September, the observed 0.5–2 keV band X-ray flux is 57.9 10-13 erg cm-2 s-1 ( 3.63 1036 erg s-1 at = 50 kpc, after correcting for = 2.35 1021 cm-2), which is 40 times brighter than it was in 1999 and nearly three orders of magnitude brighter than in 1992. While the X-ray flux has been significantly increasing over the last 20 yr, the latest data show that the X-ray flux increase rate has been significantly reduced. This is clearly seen in the soft band (0.5–2 keV) light curve (Figure 1a). For the last 1.5 yr, the 0.5–2 keV band X-ray flux has been nearly constant at 57 10-13 erg cm-2 s-1 ( 3.6 1036 erg s-1). This change is unclear in the 3–10 keV band, probably because of a lower flux increase rate and/or a physically different origin than the soft band emission. Upcoming monitoring observations are needed to reveal the nature of the hard band light curve. Nonetheless, the flattening of the soft X-ray light curve is compelling, and we discuss only the soft band light curve in this work.
Figure 1b shows the updated radial expansion rate. The radius of individual images (in the 0.3–8 keV band) and the expansion rate are estimated by the same methods described in Racusin et al. (2009). We tested any systematic discrepancy in the radius measurements between the ACIS and HETGS zeroth-order images using our cross-calibration data taken in 2008 July and 2009 January. We have also compared our radius estimates between the previous and current CTI corrections. These calibration results showed negligible discrepancies in the radius estimates (1%). Thus, for the data taken since 2008 July, we present the radial expansion rate based on the HETGS zeroth-order images with the standard CTI-correction method. The radial expansion rate has been consistent at 1600 km s-1 for the last 6 yr.
4 Discussion
Ever since the blast wave started interacting with dense protrusions of the inner ring at day 3700, the soft X-ray light curve showed a rapid flux increase (e.g., Park et al. 2004). During days 6000–6500, the soft X-ray light curve turned up to show a steeper flux increase rate than before (Park et al., 2005). This phase was interpreted such that the evolution of SNR 1987A entered a stage in which the shock is reaching the main body of the inner ring (Park et al., 2005). Such an interpretation was supported by the significant deceleration in the radial expansion rate at day 6000 (Racusin et al., 2009). Other observational supports included the substantial decrease in the line broadening measured by deep Chandra grating data (Zhekov et al., 2005, 2009; Dewey et al., 2008), the prevalence of optical spots all around the inner ring (McCray, 2005), and the significant IR flux increase (Bouchet et al., 2005) at the same epoch. These evolutions of the X-ray light curve, radial expansion rate, and individual line widths suggested that X-ray emission was dominated by the blast wave interacting with the low-density HII region before the inner ring until day 4000, and that since then soft X-rays primarily originate from the blast wave interacting with the dense inner ring. Recently, line fluxes from some individual optical spots showed a hint for flattening of the optical light curve at day 7000 (Gröningsson et al., 2008).
Our Chandra monitoring observations show that the flux increase rate appears to be lower at days 6500–8000 than at days 6000–6500 (i.e., as opposed to for days 6000–6500). Subsequently, the soft X-ray flux has been nearly constant for 1.5 yr (Figure 1a). The latest flattening of the X-ray light curve indicates that SNR 1987A is now entering another phase. Assuming that the observed X-ray flux is dominated by the interacting density, the X-ray flux can be considered to be proportional to the volume emission measure , where is the electron density and is the emission volume (Although there was a deceleration in the expansion rate at day 6000, the shock velocity has been constant since then. Also, the temperature dependence of the X-ray flux is small: i.e., (McKee & Cowie, 1977)). The exact geometry of the X-ray emitting volume in SNR 1987A is uncertain. Previous works suggested that the bulk of X-ray emission originates from a disk-like shell between the forward and reverse shocks, which encompasses the inner ring. An upper limit for such an emitting volume may be approximated by a spherical shell with an expanding thickness, thus where is the SNR radius. A lower limit of the X-ray emitting volume could be a circular disk with a small thickness, thus . These two cases can serve as conservative limits that are useful to approximate the temporal evolution of the X-ray emitting volume. The reality is likely in between these limits. For where = 1–3, the X-ray flux would be . Assuming that , we have . If we fit the light curve as a power law (PL), , then since the expansion is linear (Figure 1b), , and therefore = 2 + . This simple relation suggests that, for 6 during day 6500–8000, the blast wave was still interacting with a radially-increasing density ( for = 3, and for = 1), but at a lower rate than that ( for = 3, and for = 1) during day 6000–6500. Since day 8000 the flux has been constant, which corresponds to the shock interacting with a decreasing radial density profile ( for = 3, and for = 1). We note that our PL fit analysis is likely an oversimplification. We intend to provide insights on physical implications imposed by the recent flattening of the light curve. Quantitative interpretations inferred from these simple PL fits before day 8000 are far from conclusive.
These simple estimates of the density structure into which the blast wave is now propagating suggest that a significant fraction of X-ray emission is now coming from the shock interacting with a CSM having lower density than the densest region along the inner ring. Possible origins for such a change in the ambient density may include an intriguing scenario that the blast wave might have reached a density peak of the inner ring at day 8000, and that it is now propagating into a decreasing radial density beyond the inner ring. A likely scenario for the progenitor’s evolution before the explosion of SN 1987A is a BSG phase that had gone through an earlier RSG stage. The standard stellar evolutionary models predict an RSG wind with a constant velocity and a radially-decreasing density profile ( ). Our estimates of the latest radial density profile ( - ) suggest that the blast wave of SNR 1987A may be entering the RSG wind beyond the interacting layer between the BSG and RSG winds. If this is true, the soft X-ray light curve would eventually decrease at a rate of - (depending on ) as the shock would be interacting with the RSG wind ( ). If the overall RSG wind is spherical beyond the inner ring, is expected, which is generally consistent with standard SN models (Chevalier, 1982).
We note that Borkowski et al. (1997) predicted the soft X-ray light curve of SNR 1987A based on 2-dimensional hydrodynamic simulations. In their models, the soft X-rays are dominated by emission from dense gas that has been heated by shocks transmitted into the CSM ring as it is overtaken by the blast wave. The resulting soft X-ray light curves are sensitive to the assumed gas density, , in the inner ring. The X-ray flux in their model for = 32000 amu cm-3 reaches a peak value of = 6 10-12 erg cm-2 s-1 at = 17 yr, which roughly agrees with the observed results shown in Figure 1a ( = 5.7 10-12 erg cm-2 s-1 at = 23 yr). However, the actual hydrodynamics of the interaction are more complex than such simple simulations. While Borkowski et al. (1997) assumed that the CSM ring was a circular torus of constant density, the inner ring is not a circular torus, having many inward protrusions manifested by the optical spots (e.g., Sugerman et al. 2002). The density in the inner ring spans a range of a factor of 30 (Mattila et al., 2010). Nonetheless, these results suggest that more realistic 3-dimensional simulations for the interaction of the blast wave and the inner ring would help to reveal the detailed nature of the X-ray light curve.
Other models for SN 1987A include cases that the progenitor might have gone through a Luminous Blue Variable (LBV) phase (Smith, 2007), which most likely involved episodic eruptions of strong asymmetric stellar winds. In this scenario, the inner ring might have been the relic dense CSM produced by the latest LBV eruption before the SN. The radial density profile beyond the inner ring then might have a periodic “density wave”. Such a density structure may result in a periodic variation in the soft X-ray light curve in the future.
We also consider the latest soft X-ray light curve within the frame work of our reflected shock structure (RSS) model (Zhekov et al., 2010). The current radial expansion rate appears to be well-fitted by the RSS model, as the expansion rate stays the same until day 8600. The RSS model fit shows that the contribution in the soft X-ray emission from the transmitted shock into the densest region of the inner ring peaks at day 6700–7800, and then it significantly decreases after day 8000 (Figure 1c). These results generally support that soft X-ray emission originating from a low density region has recently become significant.
Although the scatter in the radius measurements appears to become large for the last 2 yr, we do not see clear evidence for an acceleration in the expansion as of 2010 September (Figure 1b). This is probably because the shock is in transition between the inner ring and the RSG wind, and our data may not yet be sensitive to an accelerated expansion rate. Or, the shock may still be interacting with the inner ring (see above discussion). Future Chandra observations are essential to monitor any change in the expansion rate as well as in X-ray light curves. We note that the X-ray radius of SNR 1987A (078 at day 8600) is slightly smaller than that of the optical inner ring (083, Jakobsen et al. [1991]). Our radius estimates are based on a simple image model (assuming 4-lobes and an underlying torus) fit to deconvolved images to measure the radius of the peak intensity of the SNR (Racusin et al., 2009). Other methods have been used to measure the size of the SNR in optical (Jakobsen et al., 1991) and radio bands (Ng et al., 2009). Thus, it is not surprising to see systematic offsets among the radius measurements in different wavelengths. Ng et al. (2009) confirmed that there is a systematic discrepancy (by 20 %) between the radio and X-ray measurements of the radius of SNR 1987A because of the different methods used for X-ray and radio data. Therefore, direct comparisons of the SNR’s angular size between different wavelength bands are difficult.
Our continuing Chandra monitoring observations of the X-ray flux and the expansion rate are essential to reveal the true origin for the dynamically changing soft X-ray light curve. The high resolution first-order HETGS data of our monitoring observations will be useful to reveal the spectral evolution of SNR 1987A. Particularly, our deep HETGS observation of SNR 1987A that is scheduled in 2011 March will be critical to study the detailed evolution of individual line broadenings and flux ratios, and thus the SNR’s evolutionary phase. If the contribution from the reverse shock in the observed X-ray emission has substantially increased, we may expect a bleaching-out of optical Lyα and Hα lines in near future due to photo-ionization (by X-ray photons) of neutral H just ahead of the reverse shock as predicted by Smith et al. (2005).
References
- Badenes et al. (2006) Badenes, C., Borkowski, K. J., Hughes, J. P., Hwang, U., & Bravo, E. 2006, ApJ, 645, 1373
- Borkowski et al. (1997) Borkowski, K. J., Blondin, J. M., & McCray, R. 1997, ApJ, 477, 281
- Borkowski et al. (2001) Borkowski, K. J., Lyerly, W. J., & Reynolds, S. P. 2001, ApJ, 548, 820
- Bouchet et al. (2005) Bouchet, P. et al. 2006, ApJ, 650, 212
- Burrows et al. (1995) Burrows, C. J. et al. 1995, ApJ, 452, 680
- Burrows et al. (2000) Burrows, D. N. et al. 2000, ApJ, 543, L149
- Chevalier (1982) Chevalier, R. A. 1982, ApJ, 258, 790
- Dewey et al. (2008) Dewey, D., Zhekov, S. A., McCray, R., Canizares, C. L., 2008, ApJ, 676, L131
- Gröningsson et al. (2008) Gröningsson, P., Fransson, C., Leibundgut, B., Lundqvist, P., Challis, P., Chevalier, R. A., & Spyromilio, J. 2008, A&A, 492, 481
- Haberl et al. (2006) Haberl, F., Geppert, U., Aschenbach, B., & Hasinger, G. 2006, A&A, 460, 811
- Hasinger et al. (1996) Hasinger, G., Aschenbach, B., & Trümper, J. 1996, A&A, 312, L9
- Jakobsen et al. (1991) Jakobsen, P. et al. 1991, ApJ, 369, L63
- Lundqvist & Fransson (1991) Lundqvist, P. & Fransson, C. 1991, ApJ, 380, 575
- Luo & McCray (1991) Luo, D. & McCray, R. 1991, ApJ, 379, 659
- Manchester et al. (2002) Manchester, R. N. et al. 2002, PASA, 19, 207
- Manchester et al. (2005) Manchester, R. N. et al. 2005, ApJ, 628, L131
- Mattila et al. (2010) Mattila, S., Lundqvist, P., Gröningsson, P., Meikle, P., Stathakis, R., Fransson, C., & Cannon, R. 2010, ApJ, 717, 1140
- McCray (2005) McCray, R. 2005, in “Cosmic Explosions”, Proc. IAU Colloquium No. 192, eds. J. M. Marcaide and K. W. Weiler, (Heidelberg: Springer), 77
- McKee & Cowie (1977) McKee, C. F. & Cowie, L. L. 1977, ApJ, 215, 213
- Michael et al. (2000) Michael, E. et al. 2000, ApJ, 542, L53
- Michael et al. (2002) Michael, E. et al. 2002 ApJ, 574, 166
- Ng et al. (2009) Ng, C.-Y., Gaensler, B. M., Murray, S. S., Slane, P. O., Park, S., Staveley-Smith, L., Manchester, R. N., & Burrows, D. N. 2009, ApJ, 806, L100
- Park et al. (2002) Park, S., Burrows, D. N., Garmire, G. P., Nousek, J. A., McCray, R., Michael, E., & Zhekov, S. A. 2002, ApJ, 567, 314
- Park et al. (2004) Park, S., Zhekov, S. A., Burrows, D. N., Garmire, G. P., & McCray, R. 2004, ApJ, 610, 275
- Park et al. (2005) Park, S., Zhekov, S. A., Burrows, D. N., & McCray, R. 2005, ApJ, 634, L73
- Park et al. (2006) Park, S., Zhekov, S. A., Burrows, D. N., Garmire, G. P., Racusin, J. L., & McCray, R. 2006, ApJ, 646, 1101
- Park et al. (2007) Park, S., Burrows, D. N., Garmire, G. P., McCray, R., Racusin, J. L., & Zhekov, S. A. 2007, AIPC, 937, 43
- Racusin et al. (2009) Racusin, J. L., Park, S., Zhekov, S. A., Burrows, D. N., Garmire, G. P., & McCray, R. 2009, ApJ, 703, 1752
- Smith et al. (2005) Smith, N., Zhekov, S. A., Heng, K., McCray, R., Morse, J. A., & Gladders, M. 2005, ApJ, 635, L41
- Smith (2007) Smith, N. AJ, 133, 1034
- Sturm et al. (2010) Sturm, R., Haberl, F., Aschenbach, B., & Hasinger, G. 2010, A&A, 515, 5
- Sugerman et al. (2002) Sugerman, B. E. K., Lawrence, S. S., Crotts, A. P. S., Bouchet, P., & Heathcote, S. R. 2002, ApJ, 572, 209
- Townsley et al. (2002) Townsley, L. K., Broos, P. S., Chartas, G., Moskalenko, E., Nousek, J. A., & Pavlov, G. G. 2002, Nucl. Instrum. Methods Phys. Res. A, 486, 716
- Zhekov et al. (2005) Zhekov, S. A., McCray, R., Borkowski, K. J., Burrows, D. N., & Park, S. 2005, ApJ, 628, L127
- Zhekov et al. (2006) Zhekov, S. A., McCray, R., Borkowski, K. J., Burrows, D. N., & Park, S. 2006, ApJ, 645, 293
- Zhekov et al. (2009) Zhekov, S. A., McCray, R., Dewey, D, Canizares, C. R., Borkowski, K. J., Burrows, D. N., & Park, S. 2009, ApJ, 692, 1190
- Zhekov et al. (2010) Zhekov, S. A., Park, S., McCray, R., Racusin, J. L., & Burrows, D. N. 2010, MNRAS, 407, 1157
| ObsID | Date | AgeaaDays since the SN explosion. | InstrumentbbFor HETG, the zeroth-order data are used. The frame-time is shown in parentheses. | Exposure | Counts | CorrectionccThis is the flux correction factor accounting for the CCD pileup and cross-calibration with our previous CTI-correction method (by Townsley et al.) that was adopted before 2008 July. |
|---|---|---|---|---|---|---|
| (ks) | ||||||
| 124, 1387 | 1999 October | 4609 | HETG (3.1 s) | 116.1 | 690 | 1.02 |
| 122 | 2000 January | 4711 | ACIS-S3 (3.2 s) | 8.6 | 607 | 1.05 |
| 1967 | 2000 December | 5038 | ACIS-S3 (3.2 s) | 98.8 | 9030 | 1.04 |
| 1044 | 2001 April | 5176 | ACIS-S3 (3.2 s) | 17.8 | 1800 | 1.04 |
| 2831 | 2001 December | 5407 | ACIS-S3 (3.1 s) | 49.4 | 6226 | 1.06 |
| 2832 | 2002 May | 5561 | ACIS-S3 (3.1 s) | 44.3 | 6427 | 1.10 |
| 3829 | 2002 December | 5791 | ACIS-S3 (3.1 s) | 49.0 | 9277 | 1.08 |
| 3830 | 2003 July | 5980 | ACIS-S3 (3.1 s) | 45.3 | 9668 | 1.12 |
| 4614 | 2004 January | 6157 | ACIS-S3 (3.1 s) | 46.5 | 11856 | 1.18 |
| 4615 | 2004 July | 6359 | ACIS-S3 (1.5 s) | 48.8 | 17979 | 1.10 |
| 5579, 6178 | 2005 January | 6533 | ACIS-S3 (0.4 s) | 48.3 | 24939 | 1.02 |
| 5580, 6345 | 2005 July | 6716 | ACIS-S3 (0.4 s) | 44.1 | 27048 | 1.04 |
| 6668 | 2006 January | 6914 | ACIS-S3 (0.4 s) | 42.3 | 30940 | 1.04 |
| 6669 | 2006 July | 7095 | ACIS-S3 (0.4 s) | 36.4 | 30870 | 1.05 |
| 7636 | 2007 January | 7271 | ACIS-S3 (0.4 s) | 33.5 | 32798 | 1.06 |
| 7637 | 2007 July | 7446 | ACIS-S3 (0.4 s) | 25.7 | 27945 | 1.07 |
| 9142, 9806 | 2008 January | 7626 | ACIS-S3 (0.2 s) | 9.3 | 12008 | 1.04 |
| 9144 | 2008 JulyddFor this epoch, simultaneous observations with the ACIS and HETG were performed to calibrate fluxes between two detectors. We here present only HETG data. | 7799ddFor this epoch, simultaneous observations with the ACIS and HETG were performed to calibrate fluxes between two detectors. We here present only HETG data. | HETGddFor this epoch, simultaneous observations with the ACIS and HETG were performed to calibrate fluxes between two detectors. We here present only HETG data. (1.1 s) | 42.0 | 5174 | 1.03 |
| 10852, 10221 | 2009 JanuaryddFor this epoch, simultaneous observations with the ACIS and HETG were performed to calibrate fluxes between two detectors. We here present only HETG data. | 7997ddFor this epoch, simultaneous observations with the ACIS and HETG were performed to calibrate fluxes between two detectors. We here present only HETG data. | HETGddFor this epoch, simultaneous observations with the ACIS and HETG were performed to calibrate fluxes between two detectors. We here present only HETG data. (1.1 s) | 71.5 | 9447 | 1.03 |
| 10853, 10854 | ||||||
| 10855 | ||||||
| 10222, 10926 | 2009 July/ | 8202 | HETG (1.1 s) | 58.2 | 8505 | 1.03 |
| September | ||||||
| 12125, 12126 | 2010 March | 8429 | HETG (1.0 s) | 63.9 | 9332 | 1.03 |
| 11090 | ||||||
| 13131, 11091 | 2010 September | 8619 | HETG (1.0 s) | 54.4 | 8361 | 1.03 |
| AgeaaDays since the SN explosion. | FluxbbObserved X-ray fluxes are in units of 10-13 erg cm-2 s-1. Errors are with 90% confidence level, estimated by “flux error” command in XSPEC. | FluxbbObserved X-ray fluxes are in units of 10-13 erg cm-2 s-1. Errors are with 90% confidence level, estimated by “flux error” command in XSPEC. |
|---|---|---|
| (days) | (0.5–2 keV) | (3–10 keV) |
| 4609 | 1.520.41 | 0.640.13 |
| 4711 | 1.680.25 | 0.790.30 |
| 5038 | 2.380.14 | 0.840.08 |
| 5176 | 2.680.43 | 1.020.27 |
| 5407 | 3.570.50 | 1.150.28 |
| 5561 | 4.390.35 | 1.350.33 |
| 5791 | 5.770.35 | 1.660.15 |
| 5980 | 6.880.41 | 1.820.16 |
| 6157 | 8.700.44 | 2.240.18 |
| 6359 | 12.110.61 | 2.210.16 |
| 6533 | 16.260.81 | 2.370.26 |
| 6716 | 19.950.80 | 2.850.26 |
| 6914 | 24.230.73 | 3.540.18 |
| 7095 | 28.720.86 | 3.980.24 |
| 7271 | 33.760.68 | 4.520.32 |
| 7446 | 37.911.14 | 4.460.27 |
| 7626 | 40.891.64 | 5.360.59 |
| 7799 | 47.931.92 | 5.550.44 |
| 7997 | 51.102.56 | 6.280.69 |
| 8202 | 56.072.80 | 7.100.92 |
| 8429 | 57.252.30 | 6.660.53 |
| 8619 | 57.892.90 | 7.881.02 |