Spin canted magnetism, decoupling of charge and spin ordering in NdNiO3
Abstract
We report detailed magnetization measurements on the perovskite oxide NdNiO3. This system has a first order metal-insulator (M-I) transition at about 200 K which is associated with charge ordering. There is also a concurrent paramagnetic to antiferromagnetic spin ordering transition in the system. We show that the antiferromagnetic state of the nickel sublattice is spin canted. We also show that the concurrency of the charge ordering and spin ordering transitions is seen only while warming up the system from low temperature. The transitions are not concurrent while cooling the system through the M-I transition temperature. This is explained based on the fact that the charge ordering transition is first order while the spin ordering transition is continuous. In the magnetically ordered state the system exhibits ZFC-FC irreversibility, as well as history-dependent magnetization and aging. Our analysis rules out the possibility of spin-glass or superparamagnetism and suggests that the irreversibility arises from magnetocrystalline anisotropy and domain wall pinning.
pacs:
75.60.-d , 75.60.Ej , 71.30.+hI Introduction
The rare earth nickelates (RNiO3, R La) have been under active investigation for the past two decades because of the interesting electronic and magnetic properties exhibited by these systems.Medarde ; Catalan These oxides undergo a bandwidth controlled metal-insulator (MI) transition on changing the temperature, chemical or hydrostatic pressure.Torrance ; Obradors ; Canfield ; Zhou ; Ashutosh In the metallic state the structure of these nickelates is that of an orthorhombic distorted perovskite with space group .P.Lcorre The metal to insulator transition occurs with a structural transition which consists of an increase in the unit cell volume, a decrease in Ni-O-Ni bond angle and a symmetry lowering from orthorhombic to monoclinic . The symmetry lowering is understood in terms of charge ordering with a charge disproportionation 2Ni Ni Ni3-δ with .Alonso_1 ; Alonso_2 ; Alonso_3 ; Alonso_4 ; Staub ; Medarde1 In the early reports, the M-I transition of these compounds was attributed to the opening of an Ni-O charge transfer gap created by band narrowing.Torrance But the occurrence of charge ordering at the M-I transition and some recent theoretical calculations suggest that the M-I transition owes its origin to the opening of a gap between the spin up band of Ni3-δ and the hardly spin polarized band of Ni3+δ.Mazin In these compounds the higher temperature phase is metallic and the lower temperature phase is insulating. The M-I transition is of first order and is associated with a large thermal hysteresis and time dependent effects in transport properties such as resistivity and thermopower.Granados ; Devendra ; Devendra1 ; Devendra2 During the cooling process, in the temperature window where hysteresis is seen, these compounds phase separate into insulating and supercooled metallic regions. The supercooled regions are metastable and they switch over to the insulating state stochastically giving rise to time dependence and hysteresis in transport properties.Devendra ; Devendra1 ; Devendra2
The nickelates also undergo a temperature driven magnetic transition, which is relatively less studied, because the higher magnetic moment of rare earth ion (e.g. Nd3+ moment ) makes it difficult to get any information about the magnetic ordering of the Ni sublattice (Ni3+ moment ) through magnetization measurements.Blasco ; Perez ; Medarde Muon spin rotation experiments of Torrance et al. show that these compounds undergo a magnetic ordering from paramagnetic to an antiferromagnetic state on lowering the temperature.Torrance The magnetic ordering temperature () coincides with the M-I transition temperature () for PrNiO3 and NdNiO3, while it is lower than for all the other nickelates. The magnetic transition is of second order for all nickelates having , Perez1 ; Caytuero but for NdNiO3 and PrNiO3 where , the nature of the magnetic transition is difficult to probe independently. While one would expect the magnetic transition to be continuous as seen in other members of the series we note that there is at least one report which goes against this expectation and claim that the said transition is of first order.Caytuero
Neutron diffraction experiments show that, below , the magnetic arrangement of Ni moments is characterized by the propagation vector (,0,) which suggests three possible magnetic structures, of which, two are collinear and one is non-collinear.Garc ; Garc1 ; Alonso_1 ; Casais ; Giovannetti The collinear magnetic structure consists of up-up down-down stacking of Ni magnetic moments, where each Ni moment is antiferromagnetically coupled to three of its nearest neighbors and ferromagnetically to the remaining three nearest neighbours. This magnetic structure implies that the orbital degeneracy of Ni3+ electrons should be lifted by an orbital ordering, a prediction which has not gathered any experimental support so far.Garc1 Soft X-ray resonant scattering experiments at the Ni edges show that the (,0,) reflections are purely of magnetic origin with no orbital contribution whatsoever thus more or less ruling out collinear magnetic order in the system.Scagnoli In fact, the orbital degeneracy of the Ni3+ electron is found to be lifted by charge-orderingMazin and this supports the existence of a non-collinear magnetic structure which does not require orbital ordering. The low temperature specific heat data and the resonant soft X-ray diffraction data of induced Nd magnetic moment in NdNiO3 indicate that, in all likelihood, the ordering of Ni moments in NdNiO3 is non-collinear.Bartolome ; Scagnoli1
In this work, for the first time, we report the magnetization of the Ni sublattice, which we extracted after carefully subtracting the contribution of the Nd moments from the total magnetization. The magnetization of the Ni sublattice shows weak ferromagnetism which indicates that the magnetic arrangement of the Ni moments is perhaps canted. The existence of weak ferromagnetism cannot be understood in terms of the magnetic structures referred to in the previous paragraph, even the noncollinear ones. This suggests that those magnetic structures do not represent the true picture and the actual magnetic arrangement of Ni moments could be quite different from what has been thought of so far. Further, we found that the supercooled metallic phase is magnetically ordered which indicates that the transition, on cooling, from the paramagnetic to the antiferromagnetic state happens at the nominal transition temperature ( 200 K) unlike the metal-insulator transition which is broadened and happens at lower temperatures as the supercooled metallic regions switch to the insulating phase stochastically. This shows that the connection between the magnetic transition and the metal-insulator transition is rather weak and they do decouple if the system is supercooled. Also, the magnetization of the Ni sublattice shows features such as FC-ZFC irreversibility which is indicative of the presence of frustration in the weak ferromagnetic state.
II Experimental Details
High quality polycrystalline NdNiO3 pellets were prepared by a liquid mixture technique described elsewhere.Massa
All the magnetic measurements were performed in a SQUID magnetometer (Quantum Design, MPMS XL). Since, in this work, we are trying to extract the small signal from the Ni moments buried under the much larger signal from the Nd moments it is a sine qua non that we are absolutely sure about the quality of the data. The magnetic signal from the samples of NdNiO3 and NdGaO3, each of mass about 120mg, is 0.00262 emu and 0.00159 emu respectively at 150 K and 500 G. These numbers are more than three orders of magnitude higher than the level where artifacts start distorting the measured data.Ney Further, the sample holders used in SQUID measurements can give rise to misleading results when the background signal from the sample holder becomes large enough so that it can no longer be ignored compared to the signal from the sample.Casa In our case, the sample holder is a piece of straw which gives a temperature independent signal of about emu at 500 G which is about 600 times smaller than the signal from the NdNiO3 sample at 150 K. From the aforementioned we see that artifacts or extraneous contributions are negligible compared to the magnetic signal of NdNiO3, and thus, our SQUID data can be confidently used for the critical analysis we are setting out to do.
The field dependent resistivity measurements were performed in a home made cryostat placed between the pole pieces of a large electromagnet. More details on the resistivity measurements are available in one of our earlier publications.Devendra
III Results and Discussion
III.0.1 Magnetization measurements
Figure 1 shows the magnetization of NdNiO3 and NdGaO3 in FC, ZFC and FCC protocols at 500 Oe. In the FC protocol we cool the sample in the presence of a specified field and then record the magnetization while slowly warming up the sample keeping the field fixed. In the ZFC protocol we cool the sample in zero field to the lowest temperature and then apply the specified field and record the magnetization while warming up. In FCC protocol the magnetization is recorded while cooling in the specified field. The magnetization plots of NdNiO3 show a shoulder around 200 K attributable to the ordering of Ni moments. We see that below 200 K the magnetization of NdNiO3 depends on the experimental protocol. The FCC magnetization is slightly higher than the FC magnetization while ZFC magnetization is lower than both FCC and FC magnetizations. Above 200 K, the FCC, FC, and ZFC curves overlap and are indistinguishable. The existence of thermal and magnetic history dependence in magnetization suggests that the system is not in thermodynamic equilibrium below 200 K. In contrast, for the reference sample NdGaO3, the magnetization values in FCC, FC, and ZFC protocol coincide and follow the Curie law.
| Field (Oe) | C | ||||
|---|---|---|---|---|---|
| 1000(FC) | 0.043(4) | 125(6) | 0.00095(2) | 1.314 | 0.99916 |
| 1000(ZFC) | 0.043(4) | 126(6) | 0.00095(2) | 1.271 | 0.99920 |
To extract the magnetization of Ni sublattice from the experimental data we subtract the contribution of Nd moments from that of NdNiO3. The Nd magnetic moment is estimated from the magnetization data of NdGaO3 which has the same crystal structure and almost the same lattice parameters as NdNiO3.Devendra2 Since gallium and oxygen ions have no magnetic moment, the magnetization of NdGaO3 arises only from the contributions of the Nd moments sitting at the A sites of the perovskite structure. By subtracting the NdGaO3 magnetization (per mole) from that of NdNiO3 we should be able to calculate the magnetization of Ni sublattice, provided Nd moments behave in the same fashion in both NdGaO3 and NdNiO3. Unfortunately this method runs into rough weather because the Nd moments in NdNiO3 tend to order at low temperature aided by the ordering of the Ni sublattice.
Neutron diffraction measurements on bulk NdNiO3 show that the magnetic ordering of Nd moments starts below 40 K,Garc1 ; Garc2 while the synchrotron radiation data on thin films of NdNiO3 suggest that magnetic ordering of Nd moments starts at T but becomes significant only at low temperatures below 70 K.Scagnoli1 The higher Nd ordering temperature seen in the thin films may have a possible connection with the epitaxial strain in the films.Baena The ordering of Nd moments is thought to be induced by the direct exchange interaction with the neighboring Ni moments and is antiferromagnetic in nature while the Nd moments in NdGaO3 remain paramagnetic throughout the temperature range (See Ref. Scagnoli1, and Fig. 1). So on cooling below the magnetic ordering temperature of Nd, the difference in the magnetization of NdNiO3 and NdGaO3 would drop drastically because the contribution of Nd moments to the magetization of NdNiO3 would fall due to their antiferromagnetic ordering. In our case, such a drastic drop in the difference in magnetization of NdNiO3 and NdGaO3 is seen to occur below about 50 K as is clear from the inset of Fig. 1. This suggests that the effect of Nd ordering becomes quite significant below 50 K, and sufficiently above this temperature, the magnetization of Ni sublattice could be obtained, to a reasonable degree of confidence, by the subtraction of NdGaO3 magnetization from that of NdNiO3.
III.0.2 Magnetic ordering of the Ni sublattice
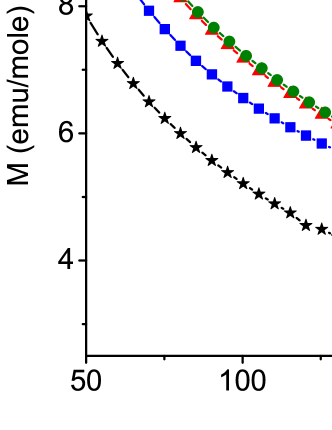
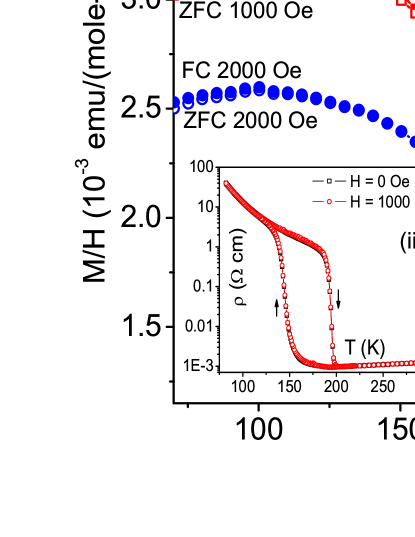
In figure 2 we show the temperature dependence of ZFC and FC dc magnetic susceptibility of Ni sublattice between 100 Oe to 2000 Oe. Above 220 K, as is clear from the inset of figure 2(a), the data fit well to the modified Curie Weiss equation
| (1) |
where and are Curie and Weiss constants respectively, and is a constant arising from Van Vleck and Pauli paramagnetism and Landau and core diamagnetism. The parameters obtained from the fitting of equation (1) to the 1000 Oe susceptibility data of figure 2, in the temperature range of 220-300 K, is shown in table 1. The values very close to unity and the low values indicate that fit quality is very good.
The presence of possible defects in the crystalline lattice structure may also give a contribution to magnetic susceptibility, but that contribution is generally around times smaller than our measured signal,Nair ; Bornemann and this fact allows us to ignore them.
The subtraction of NdGaO3 magnetic susceptibility from that of NdNiO3 cancels the temperature independent Van-Vleck and core contribution of Nd ions, and so is free of these two. The core diamagnetic susceptibility of Ni ions is around emu/moleXu and the Landau diamagnetic susceptibility is connected to Pauli paramagnetic susceptibility by the equation , where is the free electron mass and is the effective mass of an electron in the conduction band. Since is found to be significantly larger than in this family of oxides, Rajeev the can be neglected in comparison to .Xu Thus the values shown in table 1 arise predominantly from the Pauli paramagentism of itinerant electrons, and they are in good agreement with the values reported in Refs. Perez, and Xu, . The Pauli paramagnetic susceptibility of NdNiO3 is around two orders of magnitude larger than that calculated using the free-electron value which suggests that the electron correlation in these systems is very strong.Perez It is to be noted that we get a positive Weiss constant which is indicative of a ferromagnetic interaction in the magnetically ordered state. This is surprising considering the fact that neutron and resonant soft X-ray diffraction measurements show that the system has antiferromagnetic order below .Garc ; Garc1 ; Alonso_1 ; Casais ; Giovannetti In consonance with the above observation of a positive Weiss constant we point out that below 195 K, in FC measurements, the magnetic susceptibility increases on decreasing the temperature as would be expected in the case of ferrimagnets or canted antiferromagnets which behave as weak ferromagnets. See figure 2.
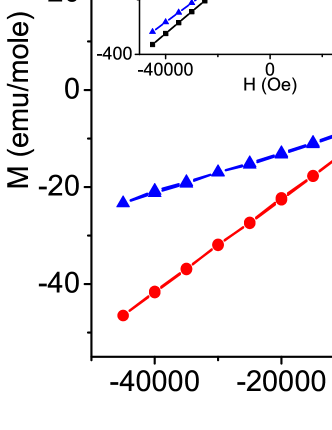
In figure 3 we have shown the field dependence of the magnetization of the Ni sublattice. The inset (a) of the figure shows the magnetization versus field for NdNiO3, NdGaO3 and the Ni sublattice at 150 K. The Ni sublattice magnetization is obtained by subtracting the contribution of Nd moments (obtained from NdGaO3) from that of NdNiO3. In the main panel of figure 3 and its inset (b) we show the magnetization versus field for the Ni sublattice at 150 K and 60 K. The M-H curves show a small hysteresis at small fields, while at higher fields, the M-H curves behave as that of a typical antiferromagnet, with varying linearly with , which leads to the conclusion that this system is a spin-canted antiferromagnet.chikazumi The presence of spin canted magnetism (weak ferromagnetism) cannot be explained on the basis of the magnetic structures proposed in the literature (Refs. 23, 24, 26). This is because the sum of the Ni magnetic moments in the proposed collinear as well as the non-collinear magnetic structure is zero (See figure 5 of Ref. 28). Thus our experimental data clearly show that the magnetic structures proposed in the literature are not the true magnetic picture of NdNiO3. Further investigations are required to confirm this new experimental finding.
Referring to the inset (b) of figure 3, we see that, the coercivity () is temperature dependent below , and it increases on lowering the temperature. Since coercivity is related to magnetic anisotropy, this suggests that the magnetic anisotropy increases on decreasing the temperature.
III.0.3 Magnetic state of the supercooled phase
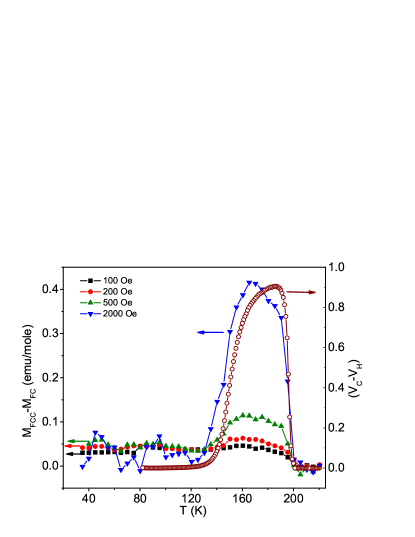
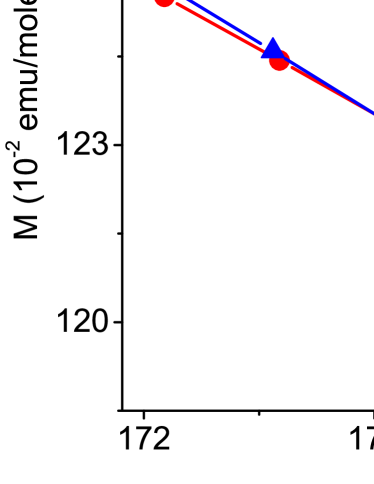
The transport properties of NdNiO3 show thermal hysteresis which is attributed to the presence of supercooled metallic regions below the transition temperature.Devendra ; Devendra1 ; Devendra2 Now the question we would like to ask is this: What is the magnetic state of the supercooled metallic regions? Are they paramagnetic or antiferromagnetic? In other words we are asking whether the paramagnetic to antiferromagnetic transition, when we cool the system through its magnetic transition temperature (200 K ), takes place at that temperature or does it take place along with the M-I transition of the metastable phase at a lower temperature? In order to throw some light on this issue we measured the thermal hysteresis of magnetization. In figure 4 we show the difference in cooling and heating cycle magnetization, , of NdNiO3 at a few field values in the range 100 Oe to 2000 Oe. The data show that between 200 K and 120 K, the magnetization of the cooling cycle is higher than that of the heating cycle. The difference in the magnetization is maximum around 170 K. Figure 4 also shows the difference in the metallic volume fractions between the cooling and heating runs , taken from reference Devendra, . The difference in the magnetizations and the difference in the metallic volume fractions have remarkably similar temperature dependence which suggests that they originate from a common underlying physical mechanism. In a cooling run, below , the system contains supercooled metallic and insulating regions, while in a heating run, it is mostly insulating.Devendra ; Devendra1 ; Devendra2 Therefore represents the volume fraction of supercooled metallic regions. So the correlation between the thermal hysteresis in magnetization and the supercooled metallic volume fraction indicates that the supercooled metallic regions have a higher magnetic moment compared to the insulating regions.
The Ni moments are paramagnetic in the normal metallic state () while they show a spin-canted antiferromagnetic ordering in the insulating state. Also, the spin-canted insulating state has a higher susceptibility than the paramagnetic metallic state (see figure 2). This suggests that if the supercooled metallic regions were paramagnetic, as above , then the magnetization of NdNiO3 in a cooling run, where below the system consists of supercooled metallic and insulating regions, should be lower than that in a heating run where the system is expected to be almost fully insulating. But the experimental results discussed in the previous paragraph contradict this which indicates that the supercooled metallic regions are not paramagnetic. To make things more concrete, we compare the observed difference in the magnetization of cooling and heating runs to the expected value of the difference if the supercooled regions were paramagnetic. In the cooling run, at 170 K, the volume fraction of the supercooled metallic regions is around 0.9 from figure 4. The dc magnetic susceptibility of the paramagnetic metallic phase at 2000 Oe (Figure 2), extrapolated down to 170 K, is about 20% smaller than that of the insulating phase which suggests that if the thermal hysteresis in the magnetization is because of paramagnetic ordering of supercooled metallic regions, then, according to our estimate, the difference in the magnetization of the cooling and heating runs should be around emu/mole. But the observed difference in the magnetization is emu/mole which has the wrong sign and is smaller in magnitude than the expected value. This observation strongly suggests that the supercooled metallic regions are antiferromagnetic with canted spins just like the insulating state. The small positive difference in magnetization between cooling and heating is proportional to the volume fraction of supercooled metallic regions and hence we conclude that this difference in susceptibility is temperature independent. This suggests that the observed difference in cooling and heating cycle magnetization is coming from itinerant electrons in the supercooled metallic state through Pauli paramagnetic and Landau diamagnetic contributions.endnote1 Thus we see that the metallic state is paramagnetic above and on cooling below , while a fraction of the high temperature metallic phase exists in its supercooled state, the magnetic ordering of the whole sample switches to an antiferromagnetic state at .
From the above discussion, we conclude that in NdNiO3, even though the charge ordering and magnetic ordering occur at the same temperature (in equilibrium) they are not strongly coupled and occur independently of each other. Incidentally, we note that except in PrNiO3 and NdNiO3 of the nickelate series, the two transitions occur at different temperatures which supports the conclusion that the two transitions are only weakly coupled. The antiferromagnetic order of the supercooled metallic regions rules out the presence of any metastable magnetic phase associated with the magnetic transition and suggests that the magnetic transition is continuous in nature. This result removes the ambiguity associated with the nature of the magnetic transition in nickelates where = ; the magnetic transition is continuous which is consistent with the other members of the series where > .
III.0.4 The FC-ZFC irreversibility
The FC and ZFC magnetic susceptibilities show a history dependence with a bifurcation between the two curves at a temperature known as the temperature of irreversibility (). See inset (i) figure 2(b). The temperature of irreversibility depends on the magnetic field and it decreases on increasing the magnetic field. For fields greater than 2 kOe the FC and ZFC curves superpose. Behavior such as this where the magnetic susceptibility depends on measurement history has been observed in non-equilibrium systems such as spin-glasses,Maydosh ; Tiwari ; Vijay superparamagnets,Knobel cluster-glasses,Deac ; Huang supercooled systems,Chaddah ; Chaddah1 and also in anisotropic ferromagnets and ferrimagnets.Anil ; Anil1 ; Anil2 ; Song ; Roshkoa The ZFC data show a peak, and the peak broadens and shifts to low temperatures on increasing the magnetic field. We analysed the nature of this peak and found that the peak temperature () as a function of field () does not behave as in the case of spin-glasses, cluster-glasses,Almeida or superparamagnetsZheng ; Vijay1 which indicates that the system is neither a spin-glass nor a superparamagnet. We also rule out supercooling as a possible reason for the FC-ZFC irreversibility by the following argument. The resistivity measurements show a thermal history dependence which is attributed to the presence of supercooled metallic regions below . We did not observe any significant magnetic field or magnetic history dependence in transport properties which suggests that the volume fraction of supercooled metallic regions is not altered by the application of a magnetic field. See inset (ii) of figure 2(b). The lack of dependence of resistivity on applied magnetic field has also been reported earlier by Mallik et al.Mallik From these results, we infer that the magnetic history dependence of the dc magnetic susceptibility (see figure 2(a) and (b)) cannot be originating from the supercooled metallic phases. So far our analysis has shown that the magnetic hysteresis does not arise from spin-glass or cluster-glass nature, superparamagnetism or supercooling. This leaves us with the only possibility that the magnetic hysteresis in this system is arising from magnetic anisotropy of the spin canted magnetic domains.
To be doubly sure that the history dependent FC and ZFC susceptibility of the Ni sublattice has nothing to do with superparamagnetism or spinglass nature, we performed FC, ZFC memory and aging experiments. Since the Nd moments are paramagnetic, they would not have any role in the memory and aging of NdNiO3. Thus if any such effect is seen in this system it would have to be attributed to the Ni sublattice. The FC memory experiments were performed with intermediate stops of one hour at 175, 150, 125, and 100 K. In these experiments the system is cooled in a 100 Oe field from 220 K to 80 K and then heated back to 180 K to remove the influence of supercooled metastable regions on dynamic behavior. Subsequently the system is cooled from 180 K to 80 K with intermediate stops of 1 hour at 175, 150, 125, and 100 K. The field was switched off during the intermediate stops. The magnetization is recorded while cooling and then during the subsequent heating. The FC memory data at 175 K is shown in figure 5. We can see that immediately after an intermediate stop the magnetization does not go back to its pre-stop value after switching on the field. In the subsequent heating run, we did not find any memory of the intermediate stops and this rules out the possibility of superparamagnetism or spin-glass behavior in the system.Vijay We also carried out ZFC memory experiments on the system at 170 K and the result was negative. This confirms the conclusions we arrived at from the FC memory experiments and once again rules out a spin-glass state.Vijay
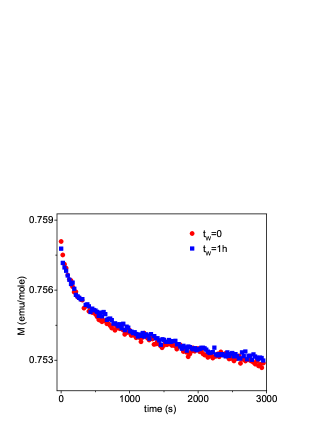
In figure 6 we show the results of the FC ageing experiment. In this experiment one essentially measures the time decay of thermoremanent magnetization along with wait time dependence. To begin with we cool the system from 250 K to 80 K in the presence of 100 Oe field, wait for the duration at 80 K with the field on, and then switch off the field and record the magnetization as a function of time. It is clear from the figure that the system does not show any noticeable wait time dependence in FC ageing and this yet again rules out the possibility of the system being a spin glass or a superparamagnet.Vijay
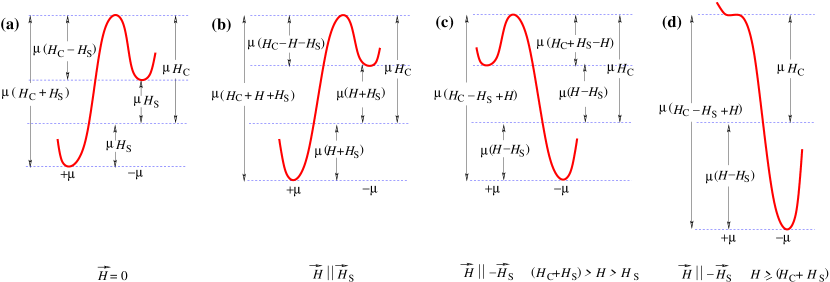
The irreversibility of the FC and ZFC magnetic susceptibility in a system which is neither a spin-glass nor superparamagnetic can be understood in terms of a competition between the magnetocrystalline anisotropy and domain wall pinning on the one hand and applied field and thermal energy on the other.Anil ; Anil1 ; Anil2 ; Song ; Roshkoa Below the temperature of magnetic ordering, a magnetically ordered material consists of uniformly magnetized regions which are known as magnetic domains. At any temperature and applied field , the free energy of the magnetic systems have a number of local minima which are determined by the arrangement of the domains inside the magnetic material. These local minima states are separated by energy barriers which arise due to magnetocrystalline anisotropy and domain wall pinning. When the thermal energy is greater than the energy barrier of the metastable state in which the system is trapped, the system can explore the neighboring states in search of the global minimum or the equilibrium state. The free energy configuration is a function of applied magnetic field and temperature and on changing or (which changes the magnetocrystalline anisotropy) the system evolves from one configuration to another.Bertotti We shall make an attempt to understand our system on the basis of the Preisach model in which the free energy configuration is decomposed into an ensemble of bistable subsystems.Bertotti A bistable subsystem consists of two metastable states separated by an energy barrier. The two states have moments oriented in opposite directions and are termed as states. The free energy of these states in the absence of applied magnetic field is determined by the local interaction field () and the the coercive field (). is the net magnetic field produced at the location of the moment by the magnetic moments of all the neighboring domains. If then represents the anisotropy energy barrier that has to be crossed to go from to state or vice versa. The barrier height seen from the side is while from the side it is . See figure 7 (a). The application of a magnetic field () changes the free energy of the metastable states which in turn affects the effective height of the energy barrier. We also note that a change in the temperature can also affect the free energy barrier through its effect on magnetocrystalline anisotropy. Song ; Roshkoa ; Bertotti
In the following paragraphs we discuss qualitatively the FC-ZFC irreversibility and the remanent magnetization using the standard Preisach model. Thereafter we apply it to understand the observed results of aging experiments.
In ZFC protocol when the system is cooled below each subsystem will be in its lower energy state which is determined by (Figure 7 (a)). On applying a magnetic field, depending on the direction and strength of the applied field, the low energy state of the subsystem may remain as the low energy state (Figure 7 (b)), or may become metastable or unstable (Figure 7 (c) and (d)). If , the subsystems for which is larger than , will flip to their new low energy state (Figure 7 (d)). It is this flipping that gives rise to the initial value of the ZFC magnetization of the system. The subsystems for which is less than , are now in a metastable state (Figure 7 (c)). These subsystems will undergo a thermally activated transformation, which gives rise to a slowly rising time dependent ZFC magnetization even if the magnetic field is held fixed. On increasing the temperature, decreases and because of this more number of subsystems will flip to their new low energy state and this increases the ZFC magnetization further. As one increases the temperature the ZFC magnetization curve will attain a peak when the most probable value of the Barkhausen moment () becomes equal to the applied field .
In the FC protocol the subsystems get trapped in their low energy states, as the sample is cooled through the magnetic ordering temperature in the presence of an applied field. At a constant field, a decrease in temperature increases the energy barrier (because of increase in ), but this does not affect the relative positions of the and states. Thus in the FC protocol there is hardly any change of state of the bistable subsystems when cooling through . The temperature dependence observed in the FC magnetization is because of temperature dependence of the Barkhausen moment . That is why the shape of an FC magnetization curve is nearly the same for all fields.
If we switch off the applied field in the FC protocol, the subsystems for which applied field is opposite and greater in magnitude than will result in their low energy state becoming a high energy state and vice versa. This can be understood looking at figure 7 where the initial states shown in figures 7 (c) or (d) switch to the final state shown in figure 7 (a) on removal of the applied field. Of these subsystems, those which have , will become unstable on removing the field, and their change of state constitutes the initial loss of FC magnetization. The other subsystems (which have ) will become metastable and their thermally activated transformation from a metastable to a new lower energy state gives a further slow decay in FC magnetization.
At this point let us examine the effect of aging (wait time dependence) on the system. All the subsystems occupy their lower energy state on cooling through . Thus, after cooling, if we wait for a few hours before switching off (or on) the field, it will not affect the population of the states and hence we would not get any effect of aging on magnetic relaxation.
IV Conclusion
We performed detailed magnetization measurements on NdNiO3 and extracted the magnetization of Ni sublattice after removing the contribution of the rare earth Nd ion. Our results indicate the presence of weak ferromagnetism coexisting with antiferromagnetic order in the Ni sublattice. We argued that the weak ferromagnetism is due to canting of antiferromagnetic spins. Further we found that in contrast to the normal metallic state, the supercooled metallic regions are magnetically ordered. This shows that while cooling the metal insulator transition occurs over a temperature range of 200 K to 110 K, the magnetic ordering is sharp and occurs at 200 K. The absence of metastable phases in the magnetic transition suggests that the magnetic transition is continuous similar to other members of the series that have > . Below , the ZFC-FC magnetizations diverge exhibiting irreversibilities, that could remind one of a spin-glass state. However, our analysis shows that the system is neither a spin-glass nor a superparamagnet, and the irreversibilities arise from the temperature-dependent magnetocrystalline anisotropy and domain-wall pinning.
V Acknowledgements
DK thanks the University Grants Commission of India for financial support. JAA and MJM-L acknowledge the Spanish Ministry of Education for funding the Project MAT2010-16404.
References
- (1) M. L. Medarde, J. Phys.: Condens. Matter 9, 1679 (1997).
- (2) G. Catalan, Phase Transitions 81, 729 (2008).
- (3) J. B. Torrance, P. Lacorre, A. I. Nazzal, E. J. Ansaldo, and Ch. Niedermayer, Phys. Rev. B 45, 8209 (1992).
- (4) X. Obradors, L. M. Paulius, M. B. Maple, J. B. Torrance, A. I. Nazzal, J. Fontcuberta, and X. Granados, Phys. Rev. B 47, 12353 (1993).
- (5) P. C. Canfield, J. D Thompson, S. W. Cheong, and L. W. Rupp, Phys. Rev. B 47, 12357 (1993).
- (6) J.-S. Zhou, J. B. Goodenough, and B. Dabrowski, Phys. Rev Lett. 94, 226602 (2005).
- (7) A. Tiwari, C. Jin, and J. Narayan, Appl. Phys. Lett 80, 4039 (2002).
- (8) P. Lacorre, J. B. Torrance, J. Pannetier, A. I. Nazzal, P. W. Wang, and T. C. Huang, J. Solid State Chem. 91, 225 (1991).
- (9) J. A. Alonso, J. L. García-Munõz, M. T. Fernández-Díaz, M. A. G. Aranda, M. J. Martínez- Lope, and M. T. Casais, Phys. Rev. Lett. 82, 3871 (1999).
- (10) J. A. Alonso, M. J. Martínez- Lope, M. T. Casais, J. L. García-Munõz, and M. T. Fernández-Díaz, Phys. Rev. B 61, 1756 (2000).
- (11) J. A. Alonso, J. L. García-Munõz, M. T. Fernández-Díaz, M. A. G. Aranda, M. J. Martínez- Lope, and M. T. Casais, Phys. Rev. B 64, 094102 (2001).
- (12) U. Staub, G. I. Meijer, F. Fauth, R. Allenspach, J. G. Bednorz, J. Karpinski, S. M. Kazakov, L. Paolasini, and F. d’Acapito, Phys. Rev. Lett. 88, 126402 (2002).
- (13) M. Medarde, M. T. Fernández-Díaz, and Ph. Lacorre, Phys. Rev. B 78, 212101 (2008).
- (14) J. L. García-Munõz, M. A. G. Aranda, J. A. Alonso, and M. J. Martínez- Lope, Phys. Rev. B 79, 134432 (2009).
- (15) I. I. Mazin, D. I. Khomskii, R. Lengsdorf, J. A. Alonso, W. G. Marshall, R. M. Ibberson, A. Podlesnyak, M. J. M. J. Martínez- Lope, and M. M. Abd-Elmeguid, Phys. Rev. Lett. 98, 176406 (2007).
- (16) X. Granados, J. Fontcuberta, X. Obradors, and J. B. Torrance, Phys. Rev. B 46, 15683 (1992).
- (17) D. Kumar, K. P. Rajeev, J. A. Alonso, and M. J. Martínez- Lope, J. Phys: Condensed Matter 21, 185402 (2009).
- (18) D. Kumar, K. P. Rajeev, J. A. Alonso, and M. J. Martínez- Lope, J. Phys: Condensed Matter 21, 485402 (2009).
- (19) D. Kumar, K. P. Rajeev, A. K. Kushwaha, and R. C. Budhani, J. Appl. Phys. 108, 063503 (2010).
- (20) J. Blasco, M. Castro, and J. Garcia, J. Phys: Condensed Matter 6, 5875 (1994).
- (21) J. Pérez, J. Stankiewicz, J. Blasco, M. Castro, and J. García, J. Phys: Condensed Matter 8, 10393 (1996).
- (22) J Pérez-Cacho, J Blasco, J García, M Castro, and J Stankiewicz, J. Phys: Condensed Matter 11, 405 (1999).
- (23) A. Caytuero, H. Micklitz, F. J. Litterst, and E. M. Baggio-Saitovitch, Phys. Rev. B 74, 094433 (2006).
- (24) J. L. García-Munõz, J. Rodriguez-Carvajal, and P. Lacorre, Europhys. Lett. 20, 241 (1992).
- (25) J. L. García-Munõz, J. Rodriguez-Carvajal, and P. Lacorre, Phys. Rev. B 50, 978 (1994).
- (26) J. L. García-Munõz, P. Lacorre, and R. Cywinski, Phys. Rev. B 51, 15197 (1995).
- (27) M. T. Fernández-Díaz, J. A. Alonso, M. J. Martínez- Lope, M. T. Casais, and J. L. García-Munõz, Phys. Rev. B 64, 144417 (2001).
- (28) G. Giovannetti, S. Kumar, D. Khomskii, S. Picozzi, and J. van den Brink, Phys. Rev. Lett. 103, 156401 (2009).
- (29) V. Scagnoli, U. Staub, A. M. Mulders, M. Janousch, G. I. Meijer, G. Hammerl, J. M. Tonnerre, and N. Stojic, Phys. Rev. B 73, 100409 (2006).
- (30) F. Bartolomé, J. Bartolomé, and R. S. Eccleston, J. Appl. Phys. 87, 7052 (2000).
- (31) V. Scagnoli, U. Staub, Y. Bodenthin, M. García-Fernández, A. M. Mulders, G. I. Meijer, and G. Hammerl, Phys. Rev. B 77, 115138 (2008).
- (32) N. E. Massa, J. A. Alonso, M. J. Martínez-Lope, I. Rasines, Phys. Rev. B 56, 986 (1997).
- (33) A. Ney, T. Kammermeier, V. Ney, K. Ollefs, and S. Ye, J. Magn. Magn. Mater 320, 3341 (2008).
- (34) N. Casañ-Pastor, P. GomézRomero, and L. C.W. Baker, J. Appl. Phys. 69, 5088 (1991).
- (35) A. Baena, L. Brey, and M. J. Calderõn, Phys. Rev. B 83, 064424 (2011).
- (36) R. R. Nair, M. Sepioni, I-Ling Tsai, O. Lehtinen, J. Keinonen, A. V. Krasheninnikov, T. Thomson, A. K. Geim, andI. V. Grigorieva, Nature Physics 8, 199 (2012).
- (37) H. J. Bornemann, W. Walukiewicz, and D. E. Bliss, Phys. Rev. B 46, 9849 (1992).
- (38) X. Q. Xu, J. L. Peng, Z. Y. Li, H. L. Ju, and R. L. Greene, Phys. Rev. B 48, 1112 (1993).
- (39) K. P. Rajeev, G. V. Shivashankar and A. K. Raychaudhuri, Solid State Commun. 79, 591 (1991).
- (40) S. Chikazumi, Physics of Ferromagnetism (Oxford University Press 1997) Chapter 7, page 151.
- (41) The term in Table 1 represents the contribution of temperature independent susceptibilities (which includes Pauli & Van Vleck paramagnetism and Landau & core diamagnetism). Now the difference at 170 K is 0.4 emu/mole for 2000 Oe (Figure 4). Converted to susceptibility the difference turns out to be around 0.0002 emu/mole-Oe. In Table 1, the value is around 0.00095 emu/mole-Oe, and after removing the core dimagnetism, the Pauli and Landau contribution comes around 0.0009 emu/mole-Oe which is of the same order as the difference in susceptibility.
- (42) J. A. Mydosh, Spin Glasses: An Experperimental Introduction (Taylor and Francis London 1993).
- (43) S. D. Tiwari and K. P. Rajeev, Phys. Rev. B 72, 104433 (2005).
- (44) V. Bisht and K. P. Rajeev, J. Phys. : Condens. Matter 22, 016003 (2010).
- (45) M. Knobel, W. C. Nunes, L. M. Socolovsky, E. De Biasi, J. M. Varg as, and J. C. Denardin, J. Nanosci. Nanotechnol. 8, 2836 (2008).
- (46) I. G. Deac, J. F. Mitchell, and P. Schiffer, Phys. Rev. B 63, 172408 (2001).
- (47) X. H. Huang, J. F. Ding, Z. L. Jiang, Y. W. Yin, Q. X. Yu, and X. G. Lia, J. Appl. Phys. 106, 083904 (2009).
- (48) P. Chaddah, K. Kumar, and A. Banerjee, Phys. Rev. B 77, 100402(R) (2008).
- (49) M. K. Chattopadhyay, S. B. Roy, and P. Chaddah, Phys. Rev. B 72, 180401 (2005).
- (50) P S Anil Kumar, P A Joy, and S K Date, J. Phys. : Condens. Matter 10, L487 (1998).
- (51) P S Anil Kumar, P A Joy, and S K Date, Bull. Mater. Sci. 23, 97 (2000).
- (52) P A Joy, P S Anil Kumar, and S K Date, J. Phys. : Condens. Matter 10, 11049 (1998).
- (53) T. Song, R. M. Roshko, and E. D. Dahlberg, J. Phys. : Condens. Matter 13, 3443 (2001).
- (54) R.M. Roshko and L. Xi, J. Appl. Phys. 93, 6653 (2003).
- (55) R.L. de Almeida and D.J. Thouless, J. Phys. A 11, 983 (1978).
- (56) R.K. Zheng, Hongwei Gu, Bing Xu, X.X. Zhang, J. Phys. : Condens. Matter 18, 5905 (2006).
- (57) V. Bisht, K.P. Rajeev, S. Banerjee, Solid State Communications 150, 884 (2010).
- (58) R Mallik, E V Sampathkumaran, J A Alonso, and M. J. Martínez- Lope, J. Phys: Condensed Matter 10, 3969 (1998).
- (59) G. Bertotti, Hysteresis in Magnetism (Academic Press 1993).