Can evidence for cosmological accretion be observed in the H emission from galaxies at z2?††thanks: Data obtained as part of Programmes ID 074.A-9011, 075.A-0318, 075.A-0466, 076.A-0464, 076.A-0527, 076.B-0259, 077.B-0079, 077.B-0511, 078.A-0055, 078.A-0600, 079.A-0341 and 079.B-0430 at the ESO-VLT.
In previous studies, it has been shown that the large line widths observed in high surface brightness H emitters at low and high redshifts are likely due to the mechanical energy injected by intense star formation. Here we discuss the possibility that the high surface brightnesses observed are not due to star formation, but due to cosmological gas accretion. We assume that all of the accretion energy is dissipated as shocks from the accreting gas. We show that in order to explain the high surface brightnesses both the mass accretion rate and energy would have to be much higher than expected from simulations or from equating the star formation with the accretion rate. We also investigate scaling relations between the surface brightness expected from accretion and for star formation through mechanical heating and photo-ionization, trying to identify a regime where such accretion may become evident in galaxies. Unfortunately, the surface brightness necessary to detect the gas in optical line emission is about an order of magnitude lower than what has currently been achieved with near-infrared observations of distant galaxies.
Key Words.:
cosmology: observations — galaxies: evolution — galaxies: formation — galaxies: kinematics and dynamics — infrared: galaxies1 Introduction
Various processes have been proposed to explain how galaxies obtain the amount of gas necessary to fuel star formation and their growth. In the early hierarchical models of galaxy growth (e.g. White & Rees 1978) it was a combination of minor and major mergers, and gas cooling from a virialized dark matter halo, but it is now thought that much of the cooling may take place outside of the individual halos that subsequently accrete the gas, and that this gas will never be heated up to the virial temperature in the halo – such accretion mechanisms have been dubbed “cold flows” (e.g. Dekel et al. 2009; van de Voort et al. 2011).
All these ideas rely on the basic assumption that baryons are strongly coupled to the dark matter through gravity and thus robustly follow the collapse of the dark matter. Without such coupling and the relative amounts of heating and cooling that this entails, neither cooling virialized halo gas nor gas from cold flows would deposit as much material over the same time range as they have been hypothesized to do. However, there is scant observational evidence for such cold flows or even hot halos. Recently, Anderson & Bregman (2010) concluded that the missing baryons are not in the halos of nearby galaxies and likely never were part of the Milky Way. In addition, there is evidence that gas in halos of distant galaxies is due to starburst driven outflows and not to gas accretion (Steidel et al. 2010).
Nevertheless, many models (e.g. Dekel et al. 2009; Brooks et al. 2009; Kereš et al. 2009) suggest that cooling baryons in the halos and/or cold accretion flows are needed to explain the observations of distant galaxies, especially their large emission line widths, the apparent prevalence of rotating disks (as claimed by Förster Schreiber et al. 2006), and their high star-formation rates. On the other hand, Lehnert et al. (2009) (hereafter L09) proposed that the large line widths observed are not due to gas accretion but to the intense star formation in the observed high redshift (z2) objects. The same conclusion has subsequently been reached by Green et al. (2010). Elmegreen & Burkert (2010) (hereafter EB10) modeled how accretion flows might explain the large line widths by dissipating the accretion energy as turbulence. They conclude that while large line widths are possible due to accretion, the phase when line widths are dominated by accretion must be short lived, about one dynamical time (100 Myr), suggesting that intense, or more efficient, star formation may be more likely responsible for the large line widths.
Despite this work, many subsequent studies have continued to suggest that gas accretion is a viable mechanism for explaining some of the properties of high redshift galaxies. In this paper, we examine the two following simple questions: (1.) Can the observed high H surface brightnesses in distant galaxies be explained by cosmological gas accretion at a rate sufficient to fuel their star formation? (2.) For what ratio of the star formation and accretion rates would we expect the emission line luminosity generated from accretion to dominate? The impact of gas accretion can only be observed if the heating rate due to star formation is below some threshold. This threshold depends on the efficiency of (1.) the transformation of accretion energy into turbulence, (2.) gas heating and (3.) the transformation of the mechanical and ionizing energy of massive stars into turbulent and bulk motions, and heating.
Throughout the paper we adopt a flat H70 km s-1 Mpc-3 concordance cosmology with and .
2 H luminosity and velocity dispersion
We use ESO archival data from a variety of programs with SINFONI on the ESO-VLT of a sample of more than fifty galaxies in the redshift range 1.3-2.7, which will be described in more detail in Le Tiran et al. (2011, in preparation). The key to the sample is that all have sufficiently high H surface brightness to obtain spatially resolved line maps in a few hours integration time. The targets have H surface brightness levels exceeding a few 10-18 erg cm-2 s-1 arcsec-2 over more than 1-2 arcsec2 (10-20 kpc) in radius and total H luminosities above about 1042 erg s-1. Due to cosmological dimming, there is a range of a factor of 5 in the faintest surface brightness line emission levels that can be probed as a function of redshift in our sample. However, it is worth repeating the conclusion from L09 that even our lowest redshift SINFONI sources are extreme compared to galaxies in the local volume, where only a few of the most intense starbursts have such high H surface brightnesses, and this on smaller physical scales only.
Many studies which have analyzed the emission-line characteristics of distant galaxies examined velocity dispersions as an integrated property (e.g. Khochfar & Silk 2009; Burkert et al. 2010; Ceverino et al. 2010). These analyses have tended to favor gravity as the source of the observed characteristics, whether driven by gas accretion energy derived from the potential energy of the halo or from gravitational contraction of a gaseous and stellar disk. L09, on the other hand, focused on the relationship they found between spatially resolved H surface brightness and velocity dispersion in 10 high redshift galaxies observed with SINFONI, a subset of the sample of over 50 galaxies discussed here. They suggest that neither smooth cosmological gas accretion, velocity dispersions driven by Jeans-unstable clumps, or turbulence generated by energy extracted by a collapsing disk can explain this relationship. They suggested instead that the velocity dispersion due to mechanical energy released by the observed intense star formation is of the form =()1/2, where is the efficiency at which the mechanical energy from a star-formation intensity is converted into turbulence and bulk flows in the interstellar medium of galaxies. This model has the advantage of having no free parameters since the efficiency can be constrained by observations of nearby galaxies or models (Dib et al. 2006, and references therein).
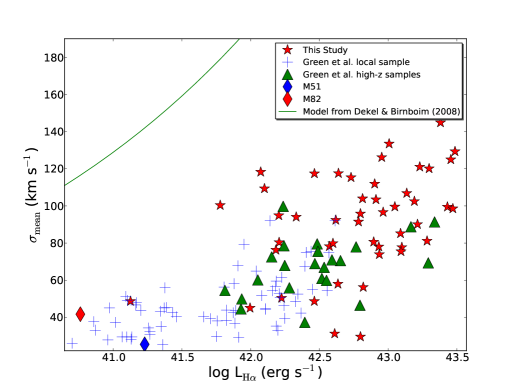
Rather than using spatially resolved spectrographic data for a pixel-by-pixel comparison, Green et al. (2010) constructed a single, integrated H spectrum per galaxy, through a flux-weighted averaging of their pixels. Figure 1 shows the relationship between the total H luminosity and the mean velocity dispersion measured using integrated spectra derived with flux weighting per pixel, for our sample of high redshift galaxies, as well as for the galaxies from Green et al. (2010), i.e., their selection of local SDSS galaxies, M51 (Tully 1974), M82 (Lehnert et al. 1999) and diverse samples of high redshift galaxies taken from Epinat et al. (2009), Law et al. (2009) and Lemoine-Busserolle et al. (2010). The relationship shows a similar trend as the one found between surface brightness and dispersion per pixel in L09. For our purpose here, this remarkable similarity is important as it supports the notion that any hypothesis that explains the trend of increasing local optical emission line widths with local surface brightness, such as star formation (Lehnert et al. 2009), apparently also explains the similar relationship between the integrated quantities (something that was not pointed out by either L09 or Green et al. 2010). We will discuss this in greater depth in Le Tiran et al. (2011, in prep.).
3 Can cosmological gas accretion shocks produce the observed H surface brightnesses?
L09 evaluated various mechanisms that can contribute to the large observed H line widths, such as clumps, gravitational instabilities, effects from the turbulence and smooth accretion, and suggested that only the mechanical output from star formation could power such large random motions. This paper further examines the case for cold gas accretion and its observability in the z2 Universe (e.g. Kereš et al. 2009; Dekel et al. 2009). Gas accretion onto galaxies is undoubtedly a complex process: this accreting gas would further cool through radiation and by generating shocks upon hitting the ISM of the galaxy. The highly radiative shocks are an effective mechanism through which infalling gas can lose its energy and momentum. But can we see direct evidence for this in our integral field H data sets?
The underlying assumption that the infalling gas dissipates energy by colliding with gas already in a galaxy disk and that all the accretion energy, extracted from the halo potential, is converted into supersonic turbulence which then dissipates as fast shocks is undoubtedly an over-simplification, as in reality only part of the energy will go into turbulence and some of it into bulk motions, and shock velocities will span a wide range of velocities which is dependent on the structure (density and temperature) of the ISM. Although some, and perhaps most, of the energy will be dissipated in slower shocks in denser gas, the H luminosity of the shock will not be very high in shocks below a few tens of km s-1 (Shull & McKee 1979).
We can estimate the dissipation rate of the infalling gas using a range of shock models, as we assume that the shock velocities are equal to the observed velocity dispersions, which span the range of 50-250 km s-1 in our sample. The shock models are complementary in the sense that some (Allen et al. 2008) focus on high velocity shocks where the precursor ionizing the gas in front of the shock is important (v 80-100 km s-1, Dopita & Sutherland 1995), and others on lower velocity shocks (Raymond 1979; Shull & McKee 1979).
This allows us to estimate the rate at which mass must pass through the shock in order to provide sufficient H surface brightness to be observable, as well as the total H luminosity produced by the accretion energy. Using the characteristics of the z2 galaxies in our sample, we find a mean velocity dispersion of almost 100 km s-1 and a total H luminosity of 1043.0 erg s-1. Correcting for the extinction typically observed for this kind of sources would increase their H luminosities by a factor of 2-5 (L09). Using the shock models of Allen et al. (2008), we find that about 2% of the shock energy is emitted in H for a shock velocity of 100 km s-1, independent of the gas density. The conversion rate of 2% is near the maximum efficiency for this process.
An accretion energy extracted from the potential energy of the dark matter halo, of 1043.1 erg s-1 has been estimated for a baryonic accretion rate of about 100 M☉ yr-1 (Dekel, & Birnboim 2008). Our typical H luminosity, if entirely due to star formation, would be consistent with a star-formation rate of 100 M☉ yr-1 for a Salpeter IMF with lower and upper mass limits of 0.1 and 100 M☉ (Kennicutt 1998, and a factor of a few lower for a more reasonable Kroupa IMF). The predicted H luminosity, if due to accretion, would then be about 1041.4 (/100 M☉ yr-1) erg s-1, if the whole of the accretion energy is radiated through shocks with velocities of 100 km s-1, with a conversion rate of 2%. With 10% of the accretion energy going into supersonic turbulence (Klessen & Hennebelle 2010), gas accretion rates of many hundreds to thousands of M☉ yr-1 would be required for the total accretion energy to explain the H luminosity. Such high values for the gas accretion rate are well above what is commonly estimated from various models (e.g. Kereš et al. 2009; Genel et al. 2008). We demonstrate this in Figure 1 where we show the relationship between and LHα for a gas accretion model. For this model, we have used the gas accretion rate as a function of virial velocity and the energy deposition rate due to accretion (Dekel, & Birnboim 2008), a conversion rate of 2%, and assumed the virial velocity is equal to the shock velocity.
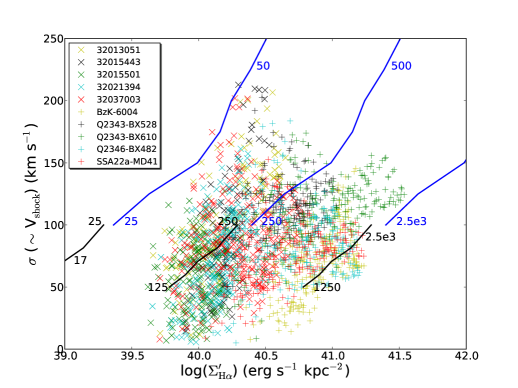
If gas accretion is truly happening at rates of up to several hundreds of M☉ yr-1 at z2, it is likely that the integrated measures of H luminosity and velocity dispersion are due to a combination of star formation and gas accretion. We can use the spatially resolved data to investigate if part of the surface brightness of these galaxies may be explicable by gas accretion. For this we will estimate the amount of mass that would need to be shocked to explain the observed surface brightnesses as a function of dispersion. In Figure 2, we show the results for 10 representative galaxies in two redshift bins which, because of the strong dependence of surface brightness with redshift, allows us to show the full range of rest-frame H surface brightnesses within our sample of about 50 galaxies. We find that the surface brightnesses can be explained by shock models, but only if the mass flow rates through the shocks are very high, with accretion rate densities of over a few hundred M☉ yr-1 kpc-2 implied for the highest surface brightnesses, whereas only for the lowest surface brightnesses a more reasonable level of 25-50 M☉ yr-1 kpc-2 is indicated. In all cases, to explain the surface brightness requires gas of reasonably high density (100 cm-3).
Taking a rate at which gas is shocked of 300 M☉ yr-1 kpc-2 would suggest 105 M☉ yr-1 of shock heated gas, or 103 times the reasonable gas accretion rate (Dekel et al. 2009). To support star formation and to form a disk galaxy, the energy from accretion must not be dissipated too rapidly least the gas loses too much angular momentum. Over a dynamical time of about 200-300 Myr (EB10), the amount of gas that needs to be shock heated is of the order of 1013 M☉, two orders of magnitude larger than the total ISM mass in a disk galaxy.
4 Discussion and Conclusions
The reason why it is likely difficult to note the effects of gas accretion on the ISM of presently observed galaxies is the relatively low efficiency of the conversion of accretion energy into line emission. An interesting question is under what circumstances a galaxy might be observed that is undergoing a (formative) phase of intense gas accretion.
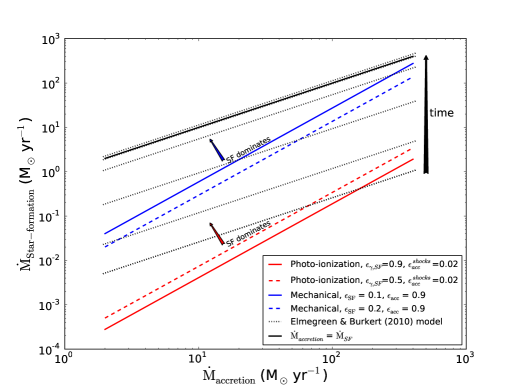
We have attempted to quantify how the mass accretion rate would compare to the star-formation rate in both controlling the ionization of the gas and in mechanically exciting the gas (see Fig. 3). We estimated that the H luminosity is produced at the rate of 2.61041 erg s-1 M (Leitherer et al. 1999, appropriate for a Kroupa IMF), that there is a 90% contribution of ionizing photons (), which implies an escape fraction of 10%, that accretion shock energy is converted into H luminosity at the rate of 2% (), and that 90% () of the accretion energy is lost due to shocks which emit H at an efficiency of . To compare this with the mechanical energy of the star formation we used a conversion factor of 7.41041 erg s-1 M (Leitherer et al. 1999) and a conversion efficiency of either 10 or 20% ().
This allows us to compare the relative efficiency of heating and ionization from the formation of massive stars with that of the mechanical heating through gas accretion. Can we identify areas in a plot comparing the rates of star formation and cosmological gas accretion where observations may be made to discover the duration and impact of gas accretion? To this end, we have used the simple model of the relationship between gas accretion and star formation of EB10. This model, which assumes a phase with constant accretion rate, allows us to compare, as a function of time, the expected total recombination line luminosity due to infalling gas dissipating its energy through shocks versus that produced by the ionizing radiation and mechanical energy from star formation, whose rate is estimated by the total gas mass multiplied by the gravitational instability growth rate (see EB10 for details).
In this comparison with the models of EB10 we see (Fig. 3) that very quickly, within 45-90 Myr depending on the gas mass accretion rate, photo-ionization from massive stars dominates over the heating due to gas accretion. This implies that shock-like line ratios are not expected to be observed even if the energy of the infalling gas dominates the dynamics of the ISM. After about 180 Myr, the mechanical energy of massive stars through supernovae and stellar winds begins to dominate, something already concluded by L09. While we should not take the numbers literally, the analysis suggests that the time over which the effects of gas accretion will be evident is relatively short – less than a dynamical (orbital) time within a galaxy.
So we expect to see the impact of gas accretion on either the ionization or dynamical state of the gas only early in the gas accretion process and only when the star-formation rates are relatively low. Within the context of the EB10 model, the star formation will roughly reach equilibrium with the accretion rate after a couple of dynamical times. If this were the case for our intensely star-forming galaxies at high redshift, we should not see any impact on either the surface brightness or dynamics of the emission line gas, as these are both controlled by star formation, in agreement with what was first proposed by L09 and later supported by the findings of Green et al. (2010).
Can we actually observe this early phase of gas accretion and its impact on either the ionization or the mechanical energy? The answer is likely no, at least not through H observations. Star-forming galaxies at high redshift have star-formation rates above 10 yr-1 (Förster Schreiber et al. 2006). Comparing this with Figure 3 suggests there is only a small probability that the effect of gas accretion can be observed. Taking a relatively optimistic star-formation rate of less than 30 M☉ yr-1, which is equivalent to the H surface brightness generated by a gas accretion rate of about 100 M☉ yr-1, using our scaling for mechanical energy, suggests that the average surface brightness over 1 arcsec2 (barely enough to resolve a galaxy) would be about 4 10-19 erg s-1 arcsec-2 at z=2.2. This is about an order of magnitude less than what can be detected in a few hours observation with a spectrograph like SINFONI on an 8-10m class telescope like the ESO-VLT, and even beyond the longest integrations made with SINFONI (Lehnert et al. 2010). Perhaps more unfortunately, given the difficulty in designing spectrographs with large pixels on the next generation of large telescopes, reaching surface brightness levels beyond the current limits will remain difficult in the foreseeable future.
Therefore, we conclude that currently, the impact of gas accretion on galaxies at high redshift cannot be observed using the optical emission line gas. This is true especially for the early phases of galaxy formation where the gas accretion rate, despite it being thought of order 100-300 M☉ yr-1 for massive galaxies and at high redshifts (Dekel et al. 2009; Kereš et al. 2009), will not be observable both because it does not liberate enough mechanical energy to be observable with integral field spectrometers and because it is relatively quickly over-whelmed by the heating due to star formation, even at relatively modest rates.
Acknowledgements.
The work of LLT, MDL and PDM is directly supported by a grant from the Agence Nationale de la Recherche (ANR).References
- Allen et al. (2008) Allen, M. G., et al. 2008, ApJS, 178, 20
- Anderson & Bregman (2010) Anderson, M. E., & Bregman, J. N. 2010, ApJ, 714, 320
- Brooks et al. (2009) Brooks, A. M., et al. 2009, ApJ, 694, 396
- Burkert et al. (2010) Burkert, A., Genzel, R., Bouché, N., et al. 2010, ApJ, 725, 2324
- Ceverino et al. (2010) Ceverino, D., et al. 2010, MNRAS, 404, 2151
- Dekel, & Birnboim (2008) Dekel, A. & Birnboim, Y. 2008, MNRAS, 383, 119
- Dekel et al. (2009) Dekel, A., Birnboim, Y., Engel, G., et al. 2009, Nature, 457, 451
- Dib et al. (2006) Dib, S., Bell, E., & Burkert, A. 2006, ApJ, 638, 797
- Dopita & Sutherland (1995) Dopita, M. A., & Sutherland, R. S. 1995, ApJ, 455, 468
- Elmegreen & Burkert (2010) Elmegreen, B. G., & Burkert, A. 2010, ApJ, 712, 294
- Epinat et al. (2009) Epinat, B., Contini, T., Le Fèvre, O., et al. 2009, A&A, 504, 789
- Förster Schreiber et al. (2006) Förster Schreiber, N. M., et al. 2006, ApJ, 645, 1062
- Genel et al. (2008) Genel, S., Genzel, R., Bouché, N., et al. 2008, ApJ, 688, 789
- Green et al. (2010) Green, A. W., et al. 2010, Nature, 467, 684
- Kennicutt (1998) Kennicutt, Jr., R. C. 1998, ApJ, 498, 541
- Kereš et al. (2009) Kereš, D., et al. 2009, MNRAS, 395, 160
- Khochfar & Silk (2009) Khochfar, S., & Silk, J. 2009, ApJ, 700, L21
- Klessen & Hennebelle (2010) Klessen, R. S., & Hennebelle, P. 2010, A&A, 520, A17
- Law et al. (2009) Law, D. R., Steidel, C. C., Erb, D. K., et al. 2009, ApJ, 697, 2057
- Lehnert et al. (1999) Lehnert, M. D., et al. 1999, ApJ, 523, 575
- Lehnert et al. (2010) Lehnert, M. D., et al. 2010, Nature, 467, 940
- Lehnert et al. (2009) Lehnert, M. D., et al. 2009, ApJ, 699, 1660
- Leitherer et al. (1999) Leitherer, C., et al. 1999, ApJS, 123, 3
- Lemoine-Busserolle et al. (2010) Lemoine-Busserolle, M., et al. 2010, MNRAS, 401, 1657
- Raymond (1979) Raymond, J. C. 1979, ApJS, 39, 1
- Shull & McKee (1979) Shull, J. M., & McKee, C. F. 1979, ApJ, 227, 131
- Steidel et al. (2010) Steidel, C. C., et al. 2010, ApJ, 717, 289
- Tully (1974) Tully, R. B. 1974, ApJS, 27, 415
- van de Voort et al. (2011) van de Voort, F., et al. 2011, ArXiv e-prints 1011.2491
- White & Rees (1978) White, S. D. M., & Rees, M. J. 1978, MNRAS, 183, 341