Modelling the Broadband Spectra of MCG-6-30-15 with a Relativistic Reflection Model
Abstract
The spectrum of the bright Seyfert I galaxy MCG-6-30-15 shows a broad Fe K emission line, generally interpreted to originate very close to the central black hole which must then have a high spin. The observed X-ray variability is driven by a powerlaw component, with little variability found in the iron line energy band. The disconnection of continuum and line variability may be a consequence of strong gravitational light bending. The X-ray spectrum of MCG-6-30-15 is however complex, strongly modified at soft X-ray energies by warm absorbers, which some workers have extended to build an absorption-dominated model of the whole source behaviour. The absorption model interprets the whole X-ray spectrum without a relativistic reflection component and attributes most variability to the warm absorbers. We re-examine the XMM-Newton, Chandra and Suzaku data taken in 2001, 2004 and 2006, respectively, and construct a model consisting of several warm absorbers confirmed by spectral analysis, together with a relativistically blurred reflection component that explains both the soft and hard excesses as well. The model works well on data from all epochs, demonstrating that the reflection model provides a consistent interpretation of the broadband spectrum of MCG-6-30-15.
keywords:
accretion, accretion discs–galaxies1 Introduction
The X-ray reflection spectrum of Active Galactic Nuclei (AGN), included fluorescent lines, the Compton hump and other emission in the low-energy band, is expected from a cool accretion disc illuminated by a power-law continuum (Ross & Fabian, 1993). As cold gas absorbs high energy photons, inner-shell electrons are knocked out and, followed by atomic transitions, lead to emission lines. The iron K line which lies at or above 6.4 keV is usually the strongest. This fluorescent line is intrinsically narrow, but can appear as a broad line because of Doppler effect and gravitational redshift effects (Fabian et al., 1989, 2000; Reynolds & Nowak, 2003). A broad iron line was first discovered by the Advanced Satellite for Cosmology and Astrophysics (ASCA) in the X-ray spectrum of the Seyfert I galaxy MCG-6-30-15 (Tanaka et al., 1995). Since then MCG-6-30-15 has become one of the most studied AGNs. The broad and skewed iron line was observed in later observations of BeppoSAX (Guainazzi et al., 1999), Chandra (Lee et al., 2002), XMM-Newton (Fabian et al., 2002) and Suzaku (Miniutti et al., 2007).
The soft X-ray spectrum of MCG-6-30-15 has complex structures usually attributed to warm absorbers (e.g. Otani et al., 1996). Branduardi-Raymont et al. (2001) tried however to explain the soft features by the same mechanism used to interpret the broad iron line. They described the 0.7 keV drop as the blue wing of a broad O VIII emission line, and the smaller 0.39 keV and 0.54 keV drops as C VI and N VII emission lines, respectively. Reflection modelling of the soft X-ray lines (Ballantyne et al., 2002) failed to confirm the large equivalent widths required by the data. Lee et al. (2001) presented evidence of dusty warm absorbers in the Chandra High Energy Transmission Grating Spectrometer (HETGS) observation. The 0.7 keV drop can be interpreted as a combination of resonance absorption lines redward of the O VII edge and an Fe I L-shell absorption edge, caused by dust grain iron oxides or silicates. The presence of dust is in agreement with the optical observations of Reynolds et al. (1997). Turner et al. (2003) examined the Reflection Grating Spectrometer (RGS) spectra from XMM-Newton observation and confirmed the presence of dusty warm absorbers. The total X-ray spectrum of MCG-6-30-15 could hence be illustrated by a power-law continuum, the reflected component from the cool disc, and absorptions by warm absorbers.
An initially puzzling lack of line variations during rapid continuum variations (Fabian et al., 2002; Matsumoto et al., 2003) aroused interest. Miniutti & Fabian (2004) showed that if the illuminating source moves within the innermost area around the black hole where there are strong general relativistic light-bending effects, then the flux of the continuum varies but the iron line could stay unchanged. This gravitational light-bending model interprets the lack of variability of the iron line, despite the observed variability of the continuum, as due to changes in the location of the powerlaw component. Further studies of this model have been reported by Suebsuwong et al. (2006), Niedźwiecki & Miyakawa (2010), and Niedźwiecki & Życki (2008). The timing analysis of the Suzaku observation in 2006 later showed consistency with the gravitational light-bending model (Miniutti et al., 2007). Inoue & Matsumoto (2003), on the other hand, suggested a different view with an absorption-dominated model which could explain the X-ray spectra of MCG-6-30-15 as well. The warm absorbers might imitate the “red wing” structure seen in the iron line energy band, and variations of continuum are hence due to warm absorbers but not of the power-law component. Miller et al. (2008, 2009) further extended the absorption model to build a complex “3+2” model which consists of five absorbing zones, two of which are ‘partial-covering’. With 3 percent systematic errors included, they claim that this model reproduces the variability and XMM spectra of MCG-6-30-15. The partial covering component responsible for the red wing shape produces no other observed features at CCD resolution. Using Suzaku data, Miyakawa et al. (2009) also favour this view but reduce the need for five warm absorbers to two.
Apart from the variability disconnection, it has been claimed that the strong emission found at high energies (above 10keV), known as the “hard excess”, cannot be explained with a simple disc reflection scenario. Miller et al. (2009) concluded that high-column partial-covering absorption dominates the hard excess in MCG-6-30-15, as seen in NGC 1365 (Risaliti et al., 2009), 1H 0419-577 (Turner et al., 2009) and PDS 456 (Reeves et al., 2009). The spectra of the last three objects have however since been shown to be well described by reflection (Walton et al., 2010), although Compton thick, partial-covering absorbers could not be completely ruled out.
We re-examine the full X-ray data of MCG-6-30-15 taken after 2001 by XMM-Newton, Suzaku and Chandra. A reflection model with absorbing zones was applied to these observations to test the robustness of the model. We start by investigating the difference spectra of the three datasets and then study the full real spectra. The grating data of Chandra, the energy resolution of which is better than other instruments, were used to study the effects of warm absorbers and determine their shape. A model with four absorbers works well on Chandra and Suzaku spectra, while the spectrum of XMM-Newton needs only three absorbers to be fitted. Changes of ionization state in at least one absorbing zone are required to fit data taken at different epochs. The partial-covering absorption model might offer an alternative explanation for the variability and spectrum of MCG-6-30-15, but the reflection model, together with the light-bending model, is fully consistent with the data and provides a more physical point of view.
2 Data reduction
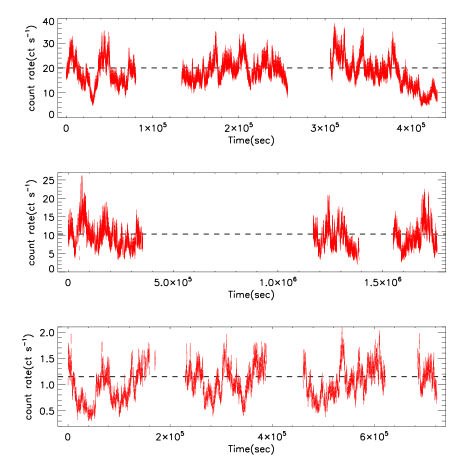
Data from XMM-Newton, Suzaku and Chandra provide observations of different epochs of MCG-6-30-15. These observations are in different flux states so that we can study spectrum variations and evolution in recent years. The 2-10 keV bolometric flux is ergs cm-2 s-1 for the XMM-Newton PN, ergs cm-2 s-1 for the Suzaku FI XIS, and ergs cm-2 s-1 for Chandra HEG. The simultaneous BeppoSAX observation with XMM-Newton and PIN data of Suzaku offer hard X-ray data above 10 keV and we use them for the study of hard excess.
2.1 XMM-Newton and BeppoSAX
We use the XMM-Newton observation taken from 2001 July 31 to August 05. In this observation EPIC MOS and PN cameras were operated in small window mode. The observation data files (ODFs) were reprocessed with the standard procedures of XMM-Newton Science Analysis System (SAS V9.0.0). Source data were extracted by XSELECT using a circle with a radius of 30 arcsec. The HEASoft package is incorporated into SAS. When saving the extracted spectrum in XSELECT, the script xsl xmm epic makeresp runs and creates the redistribution matrix file (RMF) and the ancillary response file (ARF). Background was taken from a region within the small window using a circle of the same size. Using the epatplot tool in SAS we confirm the observation is not piled up. Total exposure time of the PN camera is about 227 ks. The effective energy band of EPIC cameras is 0.5-10 keV.
We reduced the Reflection Grating Spectrometer (RGS; 0.4-2.0 keV) data following the standard procedures. Both the first order spectra of RGS1 and RGS2 data were used. Data of these instruments overlap over most of their effective energies. To analyse the data more efficiently we used RGS1 spectrum between 0.4 and 1.7 keV, and RGS2 spectrum between 0.9 and 1.2 keV. We use only RGS data, which are with better energy resolution, at low energies in all our fittings.
To study the spectral variability, difference spectra were produced by subtracting the low-flux state spectrum from the high-flux state one. Flux cuts were chosen in a similar way mentioned in Vaughan & Fabian (2004). We divided the EPIC PN 0.2-10 keV light curve into two flux intervals by 20 counts s-1 so that the two slices have a comparable number of total counts (). The slice with the count rate lower than 20 was used as the low-flux state spectrum, while the upper slice is devoted the high-flux state spectrum.
BeppoSAX observed the source during the 2001 XMM-Newton observation. Data were reduced following the guidelines in Matt et al. (1997). We use data from the Phoswitch Detector System (PDS; 13-200 keV) to extend the coverage of the observation to the higher energy band. The total exposure time of the PDS data is about 49 ks.
2.2 Suzaku
In 2006 January, MCG-6-30-15 was observed three times by Suzaku for a total of about 338 ks of exposure time. The X-ray Imaging Spectrometer (XIS) was operated in the normal mode. and editing modes were used throughout the observation. We use HEASoft V6.8 software package provided by NASA to reduce the data following the Suzaku Data Reduction Guide. We created new cleaned event files using the XISPI tool. Source products were extracted by XSELECT using a circular region of radius, while background products were extracted from a smaller circular region away from the source. Response files were produced by the script XISRESP, which calls XISRMFGEN and XISSIMARFGEN automatically. Spectra of the three front-illuminated (FI) CCD XIS detectors (XIS0, XIS2 and XIS3) were combined using the FTOOL addascaspec. For the difference spectrum, the low-flux state and high-flux state were defined in the same way as for XMM (see Fig. 1).
The Hard X-ray Detector (HXD) was operated in XIS-nominal pointing mode. The background spectrum of HXD/PIN consists of a non-X-ray background and a cosmic X-ray background. We used the non-X-ray background event file from a database of background observations made by the PIN diode. The appropriate response files for the observation epoch were used as well. The cosmic X-ray background was obtained by model estimation using the PIN response for flat emission distribution. We combined the source spectra and non-X-ray background spectra of different datasets first, then created a cosmic X-ray background spectrum for the entire observation, and added it to the total non-X-ray background spectrum.
2.3 Chandra
The Chandra HETGS observed MCG-6-30-15 between 2004 May 19 and 27.
Tools in the latest CIAO V4.2 software package were used to reduce the data.
We started with level 1 raw data and followed standard procedures in the analysis guide
111http://cxc.harvard.edu/ciao/guides/.
We examined the background light curve and removed periods
affected by background flaring, and obtained a good exposure time of
about 497 ks in total.
The tgdetect tool was used to find the zeroth and order position.
With appropriate filters, a level 2 event file could be generated and a type II pha (hereafter pha2) file
which contains complete information could be extracted.
Different orders of spectra of both the medium-energy gratings (MEG) and high-energy gratings
(HEG) were separated from the pha2 file.
In order to do the grating analysis in XSPEC, we also split the background
file from the pha2 file by executing the tg bkg script.
RMF and ARF files were created by the mkgrmf and the
fullgarf tools, respectively.
Since the zeroth-order source is piled up, only order spectra were used for further study.
The combined HEG (0.8-7.5 keV) and MEG (0.4-5 keV) first-order light curve is shown in Fig. 1.
3 Spectral Fitting
3.1 A Quick Look at Difference Spectra
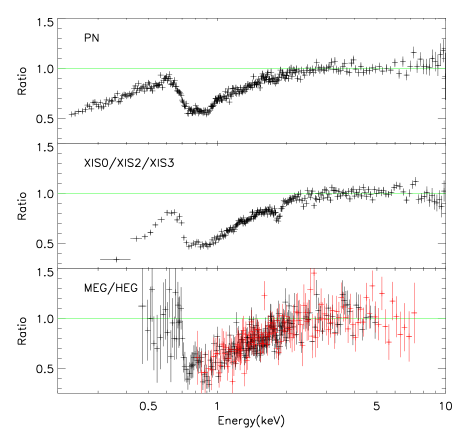
We create a new spectrum by subtracting a low-flux spectrum from a high-flux spectrum, where the definition of low-flux and high-flux states has been elaborated in Section 2. The resulting spectrum, which is called a difference spectrum, offers information on the nature of the variability because constant components in the original spectrum are removed. The difference spectrum was initially introduced into the analysis of MCG-6-30-15 as a demonstration that the variability is indeed consisted with a pure powerlaw (as further shown here). The absorption is a multiplicative component so in the case of a variable powerlaw, absorption components are revealed clearly in the difference spectrum (Fig. 2). If the variability is more complex, and no simple spectrum emerges, then a difference spectrum is difficult to interpret. Both Fabian et al. (2002) (using data of XMM-Newton) and Miniutti et al. (2007) (using data of Suzaku) reported that the reflection component remains constant throughout the observation period and does not appear in the difference spectra. In addition, the energy band above 3 keV in the difference spectra can be simply fitted by a power-law with Galactic absorption (cm-2), which means the warm absorbers have little effect on the spectrum above 3 keV, particularly in the Fe-K band, in contrast with the band below 3 keV.
We reproduce the difference spectra of XMM-Newton and Suzaku and confirm the conclusions in previous work. The difference spectra of Chandra HETGS are generated to compare changes in the difference spectra from observations taken at difference epochs. The difference spectra of the three satellites are shown as a ratio to a simple power-law model with Galactic absorption in Fig. 2. They are remarkably similar at low energies; they are much alike below 3 keV, at least down to 0.5 keV, which is the lowest energy we can trust XMM-Newton and Suzaku. An obvious drop below 2 keV is seen and goes to nearly the same depth in all difference spectra. This hints that the low energy spectra we obtained can be interpreted by the same model, and the warm absorbers did not change much between epochs. The 3-10 keV (3-7.5 keV for Chandra) difference spectra can be fitted by a simple powerlaw, implying the warm absorbers cause little curvature above 3 keV. There is no clue that warm absorbers mimic the “red wing” structure at iron line energies.

3.2 Warm Absorbers
The spectrum of MCG-6-30-15 shows complicated absorption in the soft X-ray band. Lee et al. (2001) showed at least two ionisation zones are needed to interpret the absorption lines. Sako et al. (2003) verified two outflow components with velocities of -150 km s-1 and -1900 km s-1. Later studies (e.g. Turner et al., 2004; Young et al., 2005) also confirmed the existence of the two kinematic components, with slightly different velocities. McKernan et al. (2007) reported both components and found two ionisation states in the slow components. Miller et al. (2008) adopted the three absorption zones mentioned in previous literature and added two more offset components to yield a good fit. The latest detailed kinematic analysis of Holczer et al. (2010), which used the absorption measure distribution (AMD) method which enables a full reconstruction, indicated there is a “local” ( = 0) component with a column density comparable to that of the Galactic absorption column of this object. The newly found third kinetic system (-2300 km s-1, the same shift as the redshift = 0.007749 of MCG-6-30-15) was confused with the fast component ( -1900 km s-1) because of similar velocities in the local frame of reference. Holczer et al. (2010) explained the component as absorption by ionised Interstellar Medium (ISM) in the Milky Way or areas nearby. So far the local absorption in MCG-6-30-15 is not yet confirmed by other work and its turbulence velocity remains unknown. Summarising the previous work, a highly-ionised (log ) absorption zone with turbulence velocity = 500 km s-1, and at least two zones of = 100 km s-1 with different ionisation states are required to explain the Chandra HETGS data (see Table 5 and 6 in Holczer et al., 2010).

We generated the ionised absorber models using XSTAR V2.2.0. The source luminosity between 1 and 1000 Ryd was assumed to be erg s-1 (Young et al., 2005) with a powerlaw spectrum shape at 0.1-20 keV, the gas density was set to be cm-3, and the covering factor equal to 1, for all models. Fitting parameters in these models are the photon index, the absorbing column, the ionisation parameter log , and the iron and oxygen abundances except for the fast component, whose oxygen abundance was fixed to unity. Previous work adopted a photon index between 2.0 and 2.2 when calculating the absorption tables. We allow of absorbers to vary with the value of the powerlaw incident continuum. Iron and oxygen abundances are not fixed in case of super-solar or sub-solar abundant environment. Turbulent velocities = 100, 500, and 1000 km s-1 and temperatures , , and K were applied to produce different absorption models that cover a wide range of parameters.
We then tested these absorbers on the Chandra MEG spectrum, with three absorbing zones and a blurred reflection component as a start. Since the outflow velocities of both the slow and the fast components determined by previous work are in good agreement (see Holczer et al., 2010), we constrained the redshifts of the absorbing zones to vary in a small range. The primary fitting results indicate a zone with = 500 km s-1 and two with = 100 km s-1 are required to fit the spectrum, which is consistent with previous work. The model was further tested on the low energy spectra ( keV) of XMM and Suzaku, and we found the ionisation state of the fast component is nearly constant on all datasets. Therefore we fixed the ionisation parameter log to be 3.82 (Miller et al., 2007; Holczer et al., 2010) in all the following fits.
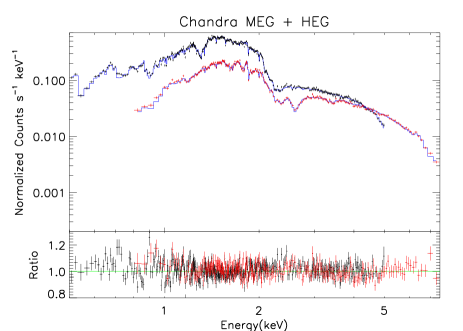
A fourth absorbing zone, corresponding to the third kinetic system detected in Holczer et al. (2010), with = 100 km s-1, , and cm-2, was added to test how much this component affects the fitting, and the detailed information of the absorbing zones we use is listed in Table 1. The results of other fitting parameters are shown in Table 2. Clearly the model with the fourth component yields a better fit to the Chandra spectrum of MCG-6-30-15. The model struggles slightly below 1 keV, where the most residuals come from. We then model the Fe L edge at 0.7 keV using dust in TBNEW, and the result is shown in Fig. 3.
As to the difference spectra, we fit them with a model consisting of a powerlaw, Galactic absorption and the absorbing zones we use to fit the real spectrum. The model fits all our difference spectra without difficulty, indicating the reflection component is sufficiently removed by the difference spectrum technique.
3.3 Full Spectrum
When constructing a model for the full spectra, a relativistic blurred reflection component and a neutral reflection component should be included in order to fit the skewed, broad iron line and a narrow iron line reflected from distant matter (detected by Young et al., 2005). We model reflection from the innermost regions of the accretion disc with the self-consistent model REFLIONX (Ross & Fabian, 2005) convolved by the KDBLUR model, and the neutral reflection with REFLIONX only (). The iron abundance of the reflection components are bound for consistency. We set the outer radius of the accretion disc to be 400 R in all fits, where R is the gravitational radius GM/c2. Nevertheless, the two-reflection model is still not enough to fit the iron line structure perfectly, and we introduce another narrow line modelled by ZGAUSS. The new model works well on joint MEG and HEG spectra (see Fig. 3) and explains the complex structure of the iron line.
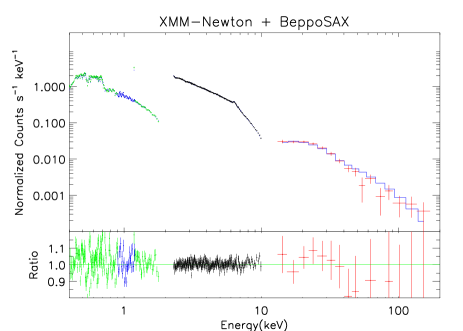
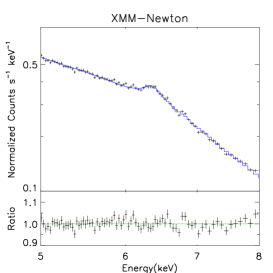
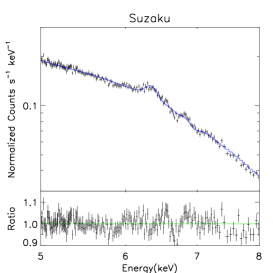
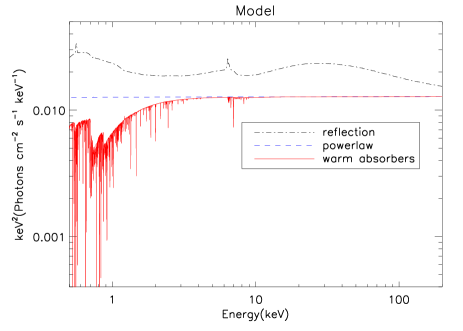
Some claimed the hard excess seen in some AGNs, included MCG-6-30-15, cannot be explained by the reflection model, and only clumpy absorbers model can work. Miller et al. (2008) first modelled the hard excess with absorbed reflection, but in their later work (i.e. Miller et al., 2009) they claimed the high energy emission is dominated by absorption, and the hard excess is reproduced by the continuum covered by a partially covering absorber. To check the availability of the reflection model at high energies, we use the simultaneous XMM and BeppoSAX spectra and both Suzaku XIS and PIN data, adopting the same model used to fit the Chandra HETGS spectra. The results (see Fig. 4) show the reflection model is able to produce a “Compton hump” easily, and the hard excess can be well explained by simple reflection without any additional absorption. The zoom-in iron lines of different datasets are shown in Fig. 5, and Fig. 6 shows the decomposed components of the final model.
The resulting shown in Table 2 may not be satisfactory enough. If 1 percent systematic errors are included (using the SYSTEMATIC command in XSPEC) for the whole band of Suzaku, and for XMM and Chandra above 1 keV, is acceptable at 1.00, 1.02 and 1.04, respectively.
| Absorber | fast | slow (1) | slow (2) | local |
| (K) | ||||
| Chandra | ||||
| (0.406) | ||||
| log | (3.82) | |||
| XMM + BeppoSAX | ||||
| (0.406) | ||||
| log | (3.82) | |||
| Suzaku | ||||
| (0.406) | ||||
| log | (3.82) | |||
| parameter | Chandra HETGS | XMM + BeppoSAX | Suzaku |
| model with 4 absorbing zones | |||
| index | 3.09 | ||
| (R) | 2.50 | ||
| ∘ | ∘ | ||
| 2417.7/2139 | 5059.3/3809 | 1684.7/1576 | |
| model with 3 absorbing zones | |||
| index | 3.34 | ||
| (R) | 2.66 | ||
| ∘ | ∘ | ||
| 2516.4/2140 | 5111.9/3810 | 1688.3/1577 | |
| model with 2 absorbing zones | |||
| - | |||
| index | - | 2.98 | |
| (R) | - | 3.11 | |
| - | |||
| - | |||
| - | ∘ | ||
| - | 6040.9/3815 | 1692.0/1582 | |
| work | Holczer et al. | Miller et al. | present work | |
|---|---|---|---|---|
| full covering zones | ||||
| fast | (80.0) | |||
| log | (3.95) | (3.82) | ||
| slow(1) | ||||
| log | -1.5-0.5 | |||
| slow(2) | ||||
| log | 1.5-3.5 | |||
| local | 0.40 | - | (0.406) | |
| log | - | - | ||
| partial covering zones | ||||
| zone 1 | - | - | ||
| log | - | - | - | |
| zone 2 | - | - | ||
| log | - | - | ||
3.4 More Tests on XMM and Suzaku
We test the 3-absorber model on XMM and Suzaku observations. Since data points at low energies are statistically stronger than those at higher energies, the model tends to fit the low-energy spectrum and results in an unfitted iron line profile in Suzaku data. We then fit the spectrum above 3 keV first and fix the parameters of the convolution model (the emissivity profile index, inner radius and inclination angle ) so that the model will not ignore the iron line completely when fitting the full spectrum. The results are shown in Table 2.
As stated in Section 3.2, Chandra HETGS data tend to include the local absorption component, and we test how necessary this component is needed on XMM and Suzaku observations as well. The of the fittings of both XMM Suzaku data do improve (see Table 2), though not much in XMM data. However, the ionisation state of one of the slow sub-components in Suzaku is close to the value of the local component (see Table 1), so it remains unclear whether Suzaku data are able to resolve the additional absorption. Whether the 4-absorber model or the 3-absorber model is used, the ionisation states of the slow component remain constant, indicating the local absorption may not much affect the fits.
The joint XMM and BeppoSAX and the Suzaku observations do not show a strong tendency for the local absorption component. To test if it is likely that even fewer absorbing zones, say, two as Miyakawa et al. (2009) suggested, explain the spectrum, one of the slow sub-components was removed from the model. The results of the 2-absorption model are also shown in Table 2. The 2-absorption model results in a worse in both XMM and Suszaku datasets, implying at least three absorbing zones are required to fit the spectrum of MCG-6-30-15.
To examine if the real spectra in different periods have similarities like the difference spectra, we put the best-fitting model of the joint XMM and BeppoSAX spectrum to the Suzaku broadband spectrum and modify the normalisation slightly. It seems the spectra of these observations above 3 keV look fairly similar, but there are obvious differences below 2 keV, where the absorption dominates the spectrum. The fact that the iron line band and hard excess appear constant but variations in source luminosity below 10 keV motivated the work of the clumpy absorption model. Miller et al. (2009) suggested the long-term X-ray variability may be caused by variation in the covering factor.
Nevertheless, the differences below 2 keV in the spectra may be alternatively explained by changes in column densities (see Walton et al., 2010) and ionisation states in warm absorbers. Since there are outflowing components in MCG-6-30-15, column densities of these components may vary throughout time, and their ionisation states may possibly change due to the re-allocation of clouds. We fit Suzaku data by the best-fitting model obtained from the joint XMM and BeppoSAX spectrum, with all the parameters of warm absorbers fixed except the column densities.
4 Discussion
4.1 Warm Absorbers
Table 2 shows the of the fits using the model with and without the fourth local absorption component. Only Chandra data show a strong tendency to include the local absorption component, which improves the fitting of Suzaku data but does not show strong evidence of existence, and XMM observation only gets a slightly better fit with it. The local absorption component in fact contributes little to the spectrum, and only a few oxygen lines around 20 Å are slightly shifted by the component. Besides, if this component is caused by the ISM in the local group as Holczer et al. (2010) suggest, its ionisation state should stay constant in all datasets. But the ionisation states of the component obtained from Chandra and Suzaku are significantly different (see Table 1), indicating the data may have trouble constraining the parameters of this zone.
The result is expected because XMM and Suzaku do not have the sharp energy resolution of Chandra. Holczer et al. (2010) claimed the third kinetic component was previously confused with the fast component because of similar velocities; even Chandra does not have enough resolution to constrain the line width. Therefore it is not surprising that Suzaku could not discern these two components, considering the weak signature one of them. Our spectral fitting results do favour its existence in the Chandra spectra of MCG-6-30-15, but cannot judge whether the component is caused by the Galactic absorption or another outflow; the issue is not relevant to the present work. So far there have already been three kinetic systems, which are described by four ionisation absorbers in this work, confirmed to be responsible for the soft X-ray band.
The highly ionised fast component, with 500 km s-1, is required in all the observations, though the column density needed for each observation differs (see Table 1). The fast component was reported in all previous work of kinetic analysis of MCG-6-30-15, and our result again shows its importance in modelling the spectra. The main features it causes are the Fe XXV ( 6.7 keV) and Fe XXVI (6.9 keV) absorption lines, which can be seen in Fig. 5. The fast component is also the most important absorber that affects the iron line band.
Summarising the fitting results obtained by the 3-absorption and 2-absorption models (see Table 2), it seems XMM and Suzaku data are able to distinguish the sub-components in the slow outflow. Nonetheless, the values of ionisation states in XMM and Suzaku data are different from that in Chandra data (see Table 1). This could be because changes in ionisation states are needed to interpret the variation in the low spectrum, or simply because XMM and Suzaku spectra are not good enough to constrain parameters of the sub-components well, though they do need two ionised zones to model the slow component.
4.2 Robustness of the Reflection Model
The previous work (e.g. Vaughan & Fabian, 2004; Miniutti et al., 2007, etc.) which applied a reflection model on MCG-6-30-15 suggested the photon index to be ; the emissivity index is around 3; the inner radius of the disc lies at somewhere less than 2 R; an iron abundance of 2 to 3 solar is needed to interpret the spectra, and the inclination angle should be around . Most of the fitting parameters of the relativistic reflection model, shown in Table 2, are in good agreement with the assumption of previous work. Note that the previous work analysed the spectra above 3 keV only, and our work includes the low energy band that is seriously influenced by the warm absorbers. This implies the results obtained from the reflection model would not be affected by absorbing zones and are reliable.
Zycki et al. (2010) claimed the results received through the reflection model are model-dependent. They found quite different powerlaw indexes when they fit the Suzaku spectrum above 3 keV () and the spectrum above 1 keV (), but we do not find this with our analysis. The we obtained from a 3-absorber model or a 4-absorber model are all between 1.9 and 2.1, and the energy band we use is down to 0.5 keV. However, photon index does change slightly when we adopt models with fewer warm absorbers. The disagreement might be caused by the warm absorbers used to model the soft X-ray spectrum. The diverse photon indexes Zycki et al. (2010) obtain is simply due to the warm absorbers rather than the REFLIONX model. Additionally, the extra neutral ( = 1.0) REFLIONX component that we used to fit the narrow iron line works well, implying REFLIONX can produce neutral or mild ionised reflection without difficulty (we use a REFLIONX grid which extends to = 1.0, contrary to that used by Zycki et al. 2010).
4.3 Comparisons with Previous Research
Table 3 lists parameters of warm absorbers obtained by different models. Holczer et al. (2010) suggested the slow component spans a considerable range of ionisation, which are -1.5 log 0.5 and 1.5 log 3.5 for the sub-components, respectively. The ionisation state of slow (1) in Miller et al. (2009) and our best-fitting model for Chandra data (see Table 3) do not fall in the former range. The ionisation states of slow (2) of Miller et al. (2009) and present work are quite close and lie well in the expected range of Holczer et al. (2010).
The column density we get for each absorbing zone differs significantly from the values obtained in previous literature. They are probably the most difficult parameters to be constrained, because results depend on the way of modelling the continuum and the research tools that have been used. Column densities are also sometimes under- or over-estimated in order to fit complex structures in a spectrum as complicated as in MCG-6-30-15, as discussed by Holczer et al. (2010). The different parameters we used for generating XSTAR grids might again be the reason we have disagreement with previous estimations. Moreover, REFLIONX contributes some soft emission and warm absorbers may need higher column densities to fit the spectrum.
Miller et al. (2008, 2009) used two additional partial-covering clumpy absorbing zones to model the spectrum. One of them mimicked the shape of broadened asymmetric iron line, and the other partially covered the continuum in order to explain the hard excess. The main difference between the absorption-dominated model and the reflection-dominated model is that the former has no distortions due to relativistic effects. Miller et al. (2009) claimed the reflection (relativistic effects not considered) model failed to interpret the hard excess. In fact the hard excess can be simply explained by a relativistically blurred reflection component without any absorption. The complex iron line structure can also be fitted by a combination of blurred and neutral reflections and absorptions caused by a highly ionised warm absorber. Both the absorption and the reflection models explain the spectrum and variability of MCG-6-30-15. Our result does not rule out the “3+2” model but shows the reflection model that includes relativistic effects works. We consider this to be a more consistent physical scenario. Since the energy release in both models occurs very close to the black hole, where relativistic reflection is expected.
5 Conclusion
The complex X-ray spectrum of MCG-6-30-15 can be well explained by a model consisting of relativistic reflection and three or four completely covered absorbing zones, in contrast with the conclusion of Miller et al. (2008, 2009). Our result does not rule out the absorption-dominated scenario but does support the reflection-dominated model. In addition, we use absorbing zones already confirmed by previous analysis, while Miller et al. (2008, 2009) added two offset components to yield good fits. The “3+2” model is supported by the Principal Components Analysis (Miller et al., 2007). However, if there is an absorber responsible for the variability and the “red wing” structure at 2-6 keV, structures such as curvature should appear in the difference spectra at this band, and it should leave some signature that could be traced by kinetic analysis. The difference spectra retrieved from the observations we use (see Fig. 2) is well fitted by a simple powerlaw above 3 keV, contrary to the assumption that the spectrum above 3 keV is dominated by absorption.
A highly-ionised fast outflow is confirmed by all observations. This is the most constrained absorbing zone among the warm absorbers needed to explain the X-ray spectrum of MCG-6-30-15. The slow component with two ionisation states are confirmed as well, but XMM and Suzaku data are not good enough to determine the ionisation states correctly. The ”local absorption” component detected by Holczer et al. (2010) does improve our fitting to the Chandra HETGS spectra. By summarising the results we find three absorbing zones are required to fit XMM and Suzaku data, and a fourth zone is need to fit Chandra data completely. The 2-absorber model suggested by Miyakawa et al. (2009) is not sufficient to interpret the complex spectrum of MCG-6-30-15, so the discrepancy in photon index between the spectrum above 3 keV and above 1 keV claimed by Zycki et al. (2010) is due to the use of inappropriate warm absorbers.
We also test the robustness of our model and find the results are in good agreement with previous work. Therefore we conclude that the reflection model can robustly interpret the spectra of MCG-6-30-15 in the range from 0.5-200 keV without any partial-covering absorbers.
Acknowledgements
We thank Randy Ross for the extensive REFLIONX grids used and Tim Kallman for providing XSTAR. CYC thank Dominic Walton for help in producing the XSTAR grids.
References
- Ballantyne et al. (2002) Ballantyne D. R., Ross R. R., Fabian A. C., 2002, MNRAS, 336, 867
- Branduardi-Raymont et al. (2001) Branduardi-Raymont G., Sako M., Kahn S. M., Brinkman A. C., Kaastra J. S., Page M. J., 2001, A&A, 365, L140
- Fabian et al. (2000) Fabian A. C., Iwasawa K., Reynolds C. S., Young A. J., 2000, PASP, 112, 1145
- Fabian et al. (1989) Fabian A. C., Rees M. J., Stella L., White N. E., 1989, MNRAS, 238, 729
- Fabian et al. (2002) Fabian A. C., Vaughan S., Nandra K., Iwasawa K., Ballantyne D. R., Lee J. C., De Rosa A., Turner A., Young A. J., 2002, MNRAS, 335, L1
- Guainazzi et al. (1999) Guainazzi M., Vacanti G., Malizia A., O’Flaherty K. S., Palazzi E., Parmar A. N., 1999, A&A, 342, 124
- Holczer et al. (2010) Holczer T., Behar E., Arav N., 2010, ApJ, 708, 981
- Inoue & Matsumoto (2003) Inoue H., Matsumoto C., 2003, PASJ, 55, 625
- Lee et al. (2002) Lee J. C., Iwasawa K., Houck J. C., Fabian A. C., Marshall H. L., Canizares C. R., 2002, ApJ, 570, L47
- Lee et al. (2001) Lee J. C., Ogle P. M., Canizares C. R., Marshall H. L., Schulz N. S., Morales R., Fabian A. C., Iwasawa K., 2001, ApJ, 554, L13
- Matsumoto et al. (2003) Matsumoto C., Inoue H., Fabian A. C., Iwasawa K., 2003, PASJ, 55, 615
- Matt et al. (1997) Matt G., Guainazzi M., Frontera F., Bassani L., Brandt W. N., Fabian A. C., Fiore F., Haardt F., Iwasawa K., Maiolino R., Malaguti G., Marconi A., Matteuzzi A., Molendi S., Perola G. C., Piraino S., Piro L., 1997, A&A, 325, L13
- McKernan et al. (2007) McKernan B., Yaqoob T., Reynolds C. S., 2007, MNRAS, 379, 1359
- Miller et al. (2008) Miller L., Turner T. J., Reeves J. N., 2008, A&A, 483, 437
- Miller et al. (2009) —, 2009, MNRAS, 399, L69
- Miller et al. (2007) Miller L., Turner T. J., Reeves J. N., George I. M., Kraemer S. B., Wingert B., 2007, A&A, 463, 131
- Miniutti & Fabian (2004) Miniutti G., Fabian A. C., 2004, MNRAS, 349, 1435
- Miniutti et al. (2007) Miniutti G., Fabian A. C., Anabuki N., Crummy J., Fukazawa Y., Gallo L., Haba Y., Hayashida K., Holt S., Kunieda H., Larsson J., Markowitz A., Matsumoto C., Ohno M., Reeves J. N., Takahashi T., Tanaka Y., Terashima Y., Torii K., Ueda Y., Ushio M., Watanabe S., Yamauchi M., Yaqoob T., 2007, PASJ, 59, 315
- Miyakawa et al. (2009) Miyakawa T., Ebisawa K., Terashima Y., Tsuchihashi F., Inoue H., Zycki P., 2009, PASJ, 61, 1355
- Niedźwiecki & Miyakawa (2010) Niedźwiecki A., Miyakawa T., 2010, A&A, 509, A22+
- Niedźwiecki & Życki (2008) Niedźwiecki A., Życki P. T., 2008, MNRAS, 386, 759
- Otani et al. (1996) Otani C., Kii T., Reynolds C. S., Fabian A. C., Iwasawa K., Hayashida K., Inoue H., Kunieda H., Makino F., Matsuoka M., Tanaka Y., 1996, PASJ, 48, 211
- Reeves et al. (2009) Reeves J. N., O’Brien P. T., Braito V., Behar E., Miller L., Turner T. J., Fabian A. C., Kaspi S., Mushotzky R., Ward M., 2009, ApJ, 701, 493
- Reynolds & Nowak (2003) Reynolds C. S., Nowak M. A., 2003, Phys. Rep., 377, 389
- Reynolds et al. (1997) Reynolds C. S., Ward M. J., Fabian A. C., Celotti A., 1997, MNRAS, 291, 403
- Risaliti et al. (2009) Risaliti G., Braito V., Laparola V., Bianchi S., Elvis M., Fabbiano G., Maiolino R., Matt G., Reeves J., Salvati M., Wang J., 2009, ApJ, 705, L1
- Ross & Fabian (1993) Ross R. R., Fabian A. C., 1993, MNRAS, 261, 74
- Ross & Fabian (2005) —, 2005, MNRAS, 358, 211
- Sako et al. (2003) Sako M., Kahn S. M., Branduardi-Raymont G., Kaastra J. S., Brinkman A. C., Page M. J., Behar E., Paerels F., Kinkhabwala A., Liedahl D. A., den Herder J. W., 2003, ApJ, 596, 114
- Suebsuwong et al. (2006) Suebsuwong T., Malzac J., Jourdain E., Marcowith A., 2006, A&A, 453, 773
- Tanaka et al. (1995) Tanaka Y., Nandra K., Fabian A. C., Inoue H., Otani C., Dotani T., Hayashida K., Iwasawa K., Kii T., Kunieda H., Makino F., Matsuoka M., 1995, Nature, 375, 659
- Turner et al. (2004) Turner A. K., Fabian A. C., Lee J. C., Vaughan S., 2004, MNRAS, 353, 319
- Turner et al. (2003) Turner A. K., Fabian A. C., Vaughan S., Lee J. C., 2003, MNRAS, 346, 833
- Turner et al. (2009) Turner T. J., Miller L., Kraemer S. B., Reeves J. N., Pounds K. A., 2009, ApJ, 698, 99
- Vaughan & Fabian (2004) Vaughan S., Fabian A. C., 2004, MNRAS, 348, 1415
- Walton et al. (2010) Walton D. J., Reis R. C., Fabian A. C., 2010, MNRAS, 408, 601
- Young et al. (2005) Young A. J., Lee J. C., Fabian A. C., Reynolds C. S., Gibson R. R., Canizares C. R., 2005, ApJ, 631, 733
- Zycki et al. (2010) Zycki P. T., Ebisawa K., Niedzwiecki A., Miyakawa T., 2010, ArXiv e-prints