Curved Gabor Filters
for Fingerprint Image Enhancement
Abstract
Gabor filters play an important role in many application areas for the enhancement of various types of images and the extraction of Gabor features. For the purpose of enhancing curved structures in noisy images, we introduce curved Gabor filters111This paper is an arXiv preprint version of [23]. which locally adapt their shape to the direction of flow. These curved Gabor filters enable the choice of filter parameters which increase the smoothing power without creating artifacts in the enhanced image. In this paper, curved Gabor filters are applied to the curved ridge and valley structure of low-quality fingerprint images. First, we combine two orientation field estimation methods in order to obtain a more robust estimation for very noisy images. Next, curved regions are constructed by following the respective local orientation and they are used for estimating the local ridge frequency. Lastly, curved Gabor filters are defined based on curved regions and they are applied for the enhancement of low-quality fingerprint images. Experimental results on the FVC2004 databases show improvements of this approach in comparison to state-of-the-art enhancement methods.
Index Terms
Curved Gabor filter, ridge frequency estimation, curved regions, curvature, FVC2004, image enhancement, orientation field estimation, fingerprint recognition, verification tests, biometrics.
1 Introduction and Related Work
Gabor functions [18], in the form of Gabor filters (GFs) [19] and Gabor wavelets [34], are applied for a multitude of purposes in many areas of image processing and pattern recognition. Basically, the intentions for using GF and log-GF [16] can be grouped into two categories: first, GF aim at enhancing images [38] and the second common goal is to extract Gabor features obtained from responses of filterbanks. Typical fields of application include:
Texture
Medical and biological applications
In medical imaging, GFs are applied for the enhancement of structures like e.g. finger veins [61] and muscle fibers in ultrasound images [63], for the detection of blood vessels in retinal images [55], as well as for many other tasks like e.g. analyzing event-related brain activity [50], assessing osteoporosis in radiographs [43] and for modeling the behavior of simple cells in the mammalian visual cortex [11].
Optical character recognition
Object recognition
Biometrics
Gabor functions play an important role in biometric recognition. They are employed for many physical or behavioral traits including iris [13], face [14], facial expression [47], speaker [44], speech [56], emotion recognition in speech [26], gait [53], handwriting [64], palmprint [59], and fingerprint recognition.
Fingerprint recognition
Gabor filterbanks are used for the segmentation [1] and quality estimation [49] of fingerprint images, for core point estimation [35], classification [29] and fingerprint matching based on Gabor features [30, 35]. GFs are also employed for generating synthetic fingerprints [6]. The use of GF for fingerprint image enhancement was introduced in [27].
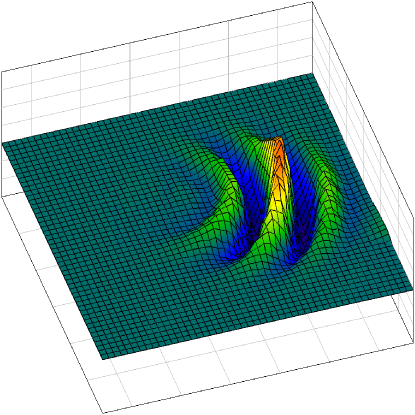
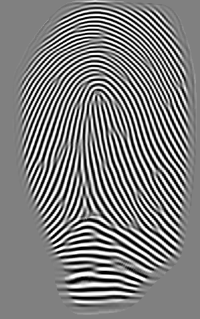
All aforementioned applications have in common that they use straight Gabor filters, i.e. the x- and y-axis of the window underlying the GF are straight lines which are orthogonal. Having the natural curvature inherent to fingerprints in mind, we propose curved Gabor filters (see Figure 1) for image enhancement [22]. A GF can be regarded as an anisotropic diffusion filter which smooths along the orientation and performs inverse diffusion orthogonal to the orientation [51]. The basic idea is to adopt the GF to the curved structure and smooth along the bent ridges and valleys. While this paper focuses on fingerprint image enhancement, curved Gabor filters might also be useful in other fields of application, e.g. for the enhancement of curved structures like muscle fibers, cell filaments or annual rings in tree discs.
1.1 Fingerprint Image Enhancement
Image quality [2] has a big impact on the performance of a fingerprint recognition system (see e.g. [52] and [8]). The goal of image enhancement is to improve the overall performance by optimally preparing input images for later processing stages. Most systems extract minutiae from fingerprints [42], and the presence of noise can interfere with the extraction. As a result, true minutiae may be missed and false minutiae may be detected, both having a negative effect on the recognition rate. In order to avoid these two types of errors, image enhancement aims at improving the clarity of the ridge and valley structure. With special consideration to the typical types of noise occurring in fingerprints, an image enhancement method should have three important properties:
-
•
reconnect broken ridges, e.g. caused by dryness of the finger or scars;
-
•
separate falsely conglutinated ridges, e.g. caused by wetness of the finger or smudges;
-
•
preserve ridge endings and bifurcations.
Enhancement of low quality images (occurring e.g. in all databases of FVC2004 [41]) and very low quality prints like latents (e.g. NIST SD27 [20]) is still a challenge. Techniques based on contextual filtering are widely used for fingerprint image enhancement [42] and a major difficulty lies in an automatic and reliable estimation of the local context, i.e. the local orientation and ridge frequency as input of the GF. Failure to correctly estimate the local context can lead to the creation of artifacts in the enhanced image [33] which consequently tends to increase the number of identification or verification errors.
For low quality images, there is a substantial risk that an image enhancement step may impair the recognition performance as shown in [17] (results are cited in Table 1 of Section 5). The situation is even worse for very low quality images, and current approaches focus on minimizing the efforts required by a human expert for manually marking information in images of latent prints (see [7] and [57]).
The present work addresses these challenges as follows: in the next section, two state-of-the-art methods for orientation field estimation are combined for obtaining an estimation which is more robust than each individual one. In Section 3, curved regions are introduced and employed for achieving a reliable ridge frequency estimation. Based on the curved regions, in Section 4 curved Gabor filters are defined. In Section 5, all previously described methods are combined for the enhancement of low quality images from FVC2004 and performance improvements in comparison to existing methods are shown. The paper concludes with a discussion of the advantages and drawbacks of this approach, as well as possible future directions in Section 6.
2 Orientation Field Estimation
In order to obtain a robust orientation field (OF) estimation for low quality images, two estimation methods are combined: the line sensor method [24] and the gradients based method [4] (with a smoothing window size of 33 pixels). The OFs are compared at each pixel. If the angle between both estimations is smaller than a threshold (here ), the orientation of the combined OF is set to the average of the two. Otherwise, the pixel is marked as missing. Afterwards, all inner gaps are reconstructed and up to a radius of 16 pixels, the orientation of the outer proximity is extrapolated, both as described in [24].
Results of verification tests on all 12 databases of FVC2000 to 2004 [39, 40, 41] showed a better performance of the combined OF applied for contextual image enhancement than each individual OF estimation [22]. The OF being the only parameter that was changed, lower equal error rates can be interpreted as an indicator that the combined OF contains fewer estimation errors than each of the individual estimations. Simultaneously, we regard the combined OF as a segmentation of the fingerprint image into foreground (endowed with an OF estimation) and background.
The information fusion strategy for obtaining the combined OF was inspired by [45]. The two OF estimation methods can be regarded as judges or experts and the orientation estimation for a certain pixel as a judgment. If the angle between both estimations is greater than a threshold , the judgments are considered as incoherent, and consequently not averaged. If an estimation method provides no estimation for a pixel, it is regarded as abstaining. Orientation estimations for pixels with incoherent or abstaining judges are reconstructed or extrapolated from pixels with coherent judgments.
3 Ridge Frequency Estimation Using Curved Regions
In [27], a ridge frequency (RF) estimation method was proposed which divides a fingerprint image into blocks of pixels, and for each block, it obtains an estimation from an oriented window of pixels by a method called ‘x-signature’ which detects peaks in the gray-level profile. Failures to estimate a RF, e.g. caused due to presence of noise, curvature or minutiae, are handled by interpolation and outliers are removed by low-pass filtering. In our experience, this method works well for good and medium quality prints, but it encounters serious difficulties obtaining a useful estimation when dealing with low quality prints.
In this section, we propose a RF estimation method following the same basic idea - to obtain an estimation from the gray-level profile - but which bears several improvements in comparison to [27]: (i) the profile is derived from a curved region which is different in shape and size from the oriented window of the x-signature method, (ii) we introduce an information criterion (IC) for the reliability of an estimation and (iii) depending on the IC, the gray-level profile is smoothed with a Gaussian kernel, (iv) both, minima and maxima are taken into account and (v) the inverse median is applied for the RF estimate.
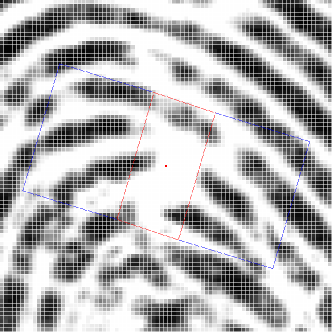
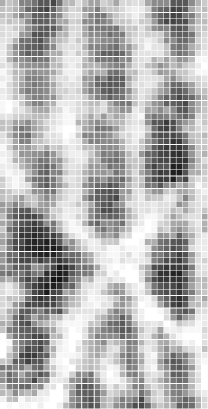
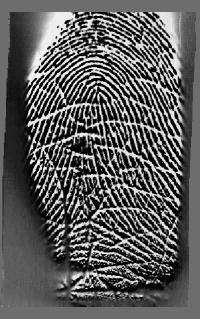
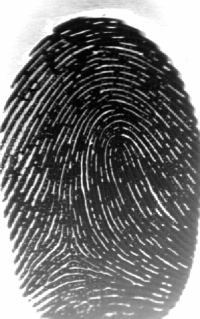
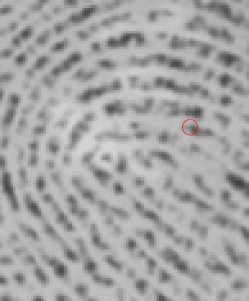
If the clarity of the ridge and valley structure is disturbed by noise, e.g. caused by dryness or wetness of the finger, an oriented window of pixels may not contain a sufficient amount of information for a RF estimation (e.g. see Figure 3, left image). In regions where the ridges run almost parallel, this may be compensated by averaging over larger distances along the lines. However, if the ridges are curved, the enlargement of the rectangular window does not improve the consistency of the gray-profile, because the straight lines cut neighboring ridges and valleys. In order to overcome this limitation, we propose curved regions which adapt their shape to the local orientation. It is important to take the curvature of ridges and valleys into account, because about 94 % of all fingerprints belong to the classes right loop, whorl, left loop and tented arch [31], so that they contain core points and therefore regions of high curvature.
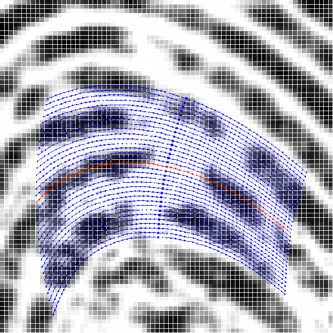
3.1 Curved Regions
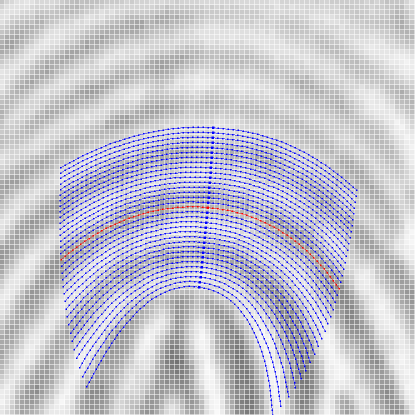
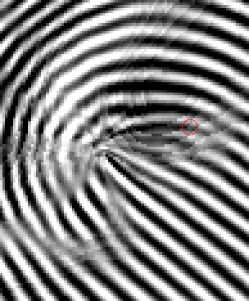
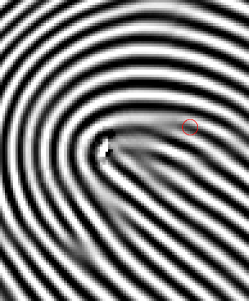
Let be the center of a curved region which consists of parallel curves and points along each curve. The midpoints (depicted as blue squares in Figure 2) of the parallel curves are initialised by following both directions orthogonal to the orientation for steps of one pixel unit, starting from the central pixel (red square). At each step, the direction is adjusted, so that it is orthogonal to the local orientation. If the change between two consecutive local orientations is greater than a threshold, the presence of a core point is assumed, and the iteration is stopped. Since all x- and y-coordinates are decimal values, the local orientation is interpolated. Nearest neighbour and bilinear interpolation using the orientation of the four neighboring pixels are examined in Section 5. Starting from each of the midpoints, curves are obtained by following the respective local orientation and its opposite direction (local orientation ) for steps of one pixel unit, respectively.
3.2 Curvature estimation
As a by-product of constructing curved regions, a pixel-wise estimate of the local curvature is obtained using the central curve of each region (cf. the red curves in Figures 2 and 3). The estimate is computed by adding up the absolute values of differences in orientation between the central point of the curve and the two end points. The outcome is an estimate of the curvature, i.e. integrated change in orientation along a curve (here: of 65 pixel steps). For an illustration, see Figure 4. The curvature estimate can be useful for singular point detection, fingerprint alignment or as additional information at the matching stage.
3.3 Ridge Frequency Estimation


Gray values at the decimal coordinates of the curve points are interpolated. In this study, three interpolation methods are taken into account: nearest neighbor, bilinear and bicubic [48] (considering 1, 4 and 16 neighboring pixels for the gray value interpolation, respectively). The gray-level profile is produced by averaging the interpolated gray values along each curve (in our experiments, the minimum number of valid points is set to 50% of the points per line). Next, local extrema are detected and the distances between consecutive minima and consecutive maxima are stored.
The RF estimate is the reciprocal of the median of the inter-extrema distances (IEDs). The proportion of the largest IED to the smallest IED is regarded as an information parameter for the reliability of the estimation:
Large values of are considered as an indicator for the occurrence of false extrema in the profile (see Figure 5). or for the absence of true extrema. Only RF estimations where is below a threshold are regarded as valid (for the tests in Section 5, we used ). If of the gray-level profile produced by averaging along the curves exceeds the threshold, then, in some cases it is still possible to obtain a feasible RF estimation by smoothing the profile which may remove false minima and maxima, followed by a repetition of the estimation steps (see Figure 5). A Gaussian with a size of 7 and was applied in our study, and a maximum number of three smoothing iterations was performed. In an additional constraint we require that at least two minima and two maxima are detected and the RF estimation is located within an appropriate range of valid values (between and ). As a final step, the RF image is smoothed by averaging over a window of size pixels.
4 Curved Gabor Filters
4.1 Definition
The Gabor filter is a two-dimensional filter formed by the combination of a cosine with a two-dimensional Gaussian function and it has the general form:
| (1) |
| (2) |
| (3) |
In (1), the Gabor filter is centered at the origin. denotes the rotation of the filter related to the x-axis and the local frequency. and signify the standard deviation of the Gaussian function along the x- and y-axis, respectively.
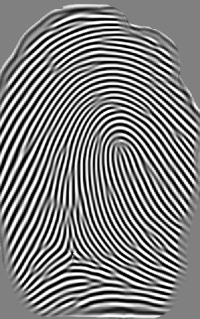
A curved Gabor filter is computed by mapping a curved region to a two-dimensional array, followed by a point-wise multiplication with an unrotated GF (). The curved region centered in consists of parallel lines and points along each line. The corresponding array contains the interpolated gray values (see right image in Figure 2). The enhanced pixel is obtained by:
| (4) |
Finally, differences in brightness are compensated by a locally adaptive normalization (using the formula from [27] who proposed a global normalization as a first step before the OF and RF estimation, and the Gabor filtering). In our experiments, the desired mean and standard deviation were set to 127.5 and 100, respectively, and neighboring pixels within a circle of radius were considered.
4.2 Parameter Choice
In the case of image enhancement by straight GFs, [27] and other authors (e.g. [42]) use quadratic windows of size pixels and choices for the standard deviation of the Gaussian of , or very similar values. We agree with their arguments that the parameter selection of and involves a trade-off between an ineffective filter (for small values of and ) and the risk of creating artifacts in the enhanced image (for large values of and ). Moreover, the same reasoning holds true for the size of the window. In analogy to the situation during the RF estimation (see Figure 3), enlarging a rectangular window in a region with curved ridge and valley flow increases the risk for introducing noise and, as a consequence of this, false structures into the enhanced image.
The main advantage of curved Gabor filters is that they enable the choice of larger curved regions and high values for and without creating spurious features (see Figures 6 and 7). In this way, curved Gabor filters have a much greater smoothing potential in comparison to traditional GF. For curved GFs, the only limitation is the accuracy of the OF and RF estimation, and no longer the filter itself.
The authors of [65] applied a straight GF for fingerprint enhancement and proposed to use a circle instead of a square as the window underlying the GF in order to reduce the number of artifacts in the enhanced image. Similarly, we tested an ellipse with major axis and minor axis instead of the full curved region, i.e. in Equation 4, only those interpolated gray values of array are considered which are located within the ellipse. In our tests, both variants achieved similar results on the FVC2004 databases (see Table 1). As opposed to [65], the term ‘circular GF’ is used in [60] and [61] for denoting the case .
5 Results
5.1 Test Setup
Two algorithms were employed for matching the original and the enhanced gray-scale images. The matcher “BOZORTH3” is based on the NIST biometric image software package (NBIS) [54], applying MINDTCT for minutiae extraction and BOZORTH3 for template matching. The matcher “VeriFinger 5.0 Grayscale” is derived from the Neurotechnology VeriFinger 5.0 SDK.
5.2 Verification tests
| Matcher: MINDTCT and BOZORTH3 | ||||
| Enhancement method | DB1 | DB2 | DB3 | DB4 |
| Original images | 14.5 | 9.5 | 6.2 | 7.3 |
| Traditional Gabor filter | ||||
| Hong, Wan, Jain [27] | (16.9) | 14.4 | 7.1 | 9.8 |
| Short time Fourier transform (STFT) analysis | ||||
| Chikkerur, Cartwright, Govindaraju [9] | (19.1) | 11.9 | 7.6 | 10.9 |
| Pyramid-based fitering | ||||
| Fronthaler, Kollreider, Bigun [17] | 12.0 | 8.2 | 5.0 | 7.0 |
| Coherence-enhancing anisotropic diffusion filtering | ||||
| Gottschlich and Schönlieb [21] | 10.0 | 6.4 | 5.0 | 6.0 |
| Straight Gabor filters: | ||||
| x-signature based RF estimation [27] | ||||
| , NN, F, , | 12.9 | 9.6 | 12.8 | 9.5 |
| Curved Gabor filters: | ||||
| , NN, E, , | 10.2 | 6.0 | 4.8 | 6.0 |
| , NN, F, , | 10.5 | 5.9 | 4.8 | 6.5 |
| , NN, E, , | 9.7 | 6.3 | 5.1 | 6.5 |
| Combining curved Gabor filters and | ||||
| coherence-enhancing anisotropic diffusion filtering [21]: | ||||
| Max rule | 9.0 | 5.0 | 4.2 | 5.4 |
| Sum rule | 9.3 | 4.8 | 3.6 | 5.2 |
| Template cross matching | 8.9 | 4.3 | 3.4 | 4.9 |
| Matcher: VeriFinger 5.0 Grayscale | ||||
| Original images | 8.8 | 6.8 | 5.3 | 2.0 |
| Curved Gabor filters: | ||||
| , NN, E, , | 6.4 | 3.5 | 1.7 | 1.3 |
| , NN, F, , | 6.9 | 3.7 | 2.0 | 1.4 |
| , NN, E, , | 6.8 | 3.8 | 1.8 | 1.7 |
Curved Gabor filters were applied for enhancing the images of FVC2004 [41]. Several choices for , , the size of the curved region and interpolation methods were tested. EERs for some combinations of filter parameters are reported in Table 1. Other choices for the size of the curved region and the standard deviations of the Gaussian resulted in similar EERs. Relating to the interpolation method, only results for nearest neighbor are listed, because replacing it by bilinear or bicubic interpolation did not lead to a noticeable improvement in our tests.
In order to compare the enhancement performance of curved Gabor filters for low quality images with existing enhancement methods, matcher BOZORTH3 was applied to the enhanced images of FVC2004 which enables the comparison with the traditional GF proposed in [27], short time Fourier transform (STFT) analysis [9] and pyramid-based image filtering [17] (see Table 1).
Furthermore, in order to isolate the influence of the OF estimation and segmentation on the verification performance, we tested the x-signature method [27] for RF estimation and straight Gabor filters in combination with our OF estimation and segmentation. EERs are listed in the second and sixth row of Table 1. In comparison to the results of the cited implementation which applied an OF estimation and segmentation as described in [27], this led to lower EERs on DB1 and DB2, a higher EER on DB3 and a similar performance on DB4. In comparison to the performance on the original images, an improvement was observed on the first database and a deterioration on DB3 and DB4. Visual inspection of the enhanced images on DB3 showed that the increase of the EER was caused largely by incorrect RF estimates of the x-signature method.
Moreover, we combined minutiae templates which were extracted by MINDTCT from images enhanced by curved Gabor filters and from images enhanced by anisotropic diffusion filtering. A detailed representation of this combination can be found in [21] and results are listed in Table 1. To the best of our knowledge, this combination performed with the lowest EERs on the FVC2004 databases which have been achieved so far using MINDTCT and BOZORTH3.
The matcher referred to as VeriFinger 5.0 Grayscale has a built-in enhancement step which can not be turned off, so that the results for the original images in Table 1 are obtained on matching images which were also enhanced (by an undisclosed procedure of the commercial software). Results using this matcher were included in order to show that even in the face of this built-in enhancement, the proposed image smoothing by curved Gabor filters leads to considerable improvements in verification performance.
6 Conclusions
The present work describes a method for ridge frequency estimation using curved regions and image enhancement by curved Gabor filters. For low quality fingerprint images, in comparison to existing enhancement methods improvements of the matching performance were shown.
Besides matching accuracy, speed is an important factor for fingerprint recognition systems. Results given in Section 5 were achieved using a proof of concept implementation written in Java. In a first test of a GPU based implementation on a Nvidia Tesla C2070, computing the RF image using curved regions of size pixels took about 320 ms and applying curved Gabor filters of size pixels took about 280 ms. The RF estimation can be further accelerated, if an estimate is computed only e.g. for every fourth pixel horizontally and vertically instead of a pixel-wise computation. These computing times indicate the practicability of the presented method for on-line verification systems.
In our opinion, the potential for further improvements of the matching performance rests upon a better OF estimation. The combined method delineated in Section 2 produces fewer erroneous estimations than each of the individual methods, but there is still room for improvement. As long as OF estimation errors occur, it is necessary to choose the size of the curved Gabor filters and the standard deviations of the Gaussian envelope with care in order to balance strong image smoothing while avoiding spurious features. Future work includes an exploration of a locally adaptive choice of these parameters, depending on the local image quality, and e.g. the local reliability of the OF estimation. In addition, it will be of interest to apply the curved region based RF estimation and curved Gabor filters to latent fingerprints.
Acknowledgments
The author would like to thank Thomas Hotz, Stephan Huckemann, Preda Mihăilescu and Axel Munk for their valuable comments, and Daphne Böcker for her work on the GPU based implementation.
References
- [1] F. Alonso-Fernandez, J. Fierrez-Aguilar and J. Ortega-Garcia, “An enhanced Gabor filter-based segmentation algorithm for fingerprint recognition systems”, Proc. 4th Int. Symposium on Image and Signal Processing and Analysis (ISPA2), Zagreb, Croatia, pp. 239-244, 2005.
- [2] F. Alonso-Fernandez, J. Fierrez-Aguilar, J. Ortega-Garcia, J. Gonzalez-Rodriguez, H. Fronthaler, K. Kollreider and J. Bigun, “A comparative study of fingerprint image-quality estimation methods”, IEEE Trans. Inf. Forensics Security, vol. 2, no.4, pp. 734-743, Dec. 2007.
- [3] T. Barbu, “Content-based image retrieval using Gabor filtering”, Proc. 20th Int. Workshop Database and Expert Systems Application (DEXA), Linz, Austria, Aug. 31-Sep. 4, pp. 236-240, 2009.
- [4] A. M. Bazen and S. H. Gerez, “Systematic methods for the computation of the directional fields and singular points of fingerprints”, IEEE Trans. Pattern Anal. Mach. Intell., vol. 24, no. 7, pp. 905-919, Jul. 2002.
- [5] H. Caner, H. S. Gecim and A. Z. Alkar, “Efficient embedded neural-network-based license plate recognition system”, IEEE Trans. Veh. Technol., vol. 57, no. 5, pp. 2675-2683, Sep. 2008.
- [6] R. Cappelli, A. Erol, D. Maio and D. Maltoni, “Synthetic fingerprint-image generation”, Proc. 15th Int. Conf. Pattern Recogn. (ICPR), Barcelona, Spain, Sep. 3-7, vol. 3, pp. 471-474, 2000.
- [7] R. Cappelli, D. Maio and D. Maltoni, “Semi-automatic enhancement of very low quality fingerprints”, Proc. 6th Int. Symp. on Image and Signal Processing and Analysis (ISPA), Salzburg, Austria, Sep 16-18, pp. 678-683, 2009.
- [8] Y. Chen, S. Dass and A. K. Jain, “Fingerprint quality indices for predicting authentication performance”, Proc. AVBPA 2005, Rye Brook, USA, pp. 160-170, 2005.
- [9] S. Chikkerur, A. Cartwright and V. Govindaraju, “Fingerprint image enhancement using STFT analysis”, Pattern Recogn., vol. 40, no. 1, pp. 198-211, 2007.
- [10] J. G. Daugman, “Two-dimensional spectral analysis of cortical receptive field profile”, Vision Research, vol. 20, pp. 847-856, 1980.
- [11] J. G. Daugman, “Uncertainty relation for resolution in space, spatial frequency, and orientation optimized by two-dimensional visual cortical filters”, Journal of the Optical Society America A, vol. 2, pp. 1160-1169, 1985.
- [12] J. G. Daugman, “Complete discrete 2-D Gabor transforms by neural networks for image analysis and compression”, IEEE Trans. Acoust., Speech, Signal Process., vol. 36, no. 7, pp. 1169-1179, Jul. 1988.
- [13] J. G. Daugman, “How iris recognition works”, IEEE Trans. Circuits Syst. Video Technol., vol. 14, no. 1, pp. 21–30, Jan. 2004.
- [14] B. Duc, S. Fischer and J. Bigun, “Face authentication with Gabor information on deformable graphs”, IEEE Trans. Image Process., vol. 8, no. 4, pp. 504-516, Apr. 1999.
- [15] D. Dunn and W. E. Higgins, “Optimal Gabor filters for texture Segmentation”, IEEE Trans. Image Process., vol. 4, no. 7, pp. 947-964, Jul. 1995.
- [16] D. J. Field, “Relations between the statistics of natural images and the response properties of cortical cells”, J. Opt. Soc. Am. A, vol. 4, no. 12, pp. 2379-2394, Dec. 1987
- [17] H. Fronthaler, K. Kollreider and J. Bigun, “Local features for enhancement and minutiae extraction in fingerprints”, IEEE Trans. Image Process., vol. 17, no. 3, pp. 354-363, Mar. 2008.
- [18] D. Gabor, “Theory of communication. Part 3: Frequency compression and expansion”, Journal of the Institution of Electrical Engineers, vol. 93, no. 26, pp. 429-441, 1946.
- [19] D. Gabor, “Information theory in electron microscopy”, Laboratory Investigation, vol.14, no. 6, pp. 801-807, 1965.
- [20] M. D. Garris and R. M. McCabe, “NIST special database 27: Fingerprint minutiae from latent and matching tenprint images”, NIST Technical Report 6534, Gaithersburg, USA, 2000.
- [21] C. Gottschlich and C.-B. Schönlieb, “Oriented diffusion filtering for enhancing low-quality fingerprint images”, IET Biometrics, vol. 1, no. 2, pp. 105-113, June 2012.
-
[22]
C. Gottschlich,
“Fingerprint growth prediction, image preprocessing and multi-level judgment aggregation”,
Ph.D. thesis, University of Göttingen, Germany, 2010,
http://resolver.sub.uni-goettingen.de/purl/?webdoc-2763. - [23] C. Gottschlich, “Curved-region-based ridge frequency estimation and curved Gabor filters for fingerprint image enhancement”, IEEE Transactions on Image Processing, vol. 21, no. 4, pp. 2220–2227, April 2012.
- [24] C. Gottschlich, P. Mihăilescu and A. Munk, “Robust orientation field estimation and extrapolation using semilocal line sensors”, IEEE Transactions on Information Forensics and Security, vol. 4, no. 4, pp. 802-811, Dec. 2009.
- [25] M.-H. Ha, X.-D. Tian and Z.-R. Zhang, “Optical Font Recognition based on Gabor filter”, Proc. 4th Int. Conf. Machine Learning and Cybernetics, Guangzhou, China, Aug. 18-21, pp. 4864-4869, 2005.
- [26] L. He, M. Lech, N. Maddage and N. Allen, “Stress and emotion recognition using log-Gabor filter analysis of speech spectrograms”, Proc. 3rd Int. Conf. Affective Computing and Intelligent Interaction (ACII), Amsterdam, Netherlands, Sep. 10-12, pp. 1-6, 2009.
- [27] L. Hong, Y. Wan and A. K. Jain, “Fingerprint image enhancement: algorithms and performance evaluation”, IEEE Trans. Pattern Anal. Mach. Intell., vol. 20, no. 8, pp. 777-789, Aug. 1998.
- [28] A. K. Jain and S. Bhattacharjee, “Text segmentation using Gabor filters for automatic document processing”, Mach. Vis. Appl., vol. 5, pp. 169-184, 1992.
- [29] A. K. Jain, S. Prabhakar and L. Hong, “A multichannel approach to fingerprint classification”, IEEE Trans. Pattern Anal. Mach. Intell., vol. 21, no. 4, pp. 348-359, Apr. 1999.
- [30] A. K. Jain, S. Prabhakar, L. Hong and S. Pankanti, “Filterbank-based fingerprint matching”, IEEE Trans. Image Process., vol. 9, no. 5, pp. 846-859, May 2000.
- [31] A. K. Jain, S. Prabhakar and S. Pankanti, “On the similarity of identical twin fingerprints”, Pattern Recogn., vol. 35, no. 11, pp. 2653-2663, 2002.
- [32] A. K. Jain, N. K. Ratha and S. Lakshmanan, “Object detection using Gabor filters”, Pattern Recogn., vol. 30, no. 2, pp. 295-309, 1997.
- [33] X. Jiang, “A study of fingerprint image filtering”, Proc. Int. Conf. on Image Process., Thessaloniki, Greece, Oct. 7-10, vol. 3, pp. 238-241, 2001.
- [34] T. S. Lee, “Image representation using 2D Gabor wavelets”, IEEE Trans. Pattern Anal. Mach. Intell., vol. 18, no. 10, pp. 959-971, Oct. 1996.
- [35] C. J. Lee and S. D. Wang, “A Gabor filter-based approach to fingerprint recognition”, Proc. IEEE Workshop on Signal Processing Systems (SiPS), pp. 371-378, 1999.
- [36] S. Liao, M. W. K. Law and A. C. S. Chung, “Dominant local binary patterns for texture classification”, IEEE Trans. Image Process., vol. 18, no. 5, pp. 1107-1118, May 2009.
- [37] T. R. Lim and A. T. Guntoro, “Car recognition using Gabor filter feature extraction”, Proc. Asia-Pacific Conf. Circuits and Systems (APCCAS), vol. 2, pp. 451-455, 2002.
- [38] M. Lindenbaum, M. Fischer and A. Bruckstein, “On Gabor’s contribution to image enhancement”, Pattern Recogn., vol. 27, no. 1, pp. 1-8, 1994.
- [39] D. Maio, D. Maltoni, R. Capelli, J. L. Wayman and A. K. Jain, “FVC2000: fingerprint verification competition”, IEEE Trans. Pattern Anal. Mach. Intell., vol. 24, no. 3, pp. 402-412, Mar. 2002.
- [40] D. Maio, D. Maltoni, R. Capelli, J. L. Wayman and A. K. Jain, “FVC2002: second fingerprint verification competition”, Proc. 16th Int. Conf. on Pattern Recogn. (ICPR), vol. 3, pp. 811-814, 2002.
- [41] D. Maio, D. Maltoni, R. Capelli, J. L. Wayman and A. K. Jain, “FVC2004: third fingerprint verification competition”, Proc. Int. Conf. on Biometric Authentication (ICBA), pp. 1-7, Hong Kong, 2004.
- [42] D. Maltoni, D. Maio, A. K. Jain and S. Prabhakar, “Handbook of fingerprint recognition”, Springer, London, 2009.
- [43] T. R. Mengko and J. Tjandra Pramudito, “Implementation of Gabor filter to texture analysis of radiographs in the assessment of osteoporosis”, Proc. Asia-Pacific Conf. Circuits and Systems (APCCAS), vol. 2, pp. 251-254, 2002.
- [44] V. Mildner, S. Goetze, K. D. Kammeyer and A. Mertins, “Optimization of Gabor features for text-independent speaker identification”, Proc. Int. Symp. Circuits and Systems (ISCAS), New Orleans, USA, May 27-30, pp. 3932-3935, 2007.
- [45] J. B. Predd, D. N. Osherson, S. R. Kulkarni and H. V. Poor, “Aggregating probabilistic forecasts from incoherent and abstaining experts”, Decision Analysis, vol. 5, no. 4, pp. 177-189, 2008.
- [46] R. Ramanathan et alii, “Robust feature extraction technique for optical character recognition”, Proc. Int. Conf. Advances in Computing, Control, and Telecommunication Technologies (ACT), Trivandrum, India, pp. 573-575, 2009.
- [47] N. Rose, “Facial expression classification using Gabor and log-Gabor filters”, Proc. 7th Int. Conf. Autom. Face and Gesture Recogn. (FGR 2006), Southampton, U.K., Apr. 2-6, pp. 346 - 350, 2006.
- [48] J. C. Russ, ‘The image processing handbook”, CRC Press Boca Raton, FL, USA, 2000.
- [49] L. L. Shen, A. Kot and W. M. Koo, “Quality measures for fingerprint images”, Proc. 3rd Audio and Video Based Person Authentication (AVBPA2001), pp. 266-271, 2001.
- [50] J. Sinkkonen, H. Tiitinen and R. Näätänen, “Gabor filters: an informative way for analysing event-related brain activity”, Journal of Neuroscience Methods, vol 56, no. 1, pp. 99-104, 1995.
- [51] A. Spira, N. Sochen and R. Kimmel, “Geometric filters, diffusion flows, and kernels in image processing” in: Handbook of geometric computing, Corrochano (Ed.), Springer, Berlin, Germany, 2005.
- [52] E. Tabassi, C. Wilson and C. Watson, “Fingerprint image quality”, NISTIR 7151, Gaithersburg, USA, 2004.
- [53] D. Tao, X. Li, X. Wu and S. J. Maybank, “General tensor discriminant analysis and Gabor features for gait recognition”, IEEE Trans. Pattern Anal. Mach. Intell., vol. 29, no. 10, pp. 1700-1715, Oct. 2007.
- [54] C. I. Watson, M. D. Garris, E. Tabassi, C. L. Wilson, R. M. McCabe, S. Janet and K. Ko, “User’s guide to NIST biometric image software (NBIS)”, National Institute of Standards and Technology, Gaithersburg, USA, 2007.
- [55] D. Wu, M. Zhang, J.-C. Liu and W. Bauman, “On the adaptive detection of blood vessels in retinal images”, IEEE Trans. Biomed. Eng., vol. 53, no. 2, pp. 341-343, Feb. 2006.
- [56] Q. Wu, L. Zhang and G. Shi, “Robust speech feature extraction based on Gabor filtering and tensor factorization”, Proc. Int. Conf. Acoustics, Speech and Signal Process. (ICASSP), Taipei, Republic of China, Apr. 19-24, pp. 4649-4652, 2009.
- [57] S. Yoon, J. Feng, and A. K. Jain, “On latent fingerprint enhancement”, Proc. of SPIE, Biometric Technology for Human Identification VII, 2010.
- [58] R. Yusof, N. R. Rosli and M. Khalid, “Tropical wood species recognition based on Gabor filter”, Proc. 2nd Int. Congr. Image and Signal Process. (CISP), Tianjin, China, Oct. 17-19, pp. 1-5, 2009.
- [59] D. Zhang, W.-K. Kong, J. You and M. Wong, “Online palmprint identification”, IEEE Trans. Pattern Anal. Mach. Intell., vol. 25, no. 9, pp. 1041-1050, Sep. 2003.
- [60] Y. Zhang, N. Sun, Y. Gao and M. Cao, “A new eye location method based on ring Gabor filter”, Proc. Int. Conf. on Automation and Logistics, Qingdao, China, pp. 301-305, 2008.
- [61] J. Zhang and J. Yang, “Finger-vein image enhancement based on combination of gray-level grouping and circular Gabor filter”, Proc. Int. Conf. on Information Engineering and Computer Science (ICIECS), Wuhan, China, Dec 19-20, pp. 1-4, 2009.
- [62] H. Zhong, W.-B. Chen and C. Zhang, “Classifying fruit fly early embryonic developmental stage based on embryo in situ hybridization images”, Proc. Int. Conf. Semantic Computing (ICSC), Berkeley, CA, USA, Sep. 14-16, pp. 145-152, 2009.
- [63] Y. Zhou and Y.-P. Zheng, “Enhancement of muscle fibers in ultrasound images using Gabor filters”, Proc. IEEE Int. Ultrasonics Symp. (IUS), Rome, Italy, Sep 20-23, pp. 2296-2299, 2009.
- [64] Y. Zhu, T. Tan and Y. Wang, “Biometric personal identification based on handwriting”, Proc. 15th Int. Conf. on Pattern Recog. (ICPR), Barcelona, Spain, Sep 3-7, pp. 797-800, 2000.
- [65] E. Zhu, J. Yin, G. Zhang and C. Hu, “A Gabor filter based fingerprint enhancement scheme using average frequency”, Int. Journal of Pattern Recog. and Artif. Intell., vol. 20, no. 3, pp. 417-429, 2006.