Parabolic versus elliptic focusing - Optimization of the focusing design of a cold triple-axis neutron spectrometer by Monte-Carlo simulations
Abstract
We present Monte-Carlo simulations for the focusing design of a novel cold-neutron triple-axis spectrometer to be installed at the end position of the cold guide NL-1 of the research reactor FRM-II in Munich, Germany. Our simulations are of general relevance for the design of triple-axis spectrometers at end positions of neutron guides. Using the McStas program code we performed ray trajectories to compare parabolic and elliptic focusing concepts. In addition the design of the monochromator was optimized concerning crystal size and mosaic spread. The parabolic focusing concept is superior to the elliptic alternative in view of the neutron intensity distribution as a function of energy and divergence. In particular, the elliptical configuration leads to an inhomogeneous divergence distribution.
keywords:
neutron guide , focusing , elliptic , parabolic , supermirror , McStas, triple-axis spectrometer1 Introduction
Neutron focusing techniques have become rather important in triple-axis spectroscopy because there is a high demand for measurements which require an intense, focused neutron beam on small samples. Double focusing at the monochromator side combined with a horizontally focusing analyzer were introduced by Bührer [1] and Pintschovius [2] in the 1980s and became very successful. The double focusing monochromator allowed for inelastic neutron studies of the phonon and magnon excitations with the first available small crystals of high-temperature cuprate superconductors [3] as well as for the routine measurement of the phonon dispersion under pressure up to 10 GPa [4, 5, 6, 7]. Especially the ongoing interest in experiments using high-pressure cells with very small samples required further experimental progress which could be achieved by the use of focussing neutron optics first introduced in front of the sample by Goncharenkov et al. [8]. Using elliptical neutron optics it became possible to study samples as small as 0.1 mm3 by neutron scattering techniques [9, 10, 11], which is of particular importance in the case of novel materials like the new, exciting class of high-temperature superconducting iron-pnictide compounds [12, 13, 14, 15], as it it is frequently difficult to obtain large samples. Focused neutron beams are also of general importance for inelastic neutron scattering experiments since the gain of intensity results in a decrease of measuring time, in an increase of the measurement-statistics, and often also in a better signal to noise ratio.
Due to the ongoing progress in neutron optical developments it is now possible to use supermirror guides with different shape or tapering designs and rather large angles of reflection of the supermirror coatings [16, 17, 18, 19, 20]. Together with the virtual source concept [2, 21] and large focusing monochromator arrays [22, 23, 24, 25, 26] the intensity at the sample position can be enhanced significantly.
Recent simulations [27] indicate a flux gain of the order of five which could be obtained by using an elliptic focussing guide instead of a conventional guide with an -value of two ( is a measure of the reflection angle relative to the angle of reflection of Ni).
Here, we compare elliptic, parabolic and conventional (straight) guide concepts for a cold-neutron triple-axis spectrometer using the free McStas code [28, 29, 30]. Our results show that for an instrument at the end of a cold neutron guide, the parabolic concept is clearly superior to the elliptic concept concerning the intensity-divergence distribution.
2 The optimized focusing concept for a cold-neutron triple-axis spectrometer
Our calculations were made to design the concept of a new cold-neutron triple-axis spectrometer which will be installed at the end of a curved neutron guide (NL1) at the research reactor FRM-II in Garching. Therefore we have used the specific dimensions and coatings as well as the intensity distribution of this neutron guide, but our main results are of broad relevance for any cold-neutron triple-axis spectrometer placed at a neutron-guide end-position. A gap of 400 mm is required for the monochromator of the upstream instrument. The width and the height of NL-1 (coating = 2) amount to 60 mm and 120 mm, respectively. In Ref. [31] a fully elliptic guide concept has been presented and a distinctly larger entrance width (70 mm) of the guide after the position of the upstream instrument has been proposed in order to overcome the neutron loss caused by the gap where the monochromator is hosted.
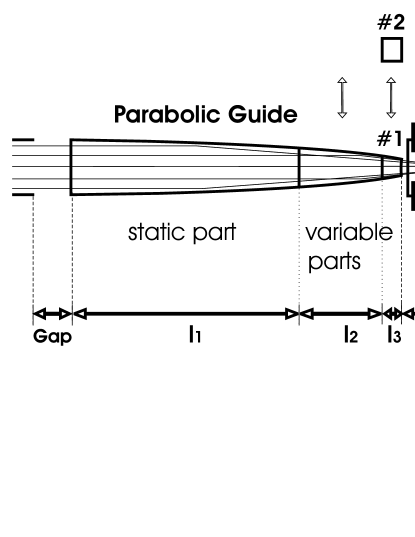
Fig. 1 shows the overall design of the calculated parabolic focussing concept of the triple-axis spectrometer. The parabolic guide has a total length of 6.7 m and is divided into three sections , and . The first section has a length of 5.15 m and is installed permanently. The other two sections and with 1.4 m and 0.15 m length can be moved transversely and replaced by other (straight) guide elements of identical length. The largest section also hosts the polarizing cavities. Its design will be subject of a forthcoming publication [32]. Several focal distances have been studied in great detail ranging from 0.1 m to 0.6 m. Finally, a focal length = 0.3 m has been chosen as an optimal value for highest resolution and intensity. After the parabolic guide a velocity selector will be installed in order to suppress the higher harmonics and to reduce the background of the instrument. Additionally, several diaphragms and flight tubes shall be installed between the parabolic guide and the monochromator drum for similar purposes (e.g. background reduction). Another diaphragm at the focal point may also be used as a virtual source if even higher energy resolution is desired. In the monochromator drum a double focusing monochromator is installed at a distance away from the focal point; compare Fig. 1. The size of the highly oriented pyrolythic graphite (HOPG) crystals has been chosen as in Ref. [31], i.e. with 20 mm 20 mm size, and the mosaic spread is assumed to be 0.5∘. All configurations have been compared based on these identical conditions. Finally, we will also discuss a different monochromator design which is optimized for the short distances and = 1.2 m with being the distance between monochromator and sample; compare Fig. 1. Both, the intensity at the sample position and the peak profile as a function of horizontal divergence and wavelength could be altered and, hence, designed to our needs by variation of the distance = . At the sample position a neutron counter of 20 mm 20 mm size has been used in order to measure the neutron flux at the sample position.
3 Comparison of different focusing concepts
Basically, there are six different focusing configurations which will be discussed in this work:
parab. #1
parabolic guide ( to parabolic)
parab. #2
parabolic guide ( is straight guide)
parab. #3
parabolic guide (, are straight)
elliptic #1
elliptic guide (all noses; = 0.3 m)
elliptic #2
elliptic guide (no noses; = 1.2 m)
straight
standard straight guide
The first configuration, parab. #1, is a fully parabolic guide with
= 0.3 m. In the second parabolic configuration, parab. #2, the
last nose with 0.15 m length is replaced by a standard straight
guide. In parab. #3 also the much longer second nose is replaced by a straight guide changing the properties of this concept distinctly.
For the sake of simplicity, the third parabolic concept will be discussed later in section 4.
All parabolic configurations start with 60 mm width of the
entrance window after the gap for the upstream instrument.

In contrast, for the two elliptic configurations an increased entrance width of 70 mm has been applied since this widening of the guide was recommended in Ref. [31]. Regarding the two elliptic setups, all elliptic noses were used in the first elliptic configuration, elliptic #1, with = 0.3 m, and all noses were removed in the second elliptic configuration, elliptic #2, yielding = 1.2 m. Finally, the configuration straight is a standard straight guide with length . The distance between gap and focal point is identical for all concepts compared in this work. All guides have supermirror-coatings with = 2 and 4 for the top/bottom and the sides, respectively (see Tab. 1). However, for the final parabolic configuration an additional intensity gain of about 10% could be achieved by an optimized distribution of the -value of the supermirror coating along the parabolic guide with smaller values at the beginning but larger values at the end.
| Parameter | parab. #1/ | elliptic #1/ | straight |
|---|---|---|---|
| parab. #2/ | elliptic #2 | ||
| parab. #3 | |||
| Entrance width | 60 mm | 70 mm | 60 mm |
| Exit width | 12.4 mm / | 27.8 mm / | 60 mm |
| 15.2 mm / | 52.8 mm | ||
| 21.6 mm | |||
| Entrance height | 120 mm | 120 mm | 120 mm |
| Exit height | 120 mm | 120 mm | 120 mm |
| focusing guide length | 6.70 m / | 6.70 m / | 0 m |
| (length of parabolic | 6.55 m / | 5.80 m | |
| or elliptic guides) | 5.15 m | ||
| straight guide length | 0 m / | 0 m / | 6.70 m |
| (of guides following | 0.15 m / | 0 m | |
| the focusing guides) | 1.55 m | ||
| Coating (hor.) | av. 3.5 | 4 | 4 |
| Coating (vert.) | 2 | 2 | 2 |
| focal distance † | 0.3 m / | 0.3 m / | |
| 0.45 m / | 1.2 m | ||
| 1.85 m | |||
| focal distance ‡ | 2.5 m | ||
| Distance gap- | 7.0 m | 7.0 m | 7.0 m |
| Mono. shift | -0.3 m | -0.1 m | -0.1 m |
| 1.2 m | 1.2 m | 1.2 m | |
| 1.4 / 1.4 / 1.6 | 1.3 | — |
Thus, the guide starts with an -value of 2.5 which continuously increases up to a value of 3.5 at the end of section , i.e. after 5.15 m length. Only the two short noses and possess coatings with higher -values which continuously increase from 4 at the beginning of to 6 at the end of nose . Hence, on average, the -value of the supermirror coating for the parabolic configurations amounts to 3.50. As mentioned before, compared with a uniform coating with = 4 the average intensity gain is of the order of 10%; it is smaller for lower neutron energies and only slightly higher for very high neutron energies.
Regarding the vertical monochromator curvature the standard monochromator curvature (as expected for focusing from focal point to the sample position by the Rowland condition) has been chosen for all focusing guides. For the horizontal monochromator curvature a different value has been chosen which has been optimized by comparison of intensity and resolution for different horizontal monochromator curvatures in 10% steps from 100% of the nominally optimal curvature (Rowland condition) up to 200% of this nominal value. Finally, a slightly relaxed curvature around 140% of the nominal value turned out to be ideal regarding the intensity. Thus, the standard horizontal curvature has been multiplied by a factor which is given in Tab. 1.
For the elliptic models, the guide parameters from [31, 33] have been taken without any further optimization. (For the other models, all parameters have been always optimized for highest intensity at the sample position!) In the elliptic case the total length of the elliptic guide is defined by the focal distance . For the elliptic #1 concept it is identical to parab. #1 concept and for elliptic #2 it is 0.9 m shorter. For the elliptic cases is the other side focal point at the entrance window; compare also [33].
3.1 Neutron intensity and energy resolution
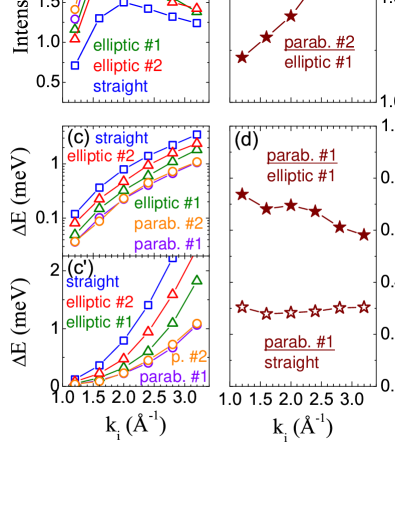
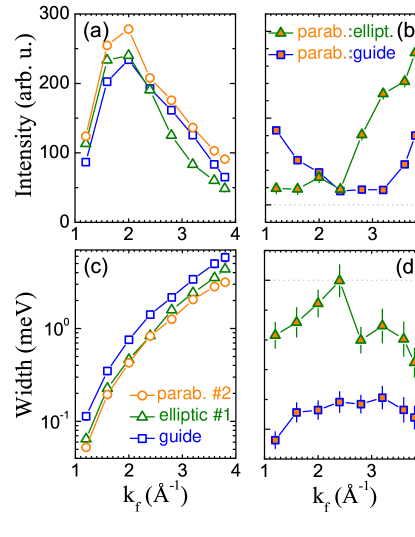
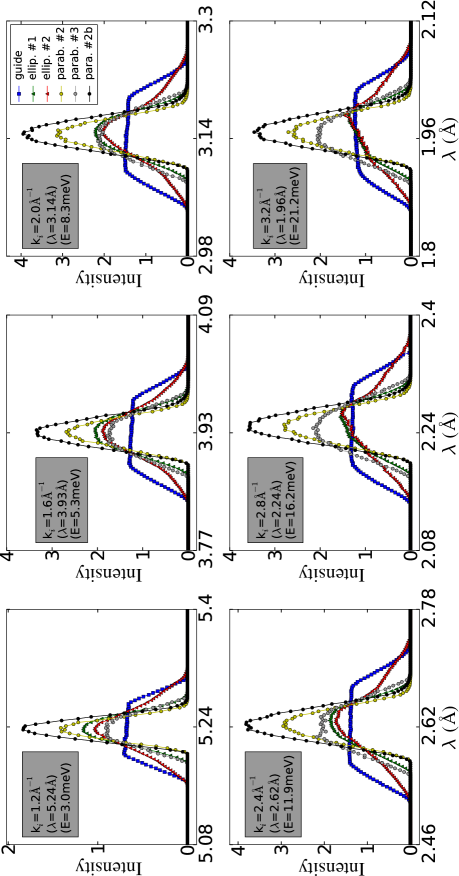
Fig. 2 shows the neutron intensity calculated at the sample position as a function of wavelength for the five different configurations and for different values of the incident neutron wavevector ranging from 1.2 Å-1 to 3.2 Å-1. Additionally, the intensities for elliptic #1 and elliptic #2 have been calculated but without the guide widening to 70 mm proposed in reference [31], i.e. with the standard entrance window of 60 mm width only (green and red lines in Fig. 2). The widened guides are not useful. On the one hand more neutrons are collected by the wide-spread entrance window of such a widened guide, but it becomes more difficult to focus such a beam on a small 2 cm 2 cm spot at the sample position once it is initially widened.

As can be seen from Fig. 2, the energy resolution of the two parabolic configurations is distinctly better than that of the elliptic configurations. Furthermore, the neutron intensity of the guides with parabolic tapering is distinctly larger, especially for larger values of . In Fig. 3 a quantitative evaluation and comparison of parabolic and elliptic concepts is presented showing the intensity and energy resolution ratios of both concepts (closed stars). The parabolic concept performs already better for small incident neutron energies; the energy resolution, i.e. the peak width (FWHM), of the competing high-resolution elliptic setup elliptic #1 is about one third larger (worse) than that of the parabolic setup parab. #1. For higher neutron energies, the difference is even more dramatic since the energy resolution, i.e. the peak width (FWHM), of elliptic #1 has become even two thirds larger (worse) than that of the parabolic setup at a value of equal to 3.2 Å-1 (21 meV). Furthermore, the neutron intensity at this value of has become almost two times larger than that of the elliptic alternative; see Fig. 3.
In Fig. 3 (b,d) a comparison of the parabolic concept with the simple straight guide is shown (open stars). Whereas the parabolic concept is always distinctly better than a straight guide, the elliptic alternative [31] loses most of its advantages at higher neutron energies; compare also Fig. 2.
3.2 The transverse Q-resolution
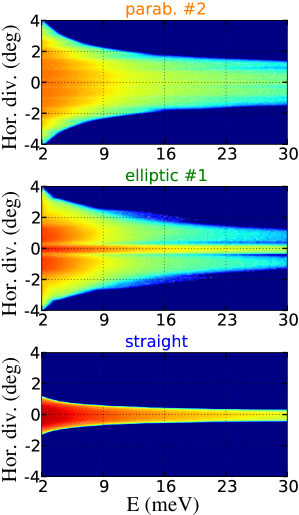
In Fig. 4 the neutron intensity is plotted as a function of horizontal divergence and neutron energy. For the standard straight guide the horizontal divergence of the neutrons is rather small compared to the fully focusing concepts. In the other extreme, the parabolic guide parab. #2 exhibits a broad divergence. From these results, the straight guide with the worst energy resolution has the best transverse Q-resolution and the parabolic guide with the best energy resolution has the worst transverse Q-resolution. elliptic #1 looks like a superposition of straight and parabolic concepts. Thus, the intensity distribution of the elliptic guide is not as homogenous as for the parabolic or for the straight guide. Hence, with elliptic focusing one might expect three major peaks for a transverse scan in a neutron scattering experiment. In order to elucidate this question, we have also calculated the corresponding neutron intensities at the sample position after scattering by the monochromator.
In Fig. 5 the neutron scattering intensity at the sample position is shown as a function of neutron wavelength and horizontal divergence for the different models mentioned above. The calculated intensity maps are directly related to the resolution ellipsoid of the spectrometer. As can be seen in Fig. 5, both elliptic concepts always exhibit a multiple peak structure. Therefore, also a perfect single crystal may exhibit multiple peaks in a transverse scan. In contrast, the multiple peak structure is absent in the parabolic concept for medium and high neutron energies. Only at rather low neutron energies a similar multiple peak structure may appear. In the parabolic arrangement the multiple peak structure, however, can be suppressed when replacing the focussing noses by straight guides (parab. #3), see Fig. 5.
3.3 The qualitative understanding of parabolic versus elliptic configurations
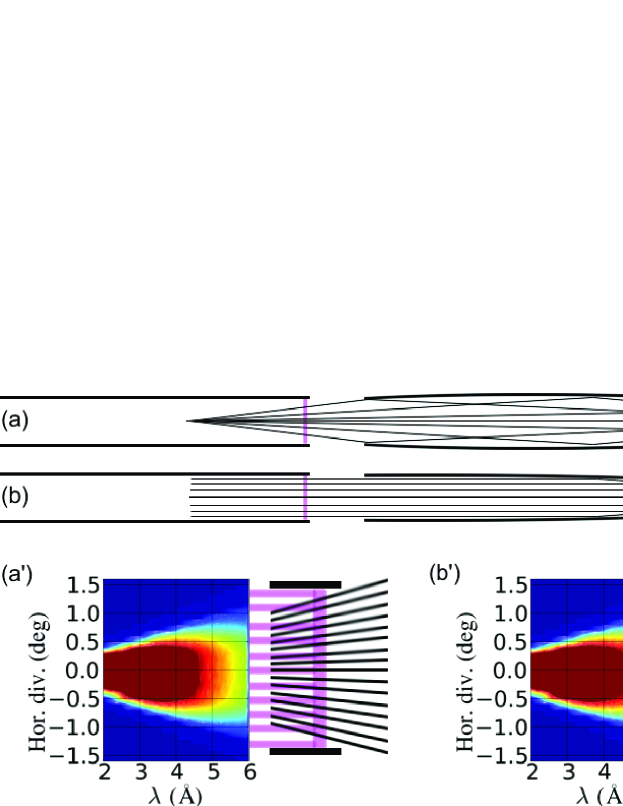
The better performance of the parabolic versus the elliptic focusing concept for an instrument at the end of a neutron guide can be understood by the following reason: the parabolic guide focuses neutrons with small divergence from the whole entrance window into its focal point, whereas the elliptic guide focuses neutrons with higher divergence from outer parts of the entrance window into its focal point. This can be seen in the schematic drawings of Fig. 6 (a,b). At larger distances from the reactor, the neutron intensity provided by the guide is dependent on the neutron divergence. As can be seen in Fig. 6 (a’,b’) the intensity is strongly reduced for neutrons with higher divergence due to the reflection losses in the preceding neutron guide. This reduction of intensity for neutrons with higher divergence becomes especially significant for higher neutron energies. Since the elliptic concept also depends on focusing neutrons out of these high-divergence regimes into its focal point, it has a clear disadvantage with respect to the intensity, especially for higher neutron energies. In contrast, the parabolic concept basically focuses neutrons with low divergence (from the regime with highest flux in the intensity-divergence distribution) into its focal point.
4 Modification for High-Q resolution
With a basic modification of the parabolic concept one may enhance the Q-resolution. As can be seen in Fig. 1, it is possible to remove both parabolic noses of the calculated design ( and ) and to exchange them by straight guides. We will denote this alternative setup by parab. #3. This parabolic concept is almost equivalent to the elliptic #2 concept. Like for the other concepts we have optimized the horizontal monochromator curvature for neutron flux at the sample position.
In Fig. 5 the intensity ellipsoids of the different focusing concepts parab. #1, parab. #2, elliptic #1, elliptic #2, straight and parab. #3 are shown for the most relevant values of . As mentioned before, the elliptic concepts exhibit a multi-peak structure for all incident neutron energies. The parabolic concepts do not show such a multiple peak structure except at low energy. But in contrast to the elliptic concept, the parabolic concept loses this multiple peak structure when all noses are removed, i.e. in the parab. #3-design as can be seen in Fig. 5. Regarding the intensity at the sample position, this concept is comparable to the elliptic concept in the lower or medium energy regime but still clearly outperforms the elliptic alternative in the high energy regime. This configuration will also have a better Q-resolution as discussed in the next section.
5 Simulation of measurements
In order to study the different focusing concepts under measurement conditions, we have also simulated several types of scans: 1st, energy scans for an incoherent scatterer, 2nd, elastic scans across a Bragg peak and, 3rd, scans for measuring an acoustic phonon dispersion will be presented.
The double-focusing analyzer was composed of 11 rows and 21 columns of 10 mm 20 mm large HOPG crystals with 0.4∘ mosaic spread. The sample-analyzer and analyzer-detector distances are rather small, i.e. 0.8 m each, since the spectrometer is intended to have a rather compact design. The width of the detector was set to 2 cm and all scans have been performed in the constant- mode of operation. Furthermore, no collimation was used at any point corresponding to an all-open configuration.
5.1 Energy scan for an incoherent scatterer
First, we have calculated the intensity and energy resolution for energy-scans across the elastic line of a simple cylindrical incoherent scatterer of 20 mm height and 5 mm radius. Each point in reciprocal space was chosen such that was equal to and a double-focusing analyzer geometry has been chosen. The resulting intensities and peak widths (FWHM) are shown in Fig. 7.
As can be seen, the intensity of parab. #2 is always larger than the intensity either of the standard straight guide or of elliptic #1. At the same time the peak width of parab. #2 is smaller than that for the other concepts. Compared to the standard straight guide, the energy resolution is nearly a factor 2 better for parab. #2. It is even around 20% better compared to the high-resolution elliptic concept elliptic #1. Especially at very high energy around 30 meV, the resolution of the parabolic concepts becomes almost 30% better and the intensity 90% larger when compared to the elliptic concept.
Comparing elliptic and straight guides, the elliptic guide always has a clearly better energy resolution. Even the intensity is slightly larger for the elliptic concept at lower neutron energies. However, the intensity performance changes at higher neutron energies where the straight guide exhibits a better performance.
5.2 Elastic scans
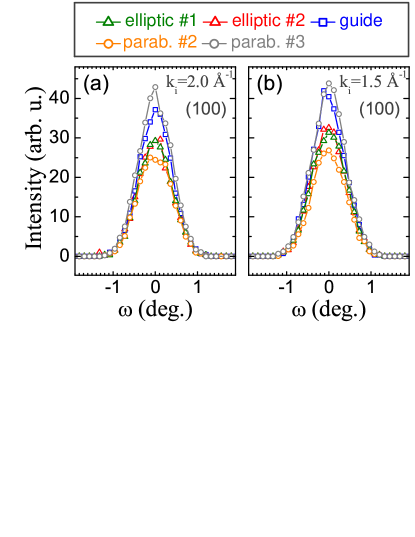
Next, we have simulated -scans across a (100) Bragg reflection of a cubic single-crystal with 5 Å lattice parameter and 50’ mosaic spread using a flat analyzer geometry. But since it is unfavorable to work with a flat monochromator, if the preceeding parabolic or elliptic guide is strongly focusing, we did not change the monochromator curvature. The resulting intensities of such -scans are shown in Fig. 8 for two different incident neutron energies. The highly focusing concept parab. #2 exhibits the lowest performance. But also the highly focusing alternative elliptic #1 is not competitive with a straight guide. Interestingly, again, the straight guide exhibits the best intensity-performance for such elastic scans across a Bragg peak. However by changing towards the parab. #3-configuration even higher intensities than for the straight guide can be obtained; see Fig. 8. Whereas the two very similar fully and almost fully parabolic configurations parab. #1 and parab. #2 are optimized for highest energy resolution, the ’semi-parabolic’ configuration parab. #3 is optimized for Q-resolution.
5.3 Phonon measurements
Finally, we have simulated inelastic scans across transverse and longitudinal acoustic branches of the phonon dispersion of a fcc single crystal using the Phonon-simple-component provided by McStas which is based on the expressions of cross sections provided by Squires [34]. The model sample has a cylindrical shape with 2 cm diameter and 2 cm height and the crystal lattice has 5 Å lattice parameters. A low sound velocity corresponding to a slope of the phonon dispersion which amounts to 8 meV/Å-1 (at 300 K) has been used. The sample mosaic is not included in the Phonon-simple-component, i.e. = 0. For these simulations a double-focusing analyzer geometry has been applied.
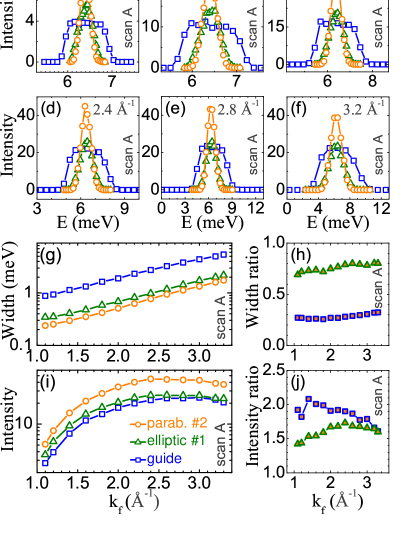
The simulated intensities of constant-Q-scans are shown in Fig. 9. The intensities have been calculated at the detector position. In order to avoid any focusing effects of the resolution ellipsoid with the phonon dispersion (focusing side and defocusing side), we have studied first the phonon dispersion at the zone boundary because its dispersion is flat, i.e. we have simulated constant-Q-scans at (1 1 0) in reciprocal space with varying energies around 6.4 meV; compare also Fig. 10 (a). We will denote this type of scan by ’scan A’ and for the sake of simplicity we will only show the results for the three major concepts with either (nearly) full or no focusing properties. In Fig. 9 (a-f) the resulting energy-scans are shown for different values of the final wave vector . For a more quantitative analysis the peak intensities measured at (Q,) and the corresponding phonon peak widths are shown in Fig. 9 (g,i). Finally, in Fig. 9 (h,j) the ratios of these phonon widths and intensities for the parabolic versus the two other models are shown. Obviously, the parabolic concept has the highest energy resolution together with the highest intensities among the different focusing concepts. The energy resolution is 30% better than for the elliptic concept with at least 50% more intensity. Compared to the standard straight concept the energy resolution is more than 70% better, having even 100% more intensity in the phonon peak.
Comparing the elliptic and straight concepts, the elliptic alternative has larger intensity for medium and lower values of but loses this advantage of intensity versus the straight guide at higher . However, the elliptic concept can still keep its advantage in the energy resolution compared to the straight guide even at higher values of .
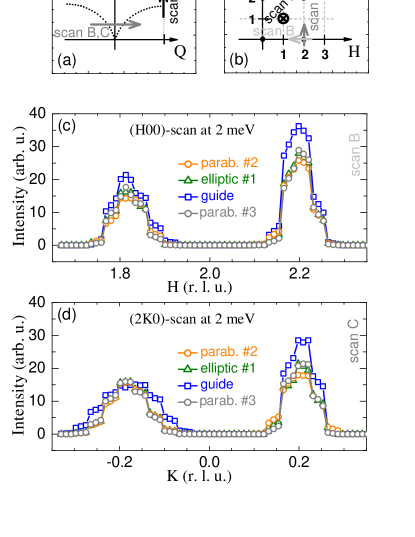
In order to study also the focusing effects of the resolution ellipsoid with the phonon dispersion, we have simulated constant-energy scans at low energies across the zone center for the different basic concepts. The scan directions of two constant-E-scans through (2 0 0) are indicated in Fig. 10 (a,b), one of them having a longitudinal scan-direction (’scan B’) and the other having a transverse scan-direction (’scan C’), thus being sensitive to phonons with longitudinal and transverse polarization, respectively. Both constant-E-scans have been calculated with 2 meV energy transfer and in the constant- operation mode with = 1.5 Å-1. As can be seen in Fig. 10 (c,d) there is no significant difference between elliptic (elliptic #1) and parabolic (parab. #2) concepts but interestingly the standard straight guide is clearly superior to the focusing guides, either elliptic or parabolic. This can be attributed to the higher Q-resolution of the straight guide.
Complementary constant-Q-scans at (2.2 0 0) which are not shown here, corroborate these findings - the intensity of the straight concept is clearly superior to the two focusing concepts. However, the energy resolution (FWHM) of the different concepts remains almost identical and amounts to 0.60(6) meV, 0.59(7) meV,and 0.61(6) meV for the parab. #2, elliptic #1and straight concepts. Thus, in constant-Q scans measured at a steep dispersion, the parab. #2 concept exhibits less intensity than the standard straight guide but not a worsened resolution. Simulations of scans of type ’scan-B’ and ’scan-C’ within the parab. #3 concept show no significant improvement, see Fig. 10 (c,d). However, a larger sample mosaic will be beneficial for the parabolic setup versus the other concepts since larger parts of the divergence-band will interact with the sample (remember that zero sample mosaic was used in these phonon calculations).
6 Optimization of the Monochromator
Because the distance between sample and monochromator is rather small for the intended compact design and for focusing from point to point (with 0.3 m), a reduction of the HOPG monochromator crystal size seems useful in order to approach a truly curved surface since the curvatures become rather large. Furthermore, an increase of the mosaic spread could be beneficial for these purposes and also for transporting a larger part of the divergence-bandwidth provided by the cold guide. However, the gap between the monochromator crystals as well as the required higher precision of the monochromator mechanics limit the reduction of the crystal size. Enhancing the monochromator crystal mosaic might result in a coarser resolution in measurements with a flat monochromator setting without any collimation. Hence, only a small crystal size reduction and a small increase of the crystal mosaic seems to be useful. After simulating several different setups with different crystal sizes (ranging from 10 mm 10 mm to 20 mm 20 mm) and with different crystal mosaic (ranging from 0.4∘ to 1.0∘), we decided to choose a monochromator array with 14 mm 14 mm crystal size, i.e. a total reduction of crystal size (area) by 50%. Even smaller crystal size would yield higher simulated intensities at the sample position but might result in mechanical problems of the monochromator construction. Furthermore, a mosaic spread enhanced by 70% was chosen as the optimum for the intensity at the sample position. We denote this configuration of optimized monochromator in combination with the parab. #2-concept as the ’parab. #2b’-concept. The combination of parab. #3 with this optimized monochromator is denoted as parab. #3b. In Fig. 11 the results of the simulations for the high-E-resolution configuration parab. #2b (solid black circles) are shown and compared with other configurations all having the standard monochromator design according to Ref. [31]. For all calculated neutron energies the gain of total neutron-flux at the sample position is of the order of one third higher than the high flux of the ’conventional’ parab. #2 configuration. Furthermore, the multiple peak structure transverse to Q vanishes since the intensity is smeared out due to the larger mosaic spread (see Fig. 5).
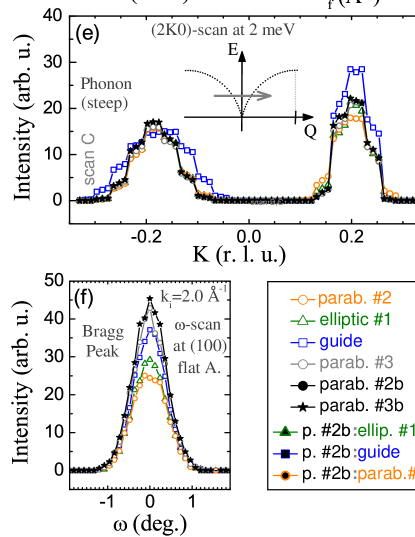
We have also simulated energy scans across the elastic line of an incoherent scatterer under the same conditions as described in the preceding section. The resulting intensities are shown in Fig. 12 (a) and the ratios of the high-E-resolution parab. #2b and the other different high-E-resolution focusing concepts as well as the standard straight guide are shown in Fig. 12 (b). Thus, by choosing an optimized monochromator design (black solid points), a distinct increase of intensity can be expected in inelastic measurements in general. Fig. 12 (c,d) show the high performance of parab. #2b (black solid points) for measuring flat dispersions. However, Fig. 12 (e) shows that the standard straight guide is still superior for measuring steep dispersions.
Furthermore, we were also curious to see whether any performance collapse appears in the parab. #2b configuration in elastic scans since the crystal mosaic has been enhanced. Therefore, -scans have been simulated under the same conditions as described in the preceding section. In spite of using a flat analyzer geometry there is no drop but even a small increase of intensity for parab. #3b (solid black stars) as can be seen in Fig. 12 (f).
Hence, the monochromator can be optimized for the use in double focusing geometry by choosing crystal size and crystal mosaic properly depending on the occurring monochromator curvatures which are larger for a fully focusing guide than for a non-focusing straight guide. Since elastic scans usually do not suffer from a lack of intensity, any problems due to a larger crystal mosaic can be handled by using an appropriate collimation.
Finally, we note that a reduction of the -shift towards zero does not yield any improvement but even a clearly diminished intensity for ’scan C’ in Fig. 12 (e).
7 Conclusion
We have performed Monte-Carlo simulations in order to determine the optimal focusing design for a cold-neutron triple-axis spectrometer which will be installed at the end of a curved neutron guide (NL1 at the FRM-II). The elliptic guide [31] turns out not to be the ideal choice since the elliptic configuration focuses also neutrons with higher divergence into its focal point. In contrast, the parabolic alternative yields much higher intensities by focusing neutrons with small divergence into its focal point.
The highly focusing design of the parabolic concept also results in a distinctly better energy resolution and does not suffer that much from a severe multi-peak structure transverse to Q like the elliptic concept. Hence, intensity as well as energy and Q-resolution are superior in the parabolic concept. This improved performance of parabolic focusing could be also verified in simulations for phonon-scans and of scans across the elastic line of an incoherent scatterer.
However, for steep dispersions and low neutron energies, both focusing concepts either elliptic or parabolic become quite similar having a significant intensity disadvantage compared to a standard straight guide.
The monochromator is the essential element of the whole focusing concept and can be optimized for the required curvatures in the double-focusing operation mode. If all distances are small and the curvatures become large, a smaller crystal size and a slightly enhanced crystal mosaic are beneficial in order to follow the large curvatures and probably also to transport a larger part of the divergence bandwidth provided by the guide.
We may conclude that for an instrument at the end of a neutron guide, the parabolic concept is clearly superior to the elliptic concept. In most cases the parabolic concept is distinctly better than a standard straight guide unless the measured dispersion is steep and high Q-resolution is desired.
8 Acknowledgements
This work was supported by the German Federal Ministry of Education and Research (BMBF) by project 05KN7PK1. We thank A. Ostermann for providing the model of the cold source and the cold guide NL-1 of the FRM-II up to the upstream instrument N-REX+. We thank M. Janoschek for providing the optimized guide parameters of the elliptic guide.
References
- Bührer [1994] W. Bührer, Nucl. Instr. and Meth. in Physics Research A 338 (1994) 44.
- Pintschovius [1994] L. Pintschovius, Nucl. Instr. and Meth. A 339 (1994) 136.
- Pintschovius and Reichardt [1998] L. Pintschovius, W. Reichardt, in Neutron Scattering in Layered Copper-Oxide, A. Furrer (Kluwer, Dordrecht, The Netherlands) (1998) 165.
- Ivanov et al. [1995] A. S. Ivanov, I. N. Goncharenko, V. A. Somenkov, M. Braden, High Pressure Research 14 (1995) 145.
- Klotz et al. [1997] S. Klotz, J. M. Besson, M. Braden, K. Karch, P. Pavone, D. Strauch, W. G. Marshall, Phys. Rev. Lett. 79 (1997) 1313.
- Klotz et al. [1998] S. Klotz, M. Braden, J. M. Besson, Phys. Rev. Lett. 81 (1998) 1239.
- Klotz and Braden [2000] S. Klotz, M. Braden, Phys. Rev. Lett. 85 (2000) 3209.
- Goncharenko et al. [1997] I. Goncharenko, I. Mirebeau, P. Molina, P. Böni, Physica B 234 236 (1997) 1047.
- Mühlbauer et al. [2006] S. Mühlbauer, M. Stadlbauer, P. Böni, C. Schanzer, J. Stahn, U. Filges, Physica B 385 386 (2006) 1247.
- Mühlbauer et al. [2008] S. Mühlbauer, P. Niklowitz, M. Stadlbauer, R. Georgii, P. Link, J. Stahn, P. Böni, Nucl. Instr. and Meth. A 586 (2008) 77.
- Niklowitz et al. [2009] P. Niklowitz, C. Pfleiderer, S. Mühlbauer, P. Böni, T. Keller, P. Link, A. de Visser, J. Wilson, M. Votja, J. Mydosh, Physica B 404 (2009) 2955.
- Kamihara et al. [2008] Y. Kamihara, T. Watanabe, M. Hirano, H. Hosono, J. Am. Chem. Soc. 130 (2008) 3296.
- Takahashi et al. [2008] H. Takahashi, K. Igawa, K. Arii, Y. Kamihara, M. Hirano, H. Hosono, Nature 453 (2008) 376.
- Matsuishi et al. [2008] S. Matsuishi, Y. Inoue, T. Nomura, H. Yanagi, M. Hirano, H. Hosono, J. Am. Chem. Soc. 130 (2008) 14428.
- Rotter et al. [2008] M. Rotter, M. Tegel, D. Johrendt, Phys. Rev. Lett. 101 (2008) 107006.
- Mezei [1976] F. Mezei, Commun. Phys. 1 (1976) 81.
- Mezei and Dagleish [1977] F. Mezei, P. Dagleish, Commun. Phys. 2 (1977) 41.
- Böni [1997] P. Böni, Physica B 234 (1997) 1038.
- Wagner et al. [1998] W. Wagner, G. S. Bauer, J. Duppich, S. Janssen, E. Lehmann, M. Lüthy, H. Spitzer, J. Neutron Res. 6 (1998) 249.
- Ibberson [2009] R. Ibberson, Nucl. Instr. and Meth. A 600 (2009) 47.
- Kulda et al. [2002] J. Kulda, J. Šaroun, P. Courtois, M. Enderle, M. Thomas, P. Flores, Appl. Phys. A 74 (2002) S246.
- Riste [1970] T. Riste, Nucl. Instr. and Meth. 86 (1970) 1.
- Nunes and Shirane [1971] A. Nunes, G. Shirane, Nucl. Instr. and Meth. 95 (1971) 445.
- Scherm et al. [1977] R. Scherm, G. Dolling, R. Ritter, E. Schedler, W. Teuchert, W. V., Nucl. Instr. and Meth. 143 (1977) 77.
- Link et al. [2000] P. Link, G. Eckold, N. J., Physica B 276 278 (2000) 122.
- Böni [2008] P. Böni, Nucl. Instr. and Meth. A 586 (2008) 1.
- Schanzer et al. [2004] C. Schanzer, P. Böni, U. Filges, T. Hils, Nucl. Instr. and Meth. A 259 (2004) 63.
- Lefmann and Nielsen [1999] K. Lefmann, K. Nielsen, Neutron News 10/3 (1999) 20.
- Willendrup et al. [2004] P. Willendrup, E. Farhi, K. Lefmann, Physica B 350 (2004) 735.
- Lefmann and Nielsen [2000] K. Lefmann, K. Nielsen, Physica B 283 (2000) 426.
- Janoschek et al. [2010] M. Janoschek, P. Böni, M. Braden, Nucl. Instr. and Meth. A 613 (2010) 119.
- Komarek and [????] A. C. Komarek, , in preparation .
- Janoschek [????] M. Janoschek, private communication .
- Squires [1978] G. L. Squires, Introduction to the theory of thermal neutron scattering (1978) Dover.