M \addunit\calorycal
Theory for RNA folding, stretching, and melting including loops and salt
Abstract
Secondary structure formation of nucleic acids strongly depends on salt concentration and temperature. We develop a theory for RNA folding that correctly accounts for sequence effects, the entropic contributions associated with loop formation, and salt effects. Using an iterative expression for the partition function that neglects pseudoknots, we calculate folding free energies and minimum free energy configurations based on the experimentally derived base pairing free energies. The configurational entropy of loop formation is modeled by the asymptotic expression , where is the length of the loop and the loop exponent, which is an adjustable constant. Salt effects enter in two ways: first, we derive salt induced modifications of the free energy parameters for describing base pairing and, second, we include the electrostatic free energy for loop formation. Both effects are modeled on the Debye-Hückel level including counterion condensation. We validate our theory for two different RNA sequences: For tRNA-phe, the resultant heat capacity curves for thermal denaturation at various salt concentrations accurately reproduce experimental results. For the P5ab RNA hairpin, we derive the global phase diagram in the three-dimensional space spanned by temperature, stretching force, and salt concentration and obtain good agreement with the experimentally determined critical unfolding force. We show that for a proper description of RNA melting and stretching, both salt and loop entropy effects are needed.
I Introduction
Ribonucleic acid (RNA) is one of the key players in molecular biology and has in the past attracted theoretical and experimental physicists because of its intriguing structural and functional properties. RNA has multiple functions: beyond being an information carrier it has regulatory and catalytic abilities Gesteland et al. (2005). Comprehending how RNA folds and what influences the folding process are key questions Tinoco et al. (1971). Thus, the reliable prediction of RNA structure and stability under various conditions is crucial for our understanding of the functioning of RNA and nucleic acid constructs in general Liedl et al. (2007); Dietz et al. (2009).
The influence of temperature and solution conditions on RNA folding stays in the interest of experimental groups. Traditionally the thermal melting of RNA was monitored via differential scanning calometry or UV spectroscopy for the bulk ensemble Xia et al. (1998); Mathews et al. (1999); Privalov and Filimonov (1978); Vives et al. (2002). More recently, single molecule pulling and unzipping experiments have been used to unveil the influence of different solution conditions and even determine energy parameters Liphardt et al. (2001); Vieregg et al. (2007); Huguet et al. (2010).
On the theoretical side, RNA denaturation has been modeled on various levels of coarse graining. Focusing on the secondary structure, namely the base pairs (bp), and omitting tertiary interactions, equilibrium folding and unfolding has been modeled very successfully McCaskill (1990); Zuker and Stiegler (1981); Markham and Zuker (2005); Gerland et al. (2001); Bundschuh and Gerland (2005); Montanari and Mézard (2001); Müller (2003); Dimitrov and Zuker (2004); Imparato et al. (2009); Einert et al. (2008, 2010). In the presence of a logarithmic contribution to the loop entropy, it has been shown that homopolymeric RNA, where sequence effects are neglected, features a genuine phase transition, which can be induced by force or temperature Müller et al. (2002); Müller (2003); Einert et al. (2008, 2010). However, the specific sequence influences the stretching response of a molecule, which has been shown by Gerland et al. (2001, 2003), yet without considering the logarithmic loop entropy. More detailed insights can be obtained by simulations, which are numerically quite costly, though, when compared to models focusing only on secondary structure. Coarse grained, Go-like simulations of short RNA hairpins allowed to analyze the dynamics of the folding and unfolding process Hyeon and Thirumalai (2005, 2006). Ion specific effects have been studied by performing molecular dynamics Auffinger and Westhof (2000) or coarse grained simulations Tan and Chen (2006, 2007, 2008); Jost and Everaers (2009). Much less is known about the salt dependence of denaturation transitions of RNA.
While for DNA numerous corrections of the base pairing free energies due to varying salt concentration exist, see Owczarzy et al. (2004) and references therein, analogous results for the salt dependence of RNA energy parameters are sparse Tan and Chen (2006). However, molecular biology and biotechnological applications depend on the reliable prediction of RNA stability for different solution conditions.
In this paper we extend these previous works and develop a theory that allows to include all these effects – sequence, salt dependence, logarithmic loop entropy, stretching force – and demonstrate that all are necessary to obtain a complete picture of the thermodynamics of the secondary structure of RNA. Neglecting tertiary interactions, we use a recursion relation, which allows to correctly account for logarithmic and thus non-linear free energy contributions due to the configurational entropy of loops Einert et al. (2008). To include the influence of monovalent salt on RNA stability, we model the RNA backbone as a charged polymer interacting via a Debye-Hückel potential and give heuristic formulas for the modification of the loop free energy and the base pairing and stacking free energy parameters. Debye-Hückel is a linear theory, yet we include non-linear effects caused by counterion condensation using Manning’s concept Manning (1969). The backbone elasticity of single stranded RNA (ssRNA) is described by the freely jointed chain (FJC) model. Our description allows for a complete description of the behavior of RNA in the three-dimensional phase space spanned by temperature, salt concentration, and external stretching force. We find that for an improved description of RNA melting curves one needs to include both salt effects and loop entropy. Only the combined usage of these two contributions enables to predict the shift of the melting temperature (due to salt) and the cooperativity (due to logarithmic loop entropy), which is illustrated in the case of tRNA-phe. As an independent check we consider the force induced unfolding of the P5ab RNA hairpin and observe good agreement with experimental values with no fitting parameters. The influence of salt is illustrated by melting curves and force extension curves for various salt concentrations. For the P5ab hairpin the phase diagram is determined and slices through the three-dimensional parameter space are shown.
II Free energy parameterization
RNA folding can be separated into three steps, which occur subsequently and do not influence each other to a fairly good approximation Tinoco and Bustamante (1999). The primary structure of RNA is the mere sequence of its four bases cytosine (C), guanine (G), adenine (A), and uracil (U). Due to base pairing, i. e. either the specific interaction of C with G or the interaction of A with U, the secondary structure is formed. Therefore, on an abstract level, the secondary structure is given by the list of all base pairs present in the molecule. Only after the secondary structure has formed, tertiary contacts arise. Pseudoknots Richards (1969); van Batenburg et al. (2000), helix stacking, and base triples Higgs (2000) as well as the overall three-dimensional arrangement of the molecule are considered as parts of the tertiary structure. The main assumption of hierarchical folding is, that tertiary structure formation operates only on already existing secondary structure elements Tinoco and Bustamante (1999). Although cases are known where this approximation breaks down, it generally constitutes a valid starting point Cho et al. (2009). In this paper, where the main point is the influence of the loop entropy and the salt concentration on the secondary structure, we therefore neglect tertiary interactions altogether.
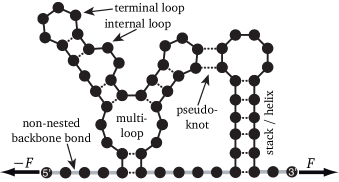
Given a set of base pairs, the secondary structure consists of helices and loops as the basic structural units, cf. fig. 1. Since pseudoknots are neglected, every nucleotide can be attributed unambiguously to exactly one subunit. The free energy of a certain secondary structure is then given by the sum of the free energy contributions of the individual structural subunits, as we will detail now.
II.1 Free energy of a loop
We model the free energy of a loop consisting of backbone bonds, see fig. 1, with
| (1) |
The first term is the loop entropy difference between an unconstrained polymer and a ring-like polymer, which is characterized by the loop exponent Duplantier (1986); Kafri et al. (2000); Einert et al. (2008); Müller et al. (2002)
| (2) |
with the Boltzmann constant and the absolute temperature. The loop exponent is for an ideal polymer and for an isolated self avoiding loop. Helices emerging from the loop limit the configurational space available to the loop and hence increase . One obtains for terminal, for internal loops and for a loop with four emerging helices Einert et al. (2008). Since the differences between these exponent values are quite small, we assume a constant loop exponent in this paper and only compare with the case of vanishing loop entropy characterized by .
The second term in eq. (1) describes the free energy difference between a charged ring of length and a straight rod of the same length due to electrostatic interactions, with the length of one ssRNA backbone bond Tan and Chen (2008). The electrostatics are modeled on the Debye-Hückel level Kunze and Netz (2002)
| (3) |
with the Bjerrum length, which in water has a value of roughly , the Debye screening length, the vacuum dielectric constant, the relative dielectric constant of water Murrell (1994), the ionic strength, and the concentration and the valency of the anions/cations, the Avogadro constant, the elementary charge, Euler’s constant, the incomplete gamma function, and the generalized hypergeometric functions Abramowitz and Stegun (2002). To account for modifications of the line charge density due to non-linear electrostatic effects, we employ Manning’s counterion condensation theory Manning (1969), predicting
| (4) |
Eq. (II.1) amounts to a ground state approximation of the electrostatic contribution to the free energy of a loop. This is rationalized by the fact that the electrostatic interaction is screened and decays exponentially over the Debye length, which is roughly for salt solution. However, typical distances between bases in a loop are of the order of the helix diameter or larger. Therefore, we expect electrostatic interactions to be basically independent of the global configuration of a loop, which justifies both the ground state approximation and our additivity approximation, where ion effects and conformational contributions decouple, see eq. (1). In the supporting material, see eq. S4, we give an interpolation formula for eq. (II.1) involving no hypergeometrical functions.
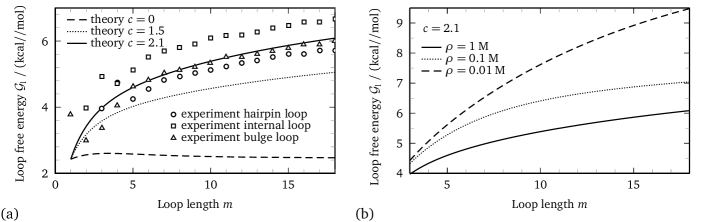
The last term in eq. (1) is the loop initiation free energy . As we are employing a logarithmic loop entropy, eq. (2), we cannot use the standard value for , which was extracted from experimental data for a different loop parameterization Xia et al. (1998); Mathews et al. (1999). Therefore, a modified value is obtained by fitting , given by eq. (1), to experimental data using in and the salt concentration in , see fig. 2a. In this figure we show experimentally determined free energies for terminal, internal and bulge loops as a function of the loop size, which exhibit a dependence on the type of the loop. As an approximation, we do not distinguish between those loop types in the theory and consequently fit a single parameter to the data, which turns out to be for , see supporting material section C. In fig. 2a the fitted for the loop exponent is depicted by the solid line; the other lines illustrate the effect of different loop exponents on the loop free energy according to eq. (1) using the same value for . fig. 2b illustrates the effect of salt on the loop free energy for a given value of .
II.2 Free energy of a helix
The free energy of a helix
| (5) |
depends on the sequence , which consists of the four nucleotides . The stacking free energy is based on experimentally determined parameters incorporating the base pairing free energy as well as the stacking free energy between neighboring base pairs. In the standard notation, is the contribution of the two neighboring, stacked base pairs and to . The explicit values for the enthalpic and entropic parts are given in the supporting material. We use the expanded nearest neighbor model Mathews et al. (1999); Xia et al. (1998) to calculate the base pairing and stacking contributions of a helical section ranging from base pair through and obtain
| (6) |
The initiation and termination free energies in eq. (5) take into account weaker pairing energies of AU or GU base pairs at the ends of the helix. We use the standard literature values for and Mathews et al. (1999); Xia et al. (1998) and summarize the explicit values in the supporting material. Increasing the salt concentration increases the stability of a helix: First, counterions condense on the negatively charged backbone and reduce the electrostatic repulsion and, second, the diffuse counterion cloud surrounding the charged molecule screens the interaction. We model the two strands of a helix as two parallel rods at distance interacting via a Debye-Hückel potential characterized by the screening length . The electrostatic interaction energy per nucleotide with the other strand is given by
| (7) |
is the helical rise per base pair of double-stranded RNA (dsRNA) and is the zeroth order modified Bessel function of the second kind. Again, we employ Manning’s theory Manning (1969) to calculate the line charge density . The reference state for the salt correction of the pairing free energy is at temperature with monovalent salt concentration , as the experimental pairing free energies were determined at this concentration. The free energy shift for a helix consisting of base pairs due to electrostatic interactions is then
| (8) |
The use of Debye-Hückel theory to incorporate salt effects enables to include the overall dependence on temperature and salt concentration but involves several approximations. First, we are using Manning’s counterion condensation theory to obtain the actual line charge density of ssRNA and dsRNA Manning (1969). However, Manning condensation is known to underestimate the line charge at increasing salt concentration and therefore favors the bound state Netz and Orland (2003). Second, when calculating the electrostatic energy of a loop we effectively use a ground state approximation and neglect conformational fluctuation effects. Third, when two ssRNA strands come together to form a helix, the line charge density increases since the distance between two bases decreases. The salt dependence of the work to decrease the axial distance between two bases from to is neglected. This approximation favors the unbound state. Therefore, it is very important to validate the model we employ, which we do by detailed comparison with experimental data. From the favorable comparison with experiments we tentatively conclude that the various errors partially cancel and the resulting expression for the salt influence is quite accurate. We point out that after determining in eq. (1), no further fitting is done and only standard literature values are used.
Our theory is able to consider variations of the salt concentration as well as of the temperature, which makes it suitable to study RNA melting at various salt concentrations in a consistent way. However, since our approach is solely based on mean field theory, it will become unreliable in the case of multivalent ions, where correlations become important. Also, ion specific effects, which are important for divalent ions such as Mg2+ Draper et al. (2005), are not considered in our approach.
II.3 Response of the molecule to an external stretching force
In atomic force microscope or optical tweezers experiments, it is possible to apply a stretching force to the two terminal bases of the molecule. We model the stretching response of the non-nested backbone bonds, see fig. 1, with the freely jointed chain (FJC) model Montanari and Mézard (2001); Gerland et al. (2001, 2003). A non-nested bond is defined as a backbone bond, which is neither part of a helix nor part of a loop. It is outside all secondary structure elements and therefore contributes to the end-to-end extension observed in force spectroscopy experiments. The force dependent contribution to the free energy per non-nested monomer is given by
| (9) |
where is the inverse thermal energy and is the Kuhn length of ssRNA Montanari and Mézard (2001) (we used the Kuhn length of ssDNA as the corresponding ssRNA data is less certain). The stretching response of one non-nested monomer to an external force is then given by
| (10) |
is the Langevin function. Electrostatic effects on the stretching response are considered to be small and hence are neglected Marko and Siggia (1995); Netz (2001).
III Calculation of the partition function
So far we showed how to calculate the free energy of one given secondary structure. The next step is to enumerate all possible secondary structures and to obtain the partition function, which allows to study the thermodynamics of the system. As we neglect tertiary contacts – and in particular pseudoknots – for any two base pairs and with , , and we have either or . This allows to derive a recursion relation for the partition function of the secondary structure. In our notation, the canonical partition function of a sub-strand from base at the 5’-end through at the 3’-end depends on the number of non-nested backbone bonds Einert et al. (2008); Bundschuh and Gerland (2005); Müller et al. (2002), see fig. 1. The recursion relations for can be written as
| (11a) | |||
| and | |||
| (11b) | |||
Eq. (11a) describes elongation of an RNA structure by either adding an unpaired base (first term) or by adding an arbitrary sub-strand that is terminated by a helix. Eq. (11b) constructs by closing structures with non-nested bonds, summed up in , by a helix of length . is the minimum number of bases in a terminal loop. denotes the number of configurations of a free chain with links and drops out by introducing the rescaled partition function and will not be considered further since its effects on the partition function are negligible. is the free energy of a helix beginning with base pair and ending with base pair according to eq. (5). is the free energy of a loop consisting of segments as given by eq. (1). and contain all interactions discussed in the previous section. Eq. (11) allows to compute the partition function in polynomial time (). Further, our formulation allows to treat non-linear functions for and ; for instance, is strongly non-linear by virtue of eqs. (2) and (II.1).
The unrestricted partition function of the entire RNA, where the number of non-nested backbone bonds is allowed to fluctuate, is given by
| (12) |
and contains the influence of force via defined in eq. (9). The partition function contains all secondary structure interactions, but neglects pseudoknots and other tertiary interactions. As has been argued before, this approximation is known to work very well Tinoco and Bustamante (1999) and yields reliable predictions for the stability of nucleic acids Gruber et al. (2008).
Using the same ideas, we determine the minimum free energy (mfe) and the mfe structure. The mfe structure, is defined as the secondary structure, which gives the largest contribution to the partition function. Since it cannot be derived from the partition function itself, it has to be determined from a slightly modified set of recursion relations, see supporting material.
IV Salt dependence of melting curves
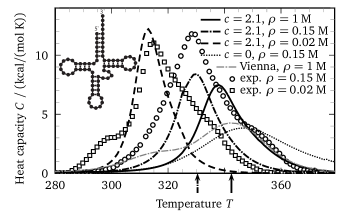
In this section we calculate melting curves for different salt concentrations by applying eqs. (1) and (5), which include our salt dependent free energy parameterization. In fig. 3 we compare experimental results Privalov and Filimonov (1978); Vives et al. (2002) with our predictions for the heat capacity of yeast tRNA-phe; the sequence is given in the supporting material section D. The heat capacity is readily obtained by
| (13) |
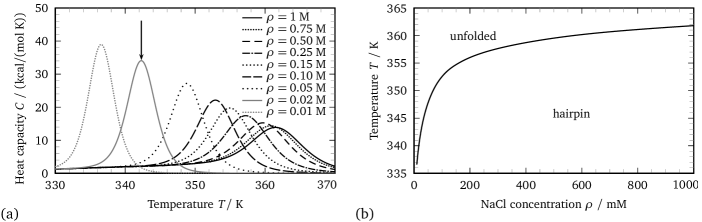
where is the unrestricted partition function of the RNA at zero force, eq. (12). In all our calculations, we use the same literature parameter set for the stacking and pairing free energy . No additional fit parameter enters except the loop initialization free energy , which is determined in fig. 2a from a separate experimental data set. The salt dependence of the experimentally observed melting temperatures is reproduced well, compare fig. 3. The arrows indicate additional experimental results Vives et al. (2002) for the melting temperature for and , which again coincide with our prediction. We also plot a calculated melting curve for loop exponent and NaCl concentration , which exhibits a far less cooperative transition than observed in the corresponding curve with . Finally, we compare our prediction for and with the prediction of RNAheat in the Vienna Package Hofacker et al. (1994) for , which uses a linearized multi-loop entropy amounting to in our framework. The predicted melting temperatures are almost identical. However, the widths of the peaks in both melting curves differ and our melting profile for is more peaked. Taking all these observations together leads to the conclusion that only a combined use of logarithmic loop entropy (characterized by a non-zero loop exponent) and salt dependent free energy corrections leads to a correct prediction of melting curves. The additional features in the experimental data, e. g. the shoulder at lower temperatures and the increased width of the experimental curves might be attributed to tertiary structure rearrangements, which are not captured by our approach, or to melting occurring in multiple stages.
V Salt dependence of stretching curves
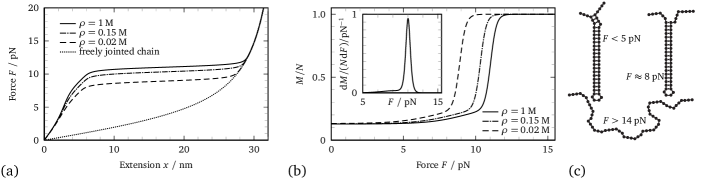
Apart from temperature, force is an important variable to study denaturation of RNA molecules Li et al. (2008); Liphardt et al. (2001); Manosas et al. (2006); Seol et al. (2007); Tinoco (2004); Woodside et al. (2006a, b); Hyeon and Thirumalai (2005); Gerland et al. (2001); Kumar and Mishra (2008); Müller et al. (2002); Montanari and Mézard (2001). In fig. 4 we show the salt dependence of stretching curves for yeast tRNA-phe. The stretching curves have been obtained by describing the force response of the non-nested backbone bonds, see fig. 1, with the freely jointed chain (FJC) model, see eq. (10),
| (14) |
where we used the expectation value of the number of non-nested backbone segments
| (15) |
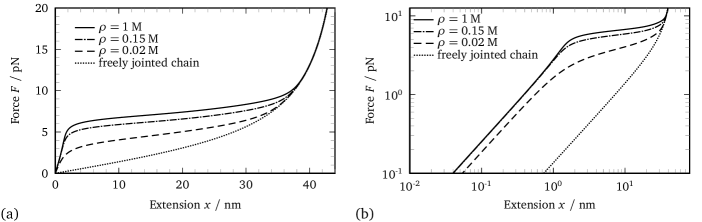
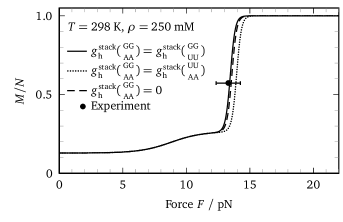
As for the melting curves, one observes that increasing salt concentration stabilizes the structure, leading to higher unfolding forces. All curves converge in the large force limit to a freely jointed chain of the length of the whole RNA molecule , where is the number of bases in the chain. The deviation for small forces from this theoretical prediction is due to the secondary structure of RNA, which is present at small forces and which becomes disrupted at forces . In fig. 5a we show the force extension curve of the P5ab hairpin Liphardt et al. (2001); the sequence is given in the supporting material section D. Apart from the salt dependence of the force extension curve, one observes that the unzipping of the helix occurs in two stages. This is seen best by considering the fraction of non-nested segments and its derivative, fig. 5b. The first stage is a smooth unzipping of the first three base pairs up to the bulge loop visible as a shoulder at in the derivative. The second stage is a sharp transition, where the rest of the hairpin unzips. In fig. 5c we show mfe predictions for the secondary structure at different forces for NaCl. For , we predict correctly the experimentally observed native state with all base pairs intact Liphardt et al. (2001). For forces , an intermediate state appears, where the first three base pairs are unzipped up to the bulge loop. Denaturation is observed for . The native structure of the P5ab hairpin contains the stacked pairs – bp(17,42) and bp(18,41) Liphardt et al. (2001). For this stack, no free energy parameters are available and we use the parameters for the stack , instead. However, other parameterizations for this stack work equally well and reproduce the experimental transition force within errors, see fig. 6.
VI Phase diagrams of RNA hairpin P5ab
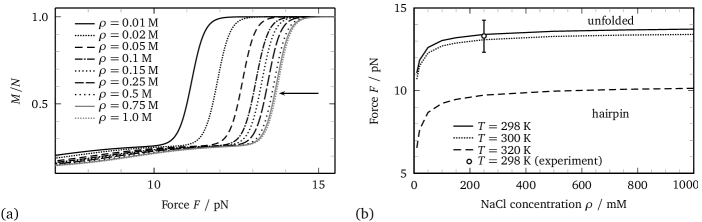
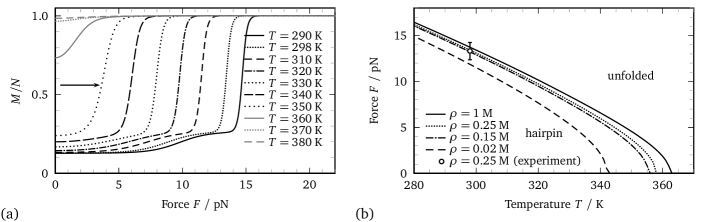
With the tools established in the previous sections, we are now able to study phase diagrams of RNA. We consider the P5ab hairpin, which is a well studied system Liphardt et al. (2001); Gerland et al. (2003); Hyeon and Thirumalai (2005); Wen et al. (2007); Cocco et al. (2003). In fig. 7b the phase diagram in the - plane is shown for and . The phase boundary is defined as the force where half of the helical section is unzipped. For the definition of the phase boundary, we exclude the three unpaired bases at the 5’- and the four bases at the 3’-end, see fig. 5c, and use the condition . This threshold value of is depicted by an arrow in fig. 7a. Below the phase boundary, the hairpin is stable, above the molecule is denatured. In fig. 9b we additionally include the experimental results by Liphardt et al. (2001) agreeing nicely with our results. It is important to note, that this transition is not a phase transition in the strict statistical mechanics sense, but just a crossover. A true phase transition is defined as a non-analyticity of the free energy, which can only occur for an infinite system with long-range interactions Einert et al. (2008). The three-dimensional phase space we are considering is spanned by temperature, force, and salt concentration. In figs. 8 and 9 we show slices in the - and in the - plane. The phase boundary for the - plane is determined the same way as in the - plane, yet with varying temperature and fixed salt concentration. The phase boundary in the - plane is determined differently: heat capacity curves as a function of temperature are calculated for different salt concentrations. The position of the peaks in the heat capacity curves (one is depicted by an arrow in fig. 9a) determine the phase diagram in fig. 9b. Therefore, slight differences between the phase diagrams in figs. 7, 8 on the one hand and fig. 9 on the other hand may arise.
We observe that for large salt concentrations, the denaturation forces and temperatures are rather independent of the salt concentration, see figs. 7 and 9. Only when the Debye screening length is of the order of the typical length scale of RNA, which is the case for , a marked dependence on the salt concentration is observed.
VII Conclusions
We construct a theory for RNA folding and melting that includes the effects of monovalent salt, loop entropy, and stretching forces. Our theory is based on salt and temperature dependent modifications of the free energies of RNA helices and loops that include electrostatic interactions on the linear Debye-Hückel level – augmented by Manning condensation – and conformational fluctuation effects via the asymptotic, non-linear expression for the entropy of loop formation. Decreasing salt concentration is shown to generally destabilize RNA folds and to lower denaturation temperatures and forces. The predictions are in good agreement with experimental data as shown for two different scenarios, namely the heat capacity curves for the thermal denaturation of tRNA-phe and the response of the P5ab RNA hairpin to an external pulling force.
Due to the usage of the linear Debye-Hückel approximation in conjunction with the Manning condensation concept, our approach is limited to monovalent salt and neglects ion-specific effects. Electrostatic nonlinear and correlation effects could in principle be taken into account by more advanced modeling using variational approaches Netz and Orland (2003), while ion-specific effects could be straightforwardly included using effective interactions between different ions and RNA bases Schwierz et al. (2010). More complex phenomena involving multivalent ions such as Mg2+ could in principle be modeled by allowing for a few tertiary contacts, which is left for future studies.
We find that for a proper description of RNA melting curves, correct modeling of the loop entropy is crucial. A non-zero loop exponent leads to an increased cooperativity of the melting transition and thus makes the heat capacity curve narrower in good agreement with experimental results. We conclude that for a correct description of RNA denaturation thermodynamics, both loop entropy and salt effects are important and should be included in standard structure and melting curve prediction software.
VIII Acknowledgements
Financial support comes from the DFG via grant NE 810/7. T.R.E. acknowledges support from the Elitenetzwerk Bayern within the framework of CompInt.
References
- Gesteland et al. (2005) R. F. Gesteland, T. R. Cech, and J. F. Atkins, eds., The RNA World (Cold Spring Harbor Laboratory Press, Woodbury, 2005), 2nd ed.
- Tinoco et al. (1971) I. Tinoco, O. C. Uhlenbeck, and M. D. Levine, Nature 230, 362 (1971).
- Liedl et al. (2007) T. Liedl, T. L. Sobey, and F. C. Simmel, Nano Today 2, 36 (2007).
- Dietz et al. (2009) H. Dietz, S. M. Douglas, and W. M. Shih, Science 325, 725 (2009).
- Xia et al. (1998) T. Xia, J. SantaLucia, Jr, M. E. Burkard, R. Kierzek, S. J. Schroeder, X. Jiao, C. Cox, and D. H. Turner, Biochemistry 37, 14719 (1998).
- Mathews et al. (1999) D. H. Mathews, J. Sabina, M. Zuker, and D. H. Turner, Journal of Molecular Biology 288, 911 (1999).
- Privalov and Filimonov (1978) P. L. Privalov and V. V. Filimonov, Journal of Molecular Biology 122, 447 (1978).
- Vives et al. (2002) M. Vives, R. Tauler, and R. Gargallo, Journal of Inorganic Biochemistry 89, 115 (2002).
- Liphardt et al. (2001) J. Liphardt, B. Onoa, S. B. Smith, I. Tinoco, Jr, and C. Bustamante, Science 292, 733 (2001).
- Vieregg et al. (2007) J. Vieregg, W. Cheng, C. Bustamante, and I. Tinoco, Journal of the American Chemical Society 129, 14966 (2007).
- Huguet et al. (2010) J. M. Huguet, C. V. Bizarro, N. Forns, S. B. Smith, C. Bustamante, and F. Ritort, Proceedings of the National Academy of Sciences of the United States of America 107, 15431 (2010).
- McCaskill (1990) J. S. McCaskill, Biopolymers 29, 1105 (1990).
- Zuker and Stiegler (1981) M. Zuker and P. Stiegler, Nucleic Acids Research 9, 133 (1981).
- Markham and Zuker (2005) N. R. Markham and M. Zuker, Nucleic Acids Research 33, W577 (2005).
- Gerland et al. (2001) U. Gerland, R. Bundschuh, and T. Hwa, Biophysical Journal 81, 1324 (2001).
- Bundschuh and Gerland (2005) R. Bundschuh and U. Gerland, Physical Review Letters 95, 208104 (2005).
- Montanari and Mézard (2001) A. Montanari and M. Mézard, Physical Review Letters 86, 2178 (2001).
- Müller (2003) M. Müller, Physical Review E 67, 021914 (2003).
- Dimitrov and Zuker (2004) R. A. Dimitrov and M. Zuker, Biophysical Journal 87, 215 (2004).
- Imparato et al. (2009) A. Imparato, A. Pelizzola, and M. Zamparo, Physical Review Letters 103, 188102 (2009).
- Einert et al. (2008) T. R. Einert, P. Näger, H. Orland, and R. R. Netz, Physical Review Letters 101, 048103 (2008).
- Einert et al. (2010) T. R. Einert, H. Orland, and R. R. Netz (2010), to be published.
- Müller et al. (2002) M. Müller, F. Krzakala, and M. Mézard, European Physical Journal E 9, 67 (2002).
- Gerland et al. (2003) U. Gerland, R. Bundschuh, and T. Hwa, Biophysical Journal 84, 2831 (2003).
- Hyeon and Thirumalai (2005) C. Hyeon and D. Thirumalai, Proceedings of the National Academy of Sciences of the United States of America 102, 6789 (2005).
- Hyeon and Thirumalai (2006) C. Hyeon and D. Thirumalai, Biophysical Journal 90, 3410 (2006).
- Auffinger and Westhof (2000) P. Auffinger and E. Westhof, Journal of Molecular Biology 300, 1113 (2000).
- Tan and Chen (2006) Z.-J. Tan and S.-J. Chen, Biophysical Journal 90, 1175 (2006).
- Tan and Chen (2007) Z.-J. Tan and S.-J. Chen, Biophysical Journal 92, 3615 (2007).
- Tan and Chen (2008) Z.-J. Tan and S.-J. Chen, Biophysical Journal 95, 738 (2008).
- Jost and Everaers (2009) D. Jost and R. Everaers, Biophysical Journal 96, 1056 (2009), ISSN 0006-3495.
- Owczarzy et al. (2004) R. Owczarzy, Y. You, B. Moreira, J. Manthey, L. Huang, M. Behlke, and J. Walder, Biochemistry 43, 3537 (2004).
- Manning (1969) G. S. Manning, Journal of Chemical Physics 51, 924 (1969).
- Tinoco and Bustamante (1999) I. Tinoco, Jr and C. Bustamante, Journal of Molecular Biology 293, 271 (1999).
- Richards (1969) E. G. Richards, European Journal of Biochemistry 10, 36 (1969).
- van Batenburg et al. (2000) F. van Batenburg, A. P. Gultyaev, C. Pleij, J. Ng, and J. Oliehoek, Nucleic Acids Research 28, 201 (2000).
- Higgs (2000) P. G. Higgs, Quarterly Reviews of Biophysics 33, 199 (2000).
- Cho et al. (2009) S. S. Cho, D. L. Pincus, and D. Thirumalai, Proceedings of the National Academy of Sciences of the United States of America 106, 17349 (2009).
- Duplantier (1986) B. Duplantier, Physical Review Letters 57, 941 (1986).
- Kafri et al. (2000) Y. Kafri, D. Mukamel, and L. Peliti, Physical Review Letters 85, 4988 (2000).
- Kunze and Netz (2002) K.-K. Kunze and R. R. Netz, Physical Review E 66, 011918 (2002).
- Murrell (1994) J. N. Murrell, Properties of liquids and solutions (John Wiley & Sons, Inc, 1994).
- Abramowitz and Stegun (2002) M. Abramowitz and I. A. Stegun, eds., Handbook of Mathematical Functions (U.S. Department of Commerce, 2002), tenth ed.
- Serra and Turner (1995) M. J. Serra and D. H. Turner, Methods in Enzymology 259, 242 (1995).
- Netz and Orland (2003) R. R. Netz and H. Orland, European Physical Journal E 11, 301 (2003).
- Draper et al. (2005) D. E. Draper, D. Grilley, and A. M. Soto, Annual Review of Biophysics and Biomolecular Structure 34, 221 (2005).
- Marko and Siggia (1995) J. F. Marko and E. D. Siggia, Macromolecules 28, 8759 (1995).
- Netz (2001) R. R. Netz, Macromolecules 34, 7522 (2001).
- Gruber et al. (2008) A. R. Gruber, R. Lorenz, S. H. Bernhart, R. Neubock, and I. L. Hofacker, Nucleic Acids Research gkn188, 1 (2008).
- Hofacker et al. (1994) I. L. Hofacker, W. Fontana, P. F. Stadler, L. S. Bonhoeffer, M. Tacker, and P. Schuster, Monatshefte für Chemie 125, 167 (1994).
- Li et al. (2008) P. T. Li, J. Vieregg, and I. Tinoco, Annual Review of Biochemistry 77, 77 (2008).
- Manosas et al. (2006) M. Manosas, D. Collin, and F. Ritort, Physical Review Letters 96, 218301 (2006).
- Seol et al. (2007) Y. Seol, G. M. Skinner, K. Visscher, A. Buhot, and A. Halperin, Physical Review Letters 98, 158103 (2007).
- Tinoco (2004) I. Tinoco, Jr, Annual Review of Biophysics and Biomolecular Structure 33, 363 (2004).
- Woodside et al. (2006a) M. T. Woodside, P. C. Anthony, W. M. Behnke-Parks, K. Larizadeh, D. Herschlag, and S. M. Block, Science 314, 1001 (2006a).
- Woodside et al. (2006b) M. T. Woodside, W. M. Behnke-Parks, K. Larizadeh, K. Travers, D. Herschlag, and S. M. Block, Proceedings of the National Academy of Sciences of the United States of America 103, 6190 (2006b).
- Kumar and Mishra (2008) S. Kumar and G. Mishra, Physical Review E 78, 011907 (pages 5) (2008).
- Wen et al. (2007) J.-D. Wen, M. Manosas, P. T. X. Li, S. B. Smith, C. Bustamante, F. Ritort, and I. Tinoco, Jr, Biophysical Journal 92, 2996 (2007).
- Cocco et al. (2003) S. Cocco, J. Marko, and R. Monasson, European Physical Journal E 10, 153 (2003).
- Schwierz et al. (2010) N. Schwierz, D. Horinek, and R. R. Netz, Langmuir 26, 7370 (2010).
See pages 1,,2,3,4 of RNA_salt_supporting_material.pdf