The Effect of a Cosmic Ray Precursor in SN 1006?
Abstract
Like many young supernova remnants, SN 1006 exhibits what appear to be clumps of ejecta close to or protruding beyond the main blast wave. In this paper we examine 3 such protrusions along the east rim. They are semi-aligned with ejecta fingers behind the shock-front, and exhibit emission lines from O VII and O VIII. We first interpret them in the context of an upstream medium modified by the saturated nonresonant Bell instability which enhances the growth of Rayleigh-Taylor instabilities when advected postshock. We discuss their apparent periodicity if the spacing is determined by properties of the remnant or by a preferred size scale in the cosmic ray precursor. We also briefly discuss the alternative that these structures have an origin in the ejecta structure of the explosion itself. In this case the young evolutionary age of SN 1006 would imply density structure within the outermost layers of the explosion with potentially important implications for deflagration and detonation in thermonuclear supernova explosion models.
Subject headings:
acceleration of particles — cosmic rays — ISM: supernova remnants — shock waves — supernovae: individual(SN 1006)1. Introduction
Supernova remnants (SNRs) have long been suspected as the sites of cosmic ray (CR) diffusive shock acceleration, where 10% of the supernova energy would be required to be transmitted to CRs to satisfy observations. Partial confirmation of this idea came with ASCA observations of SN 1006 (Koyama et al., 1995; Reynolds, 1996), which revealed NE and SW limbs dominated by X-ray synchrotron radiation from CR electrons. Direct evidence of CR ions, presumably the dominant CR component, has been harder to find, for the most part being limited to the observation of -rays resulting from the reaction followed by decay. Eriksen et al. (2011) interpreted newly discovered, regularly spaced stripes of non-thermal emission in Tycho’s SNR as regions where the pre-shock medium has been significantly modified by eV ions. Indirect evidence for CR ions comes from the separation between the forward shock and the contact discontinuity in young SNRs (Warren et al., 2005; Cassam-Chenaï et al., 2008; Ferrand et al., 2010). For example, in SN 1006, the contact discontinuity is predicted to be less than 0.86 of the forward shock radius, but is observed to be larger than that around almost all of the remnant (Cassam-Chenaï et al., 2008; Miceli et al., 2009). This has been interpreted in SN 1006 and Tycho’s SNR as being due to energy losses to CRs at the forward shock (Warren et al., 2005; Cassam-Chenaï et al., 2007, 2008; Miceli et al., 2009), which leads to a greater shock compression ratio and a thinner shell of shocked CSM (Blondin & Ellison, 2001; Fraschetti et al., 2010). However, only in cases of extreme CR energy losses can a fraction of the ejecta in Rayleigh-Taylor (RT) instability approach or overtake the forward shock.
Density inhomogeneities in either the interstellar medium (Jun et al., 1996) or the ejecta (Wang & Chevalier, 2001; Blondin et al., 2001) can also enhance the growth of RT instabilities potentially allowing them to reach the forward shock. Originally motivated to explain the existence of radial magnetic fields in young SNRs (Jun & Norman, 1996), Jun et al. (1996) explored the effect of turbulence induced as the SNR forward shock encounters density clumps (of a factor of 5) in the preshock medium. The vorticity induced by the interaction of the forward shock with the overdense clumps is advected postshock. Upon reaching the contact discontinuity, the vortices transfer their rotational energy to the RT fingers. This enhances the growth of the fingers such that ejecta clumps may protrude beyond the blast wave. In some specific cases it was found that twenty times larger density inhomogeneities would be required in the ejecta to achieve the same result (Wang & Chevalier, 2001; Blondin et al., 2001).
Upstream density clumping may be intrinsic to the pre-shock medium, or induced by a CR shock precursor. In the scenario of nonresonant magnetic field amplification (Bell, 2004, 2005), density clumping by a factor of 3 is produced upstream of the shock as the magnetic field amplification saturates. Magnetic field amplification, also taken by some as indirect evidence for proton acceleration at shocks, is suggested by the narrowness of rims of synchrotron radiation at SNR shocks (Vink & Laming, 2003; Long et al., 2003; Yamazaki et al., 2004; Warren et al., 2005; Cassam-Chenaï et al., 2007; Völk et al., 2005). Modeling the widths allows one to estimate the magnetic field to be in the range 100 - 500 G, far larger than can be attained by the typical compression of ambient magnetic field. Fields of this magnitude may speed up the CR acceleration process, allowing SNRs to generate CRs up to and beyond the “knee” in the CR spectrum, at about eV.
Of all known SNRs, SN 1006 offers the most promising test of the action of CRs to produce density clumping ahead of the forward shock. It is the likely remnant of a Type Ia supernova, located 500 pc above the galactic plane and expanding into low density interstellar medium. A H.E.S.S. detection of SN 1006 has been reported (Naumann-Godó et al., 2008), consistent with an ambient gas density of 0.05 cm-3 (Acero et al., 2007). Proper motions have been measured in the NW in the optical, 0.28” yr-1 (Winkler et al., 2003) corresponding, at a distance of 2.2 kpc, with a shock velocity of 2900 km s-1(Ghavamian et al., 2002). In the NE, 0.48” yr-1 expansion was measured in X-rays (Katsuda et al., 2009) giving 5000 km s-1, indicating higher density in the NW than elsewhere. Hamilton et al. (1997; 2007) derive a reverse shock velocity of 2700 km s-1, and determine the expansion velocity of ejecta entering the reverse shock to be 7000 km s-1, from HST observations.
In this paper, we examine Chandra images and discuss structures seen to protrude beyond the eastern portion of the shock front. Ejecta clumps with similar periodicities are seen behind or near the blast wave elsewhere in SN 1006, most prominently around the southern rim. We chose to study these three features because they extend past the main shock and have deep enough observations for minimal spectral analysis. A more definitive study of all periodic structures in SN1006 is defered to future work, thus numerical results reported herein may not be applicable for all of SN1006.
2. Observations
The eastern portion of SN1006 has been imaged multiple times with Chandra and XMM, and the features under discussion here are evident in all observations. However for the sake of higher statistics we focus only on the two deepest Chandra observations in 2000 July 10, (Obsid 732) and 2008 June 24 (Obsid 9107). As in Katsuda et al. (2009) we exclude times of high background from the 2000 observation but found no flares in the 2008 observation. To further reduce the background we consider only the band in which the emission from SN1006 dominates, from 0.2 to 5.0 keV for imaging, and 0.3 to 6.0 keV for spectral analysis.
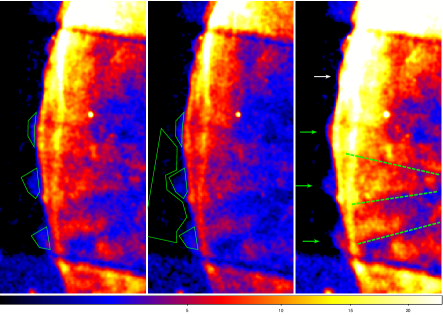
Figure 1 shows the region of interest in each long observation and a merged image where the 2008 observation was shifted 385 along a line 7.5 S of W to match the proper motion found in Katsuda et al. (2009). The features outside of the main shock are highlighted with green polygons that mark the spectral extraction for the 2008 observation. (The 2000 spectra were extracted from proper-motion-shifted regions). The southernmost feature extends below the spectral extraction region, intersecting the bright shock below the chip gap. The coordinates of the polygons are the same in both frames, such that one can clearly see the movement of the outer limits of the features from 2000 to 2008. The proper motion of the features appears comparable to the main bright shock, but is difficult to determine exactly given their low surface brightness. A fourth protrusion to the north that was too narrow to extract a spectrum from is marked in the third panel with a white arrow. Similar features can be seen further north. They do not extend so far in advance of the forward shock, and have no obvious connection with structures extending post shock.
| angular | linear | |
|---|---|---|
| (arcseconds) | ( cm)a | |
| azimuthal length | 83, 41, 46b | 2.7, 1.5, 1.4 |
| radial extent | 25, 20, 10 | 0.8, 0.7, 0.3 |
| spacingc | 145, 125, 125 | 4.8, 4.1, 4.1 |
In Table 1 we present the size scales of the upstream features. The spacing between the three features corresponds to a wavelength of cm at the distance of SN 1006 and assuming all are in the plane of the sky. Looking to the remnant interior one can see clumpy extended fingers of brighter emission with a similar spacing underlined with dashes in Figure 1. The most obvious of these extends from behind the southernmost feature, but others are suggested behind each feature. The peak brightness of the protrusions is between 15% and 45% of the peak brightness of the main shock front immediately behind it.
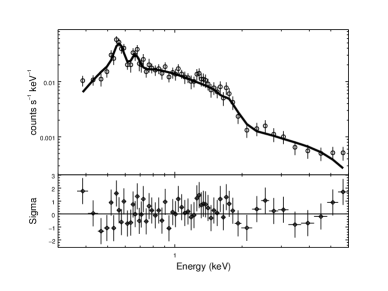
Figure 2 shows the combined spectrum of all three features ahead of the shock in the 2000 data. A background region from the same chip that excluded the features was chosen and modeled rather than subtracted and the spectra were binned to allow the use of statistics. The total counts in the 2000 data between 0.3 and 6.0 keV were 1650 and 1033 for the 3 features and the background region respectively. Table 2 summarizes the best fit values and 3 confidence intervals for a simultaneous fit of the 2000 and 2008 data. An absorbed power-law model with two additional Gaussian lines fits the data well, with an appropriate for SN 1006, and a power-law index consistent with fits to a nearby region of the bright shock. The addition of two Gaussian lines for He-like and H-like O is supported by an Ftest at the 99% significance level. Alternatively, following the SE model of Miceli et al. (2009), the data are fit equally well with a synchrotron and non-equilibrium ionization thermal component. In this fit we allowed only the normalizations, powerlaw index , temperature , and ionization timescale to vary. Their analysis yielded a super-solar oxygen abundance which matches our spectrum well, the only difference being the best-fit ionization timescale for the 3 features is nominally lower than that of the shocked region as a whole (at 1, but not at 3).
| Parameter | Powerlaw Lines | Miceli SE, Powerlaw NEI |
|---|---|---|
| (cm-2) | ||
| Line (eV) | ||
| Line (eV) | ||
| (keV) | ||
| (cm-3 s) | ||
| (dof) | 200.5(197) | 210 (199) |
3. Discussion
3.1. Overview
The most relevant observed characteristics of the three pre-shock features are the generic size-scale of cm, a continuum that is consistent with the synchrotron emission from the bright shock, and the presence of He-like and H-like O lines that imply an ionization age of cm-3 s. This ionization age, comparable to the remnant lifetime given the ambient density of SN 1006, argues against an interpretation of the features as the denser portions of a CR precursor. The likely supersolar abundances with a synchrotron dominated continuum, relative brightness of the preshock features, and small radius of curvature also support the idea that these are ejecta fingers that have breached the shock front.
Hereafter, we discuss possible origins for the spacing of the pre-shock features. (1) Anomalous viscosity determines the preferred RT wavelength. (2) The saturated state of nonresonant magnetic field amplification creates cavities and higher density regions at a particular scale. (3) The ejecta fingers originate in the explosion itself.
3.2. Ejecta Fingers Spaced by Anomalous Viscosity?
If the preshock features seen are the extension of the ejecta fingers themselves (Cassam-Chenaï et al., 2008) then the spacing between them may reflect the wavelength of the R-T instability. In the absence of a periodic perturbation, this depends on the kinematic viscosity (the product of the sound speed and largest eddy size: ).
In stationary incompressible media the Rayleigh-Taylor linear growth rate is approximately which has a maximum at mode wavenumber (Plesset & Whipple, 1974), where cm s-2 for SN 1006 is the deceleration of the plasma (estimated from the SNR dynamics using Truelove & McKee, 1999), and the ejecta density is assumed much greater than that of the shocked ISM.Exponential growth goes over to power law growth as displayed in Blondin & Ellison (2001) when expansion is included. Taking the observed wavelength of cm, we find cm2s-1 and a maximum linear growth rate s-1. This is slow, allowing only 2 e-folding times during the 1000 yr age of SN 1006. Additional vorticity is probably needed to speed up the process.
We can compare this to an estimate of the viscosity from the product of the sound speed in the shocked interstellar medium (about cm s-1) and a length scale determined by the separation between the forward shock and contact discontinuity (about 1 pc) to find cm2s-1. Thus either the viscosity is anomalous by a factor of , or the wavelength of the instability is determined by different physics, i.e. the CRs.
3.3. Clump Spacing Determined by Cosmic Rays?
We explore the case that the ejecta finger spacing is determined by structure in the CR precursor where non-resonant magnetic field amplification has reached saturation (Bell, 2004, 2005). Structure arises because the highest energy CRs, which remain unmagnetized inhabit cavities in the upstream medium which are evacuated by the amplified magnetic field. The plasma and magnetized CRs are swept into cylindrical “walls” surrounding the cavities where the originally quasi-parallel shock has now become quasi-perpendicular. Interpreting the observed structures as ejecta fingers protruding into the cavities, the cavity radius, observed here to be around 55”, or cm at the 2.2 kpc distance of SN 1006 is similar to the unmagnetized CR gyroradius , so
| (1) |
where is the Lorentz factor for a high energy unmagnetized CR and is the amplified magnetic field. The CR rest mass and charge are and , and is the speed of light. To estimate and , we consider a condition for the existence of the nonresonant instability (Bell, 2004)
| (2) |
where and is the CR current in terms of the total number density of CRs , (of which the unmagnetized fraction ), the charge , and the shock velocity at which CRs are assumed to stream.111We are taking the CR distribution function , with , and . The injection momentum is , so that , and is the minimum momentum of the unmagnetized CRs. For SN 1006 with km s-1, . The total CR number density in terms of , the ratio of CR pressure to shock ram pressure, with , is
| (3) |
where cm-3 is the ion density in the upstream medium. Hence , or with , G then . At a position further to the north, Morlino et al. (2010) infer a value of , which results in higher values of G and . Both these values imply eV, which is past the “knee” in the CR spectrum.
3.4. Ejecta Fingers Associated with SN Explosion?
The possibility remains that the ejecta structure interpreted as due to RT instability above is in fact related to the Type Ia explosion, as in e.g. the O-DDT model of Maeda et al. (2010a) illustrated in Maeda et al. (2010b). In other SN Ia remnants, such as Tycho, similar clumps to the ones considered here show the clear presence of Fe ejecta and as a result have been interpreted in this way. Delayed detonation models (e.g Gamezo et al., 2004) appear to be the most plausible explosion model for a Type Ia SN (Badenes et al., 2006, see e.g.). Ashes burnt by the deflagration may exhibit structure (Maeda et al., 2010a; Jordan et al., 2008), whereas large density gradients appear to be absent from ejecta burnt by a detonation wave (e.g Maeda et al., 2010a; Meakin et al., 2009). Unburnt ejecta exterior to these regions may survive due to expansion ahead of the deflagration front, with the density diminishing sufficiently to allow them also to escape burning in any subsequent detonation as well.
In SN 1006, both spectrally and dynamically, it appears that the reverse shock has only recently encountered regions that were subject to thermonuclear burning. Suzaku recently detected Fe K emission with a low ionization age consistent with the Fe ejecta being more recently shocked than the other ejecta (Yamaguchi et al. 2008). The ejecta expansion velocity at the reverse shock in the observations of Hamilton et al. (1997; 2007) is close to the predicted outer extent of Fe produced in the C-DDT and C-DEF models of Maeda et al. (2010a), and also that in the various models tabulated by Badenes et al. (2005). Hamilton et al. (1997) comment that the ISM density at the back of the SNR is likely to be lower than elsewhere, and so the reverse shock in other regions of the remnant may have progressed further into the ejecta, shocking some of the Fe as is now seen by Suzaku (Yamaguchi et al. 2008). By comparison, in Tycho’s SNR, Badenes et al. (2006) find that the reverse shock has reached all but the last 0.4 of ejecta. Thus these Ia SNRs are at significantly different evolutionary stages in terms of the location of the reverse shock in the ejecta. An ejecta origin for the protrusions in SN 1006 would have different implications for the locus of deflagration and detonation burning than for similar clumps in Tycho, in terms of the location of deflagration ashes and whether their structure can survive a detonation wave, as in the asymmetrical O-DDT model of Maeda et al. (2010a).
4. Conclusions
The structures observed exterior to the blast wave along the eastern limb of SN 1006 are likely to be metal-rich ejecta based on their probable supersolar abundances of O. We believe that a mechanism combining the ideas of Jun et al. (1996) and Bell (2004) is one way to bring the ejecta so close to the blast wave. Upstream density inhomogeneities of only a factor of 5 in the ISM could allow some RT fingers to overtake the blast wave, with the cavities and density enhancements that are a natural consequence of CR magnetic field amplification.
We contend that prior explanations for ejecta overtaking the shock are insufficient if acting alone. Invoking enhanced shock compression following CR losses, Blondin & Ellison (2001), needed post-shock compressions by a factor of 21 to obtain RT fingers that actually overtook the forward shock. This would imply implausibly high energy losses (77% of shock ram pressure lost as CRs, from equation 2 of Liang & Keilty, 2000). The recent more conservative simulations of Fraschetti et al. (2010) do not show RT fingers that exceed the blast wave radius, but do show that 2% of the ejecta material reaches within 95% of the forward shock radius (see also Wang, 2010).
If the protrusions are RT fingers, we can interpret the size scale of the pre-shock features in terms of properties of the SNR in this sector of the shell. If the size scale is determined by the properties of the SNR plasma, assuming that the CR precursor itself establishes no preferred wavenumber for RT growth, then the viscosity would need to be anomalous by a factor of . If instead the CR precursor develops a preferred size scale (Bell, 2004, 2005), and this determines the wavelength of RT growth, the spacing may be interpreted in terms of CR parameters to give G and . This implies CR acceleration up to the knee in SN 1006.
The other tantalizing possibility is that these structures have an origin in the ejecta. If deeper observations revealed Fe as is seen in some ejecta clumps in Tycho’s SNR, the clumpiness, Fe, and low evolutionary age of SN 1006 would imply that deflagration ashes survived near the exterior of the exploding white dwarf.
CER and JML acknowledge support from NASA contract NNH10A009I, and basic research funds from the Office of Naval Research. KAE and JPH acknowledge support from Chandra grant number GO9-0078X to Rutgers University. PG acknowledges HST grant GO-11184.07A at STScI.
References
- Acero et al. (2007) Acero, F., Ballet, J., & Decourchelle, A. 2007, A&A, 475, 883
- Badenes et al. (2005) Badenes, C., Borkowski, K. J., & Bravo, E. 2005, ApJ, 624, 198
- Badenes et al. (2006) Badenes, C., Borkowski, K. J., Hughes, J. P., Hwang, U., & Bravo, E. 2006, ApJ, 645, 1373
- Bell (2004) Bell, A. R. 2004, MNRAS, 353, 550
- Bell (2005) Bell, A. R. 2005, MNRAS, 358, 181
- Blondin & Ellison (2001) Blondin, J. M., & Ellison, D. C. 2001, ApJ, 560, 244
- Blondin et al. (2001) Blondin, J. M., Borkowski, K. J., & Reynolds, S. P. 2001, ApJ, 557, 782
- Cassam-Chenaï et al. (2007) Cassam-Chenaï, G., Hughes, J. P., Ballet, J., & Decourchelle, A. 2007, ApJ, 665, 315
- Cassam-Chenaï et al. (2008) Cassam-Chenaï, G., Hughes, J. P., Reynoso, E. M., Badenes, C., & Moffett, D. 2008, ApJ, 680, 1180
- Eriksen et al. (2011) Eriksen, K. et al. 2011, ApJ, 728, 28
- Ferrand et al. (2010) Ferrand, G., Decourchelle, A., Ballet, J., Teyssier, R., & Fraschetti, F. 2010, A&A, 509, L10
- Fraschetti et al. (2010) Fraschetti, F, Teyssier, R., Ballet, J., & Decourchelle, A. 2010, A&A, 515, A104
- Gamezo et al. (2004) Gamezo, V., Khokhlov, A. M., & oran, E. S. 2004, Phys. Rev. Lett., 92, 211102
- Ghavamian et al. (2002) Ghavamian, P., Winkler, P. F., Raymond, J. C., & Long, K. S. 2002, ApJ, 572, 888
- Hamilton et al. (1997) Hamilton, A. J. S., Fesen, R. A., Wu, C.-C., Crenshaw, D. M., & Sarazin, C. L. 1997, ApJ, 481, 838
- Hamilton et al. (2007) Hamilton, A, J. S., Fesen, R. A., & Blair, W. P. 2007, MNRAS, 381, 771
- Jordan et al. (2008) Jordan, G. C., Fisher, R. T., Townsley, D. M., Calder, A. C., Graziani, C., Asida, S., Lamb, D. Q., & Truran, J. W. 2008, ApJ, 681, 1448
- Jun & Norman (1996) Jun, B.-I., & Norman, M. L. 1996, ApJ, 472, 245
- Jun et al. (1996) Jun, B.-I., Jones, T. W., & Norman, M. L. 1996, ApJ, 468, L59
- Katsuda et al. (2009) Katsuda, S., Petre, R., Long, K. S., Reynolds, S. P., Winkler, P. F., Mori, K., & Tsunemi, H. 2009, ApJ, 692, L105
- Koyama et al. (1995) Koyama, K., Petre, R., Gotthelf, E. V., Hwang, U., Matsuura, M., Ozaki, M., & Holt, S. S. 1995, Nature, 378, 255
- Liang & Keilty (2000) Liang, E., & Keilty, K. 2000, ApJ, 533, 890
- Long et al. (2003) Long, K. S., Reynolds, S. P., Raymond, J. C., Winkler, P. F., Dyer, K. K., & Petre, R. 2003, ApJ, 586, 1162
- Maeda et al. (2010a) Maeda, K., Röpke, F. K., Fink, M., Hillebrandt, W., Travaglio, C., & Thielemann, F.-K. 2010, ApJ, 712, 624
- Maeda et al. (2010b) Maeda, K., et al. 2010b, Nature, 466, 82
- Meakin et al. (2009) Meakin, C. A., Seitenzahl, I., Townsley, D., Jordan, G. C., Truran, J., & Lamb, D. 2009, ApJ, 693, 1188
- Miceli et al. (2009) Miceli, M. et al. 2009, A & A, 501, 239
- Morlino et al. (2010) Morlino, G., Amato, E., Blasi, P., & Caprioli, D. 2010, MNRAS, 405, L21
- Naumann-Godó et al. (2008) Naumann-Godó, M., Beilicke, M., Hauser, D., Lemoine-Goumard, M., & de Naurois, M. 2008, American Institute of Physics Conference Series, 1085, 304
- Plesset & Whipple (1974) Plesset, M. S., & Whipple, C. G. 1974, Phys. Fluids, 17, 1
- Reynolds (1996) Reynolds, S. P. 1996, ApJ, 459, L13
- Truelove & McKee (1999) Truelove, J. K., & McKee, C. F. 1999, ApJS, 120, 299
- Vink & Laming (2003) Vink, J., & Laming, J. M. 2003, ApJ, 584, 758
- Völk et al. (2005) Völk, H. J., Berezhko, E. G., & Ksenofontov, L. T. 2005, A&A, 433, 229
- Wang & Chevalier (2001) Wang, C.-Y., & Chevalier, R. A. 2001, ApJ, 549, 1119
- Wang (2010) Wang, C.-Y., 2010 MNRAS, submitted
- Warren et al. (2005) Warren, J. S., et al. 2005, ApJ, 634, 376
- Winkler et al. (2003) Winkler, P. F., Gupta, G., & Long, K. S. 2003, ApJ, 585, 324
- Yamazaki et al. (2004) Yamazaki, R., Yoshida, T., Terasawa, T., Bamba, A., & Koyama, K. 2004, A&A, 416, 595