Antiferromagnetism and Superconductivity in CeRhIn5
Abstract
We discuss recent results on the heavy fermion superconductor CeRhIn5 which presents ideal conditions to study the strong coupling between the suppression of antiferromagnetic order and the appearance of unconventional superconductivity. The appearance of superconductivity as function of pressure is strongly connected to the suppression of the magnetic order. Under magnetic field, the re-entrance of magnetic order inside the superconducting state shows that antiferromagnetism nucleates in the vortex cores. The suppression of antiferromagnetism in CeRhIn5 by Sn doping is compared to that under hydrostatic pressure.
1 Introduction
The interplay between rivaling ground states and the appearance of unconventional superconductivity is a central issue in physics of strongly correlated electron systems including heavy fermion metals, but also [1], high- cuprates [2], organics charge transfer salts [3], and the recently discovered iron pnictides [4]. In all these examples unconventional superconductivity appears in the vicinity of a magnetically ordered state and strong deviations from the Landau Fermi liquid description of a metal appears due to the importance of quantum fluctuations. Quantum criticality is the driving mechanism for unconventional superconductivity.
The competition between antiferromagnetic order and unconventional superconductivity has been intensively studied in Ce based heavy fermion systems. A breakthrough was the discovery of the heavy fermion family CeIn5. The crystal structure of these materials is tetragonal and it is build of planes of CeIn3 and planes of In2 ( = Rh, Co, or Ir) which are stacked sequently along the direction. The cubic CeIn3 itself is an antiferromagnet and superconductivity appears under high pressure around GPa at temperatures below mK [1, 5]. The introduction of the In2 plane increases the in-plane interaction of the Ce ions and this may result in a more two-dimensional (2D) character of the systems what may be responsible for the strong enhancement of the superconducting transition temperature in the Ce 115 compounds in comparison to CeIn3 [6, 7]. In this article we will review the pressure–temperature-magnetic field phase diagram of CeRhIn5 and discuss the effect of Sn doping in detail.
2 Phase Diagram of CeRhIn5
CeRhIn5 turns out to be an ideal system to study the interplay of magnetism and superconductivity. At ambient pressure it orders antiferromagnetically below K with an incommensurate wave vector [8, 9]. The pressure–temperature phase diagram has been studied previously in detail by different groups and nice consensus has been observed on the phase diagram (see e.g. Ref. \citenKnebel2010). Under application of high pressure, has a smooth maximum for GPa and is monotonously suppressed for higher pressure (see Fig. 1a)). At the first critical pressure GPa, when , antiferromagnetism is rapidly suppressed. Below this pressure a small domain of coexistence of magnetism and superconductivity (AF +SC) exists. Microscopic evidence for this coexistence was given by NQR experiments under high pressure.[11] It was shown that the magnetic structure gets commensurable with when entering in the coexisting phase AF +SC at GPa. Furthermore, the spin-lattice relaxation is homogeneous and independent on the local site what is a nice hint of the coexistence of both states below [12, 13, 11]. The results from neutron diffraction experiments is less clear. Here a continuous change of the incommensurability with pressure has been observed as function of pressure, but no decisive conclusion of the ordering vector in the AF+SC state could be given [14, 15].
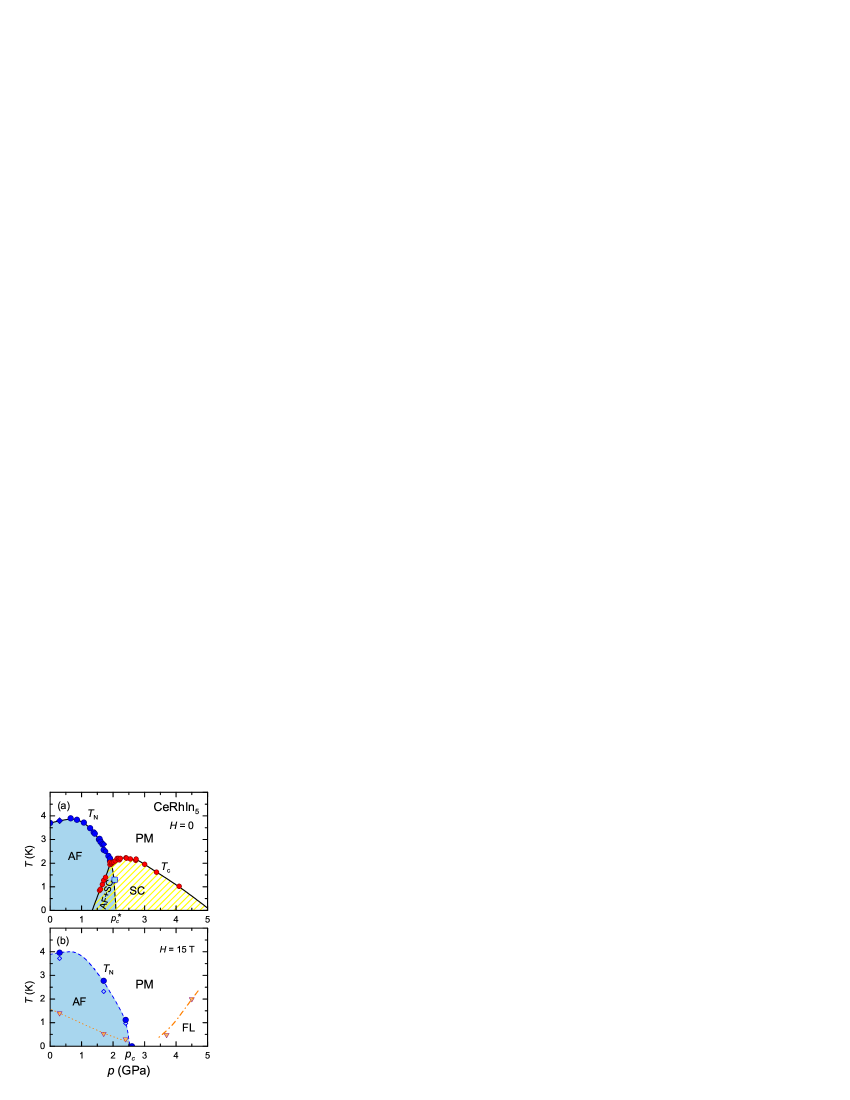
The superconducting transition temperature has a maximum at GPa. This pressure corresponds to a linear extrapolation of to zero and would be the critical pressure of the system in absence of superconductivity. Indications of the location of the critical pressure are shown in Fig. 2. The resistivity at K just above the onset of superconductivity shows a strong maximum as function of pressure at due to the enhancement of the scattering caused by critical fluctuations [16]. The resistivity as function of temperature in this pressure range shows clearly a non-Fermi liquid behavior with a sub-linear dependence above the superconducting transition [17, 18]. Several theoretical proposals for a linear dependence are discussed in the literature such as two-dimensional spin fluctuations, critical valence fluctuations or a selective Mott transition.[19, 20, 21]. However, the deeper meaning of this very unconventional temperature dependence is not completely understood and, at least in our view, the sub-linearity is much more an effect of a cross-over to the low temperature regime in difference to Ref. \citenPark2008d.
Another important indicator of the critical pressure can be obtained by studying the phase diagram of CeRhIn5 under magnetic fields above the superconducting upper critical field as shown in Fig.1 b. For T, antiferromagnetism is suppressed at GPa and concomitant the temperature region where the resistivity follows a nice dependence collapses. Only far above the critical pressure a nice dependence of the resistivity is recovered. The coefficient for at T is shown in Fig.2 b) [17]. In difference to the prototypical heavy-fermion superconductor CeCu2Si2 where the magnetic quantum critical point () and a sharp valence transition (at GPa) are clearly separated in pressure and two different superconducting domes exist [22, 23], in most other heavy fermion superconductors such a clear separation of both criticalities is not possible. Thus, as function of pressure both criticalities seem to fall together, e.g. in CeIn3 [5], CePd2Si2 [24], and also here in CeRhIn5 only one maximum in the pressure dependence of the coefficient occurs. The disappearance of magnetism at appears to be also driven by the valence fluctuations. Valence and spin fluctuations are here strongly coupled.

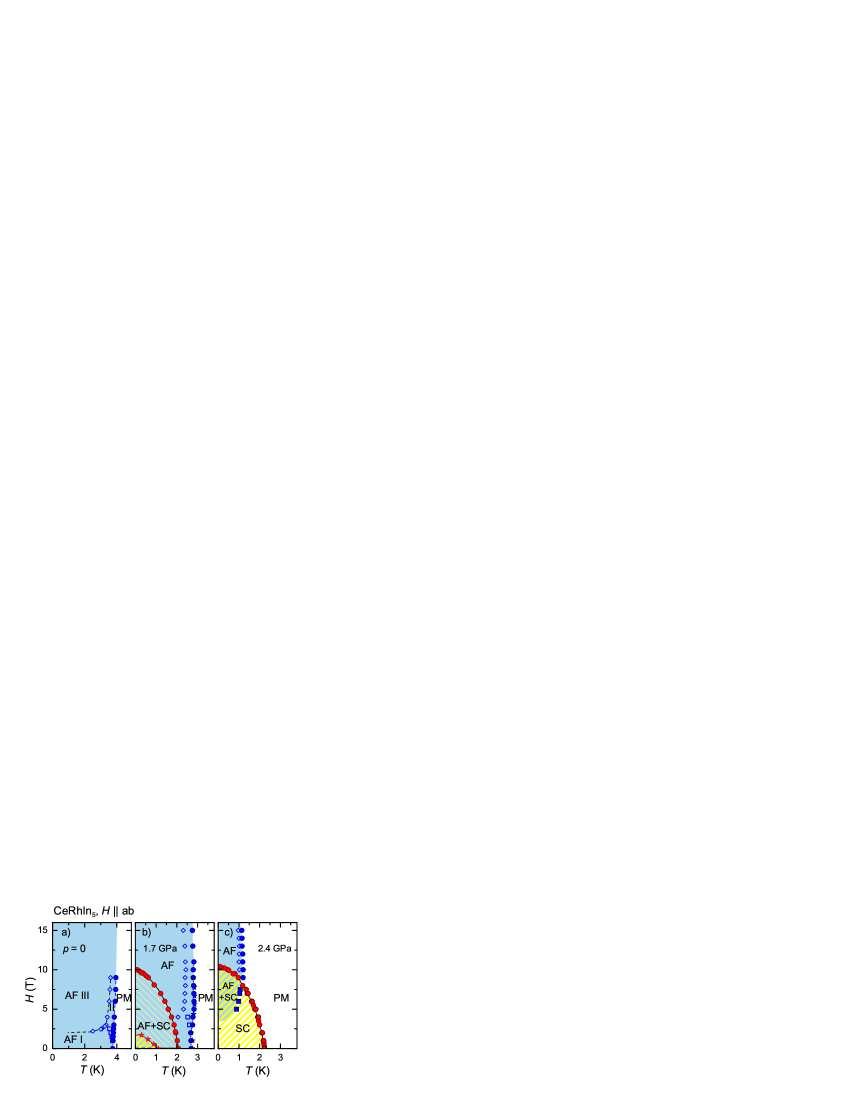
The application of a magnetic field will lead to another test of the interplay between antiferromagnetism and superconductivity. The magnetic phase diagram of CeRhIn5 has been studied under magnetic fields up to 60 T by magnetization measurements. In magnetization measurements for two transitions have been observed at low temperatures at T and T [26]. The low temperature magnetic phase diagram has been established by specific heat measurements showing three different magnetic phases [27] and their magnetic structures have been determined by neutron scattering [9]. Figure 3a) shows the phase diagrams at ambient pressure. The incommensurate structure (AF I) changes to commensurate (AF III) for a field of T with an ordering vector and the magnetic structure has changed to a collinear one. The ordering in phase AF II is also incommensurate [9].
Figure 3b) shows the magnetic phase diagram for GPa. From the specific heat experiments the phase diagram is similar to that at ambient pressure with three different antiferromagnetic structures. However, the structure of these phases has not been determined up to now. On top of the magnetic phase diagram is set the superconducting phase diagram. Here a strong difference between determined by resistivity and specific heat has been observed [25]. Furthermore, it should be noted that, as discussed above, from the NQR spectra it has been concluded that the magnetic structure is commensurate with in the AF+SC coexistence regime [13]. Thus, the complete determination of the magnetic structure of the different states is still open.
The most exciting case appears in the pressure range .[28] The fascinating observation is that magnetism is induced deep inside the superconducting phase by applying a magnetic field.[28, 29] The microscopic nature of the field induced state has not been determined yet. An appealing pictures is that magnetism will appear initially from the vortex cores. As the system is in that peculiar pressure region very close to a magnetic instability the magnetic correlation length will be very long (compared to the atomic length scale) and thus long range correlations will appear when under magnetic field the vortex cores will approach each other.[30, 31] For pressure no indication of re-entrant antiferromagnetism is observed. The collapse of antiferromagnetism induced under magnetic field coincided with the critical pressure .
We want to emphasize that coincides with an abrupt change of the Fermi surface [32]. Below the Fermi surface of CeRhIn5 is approximately the same as those of the non compound LaRhIn5, but above it has the same form and volume than that of CeCoIn5. This change of the Fermi surface has been interpreted as a transition from an localized to a itinerant state. However, this interpretation is still under debate and this change of the Fermi surface may be caused by the interplay of magnetism and critical valence fluctuations [20] or some local quantum criticality at [33, 32, 18].
No microscopic experiments exist to study this new field induced state up to now. This is mainly due to the difficulty to realize the triple extreme conditions in neutron scattering experiments, low temperature, hydrostatic pressure GPa, and high magnetic field.
3 Superconductivity
Two remarkable features appear in the pressure phase diagram of CeRhIn5 : (i) the abrupt suppression of the antiferromagnetic order when superconductivity sets in above at the pressure and (ii) the smooth pressure dependence of through .
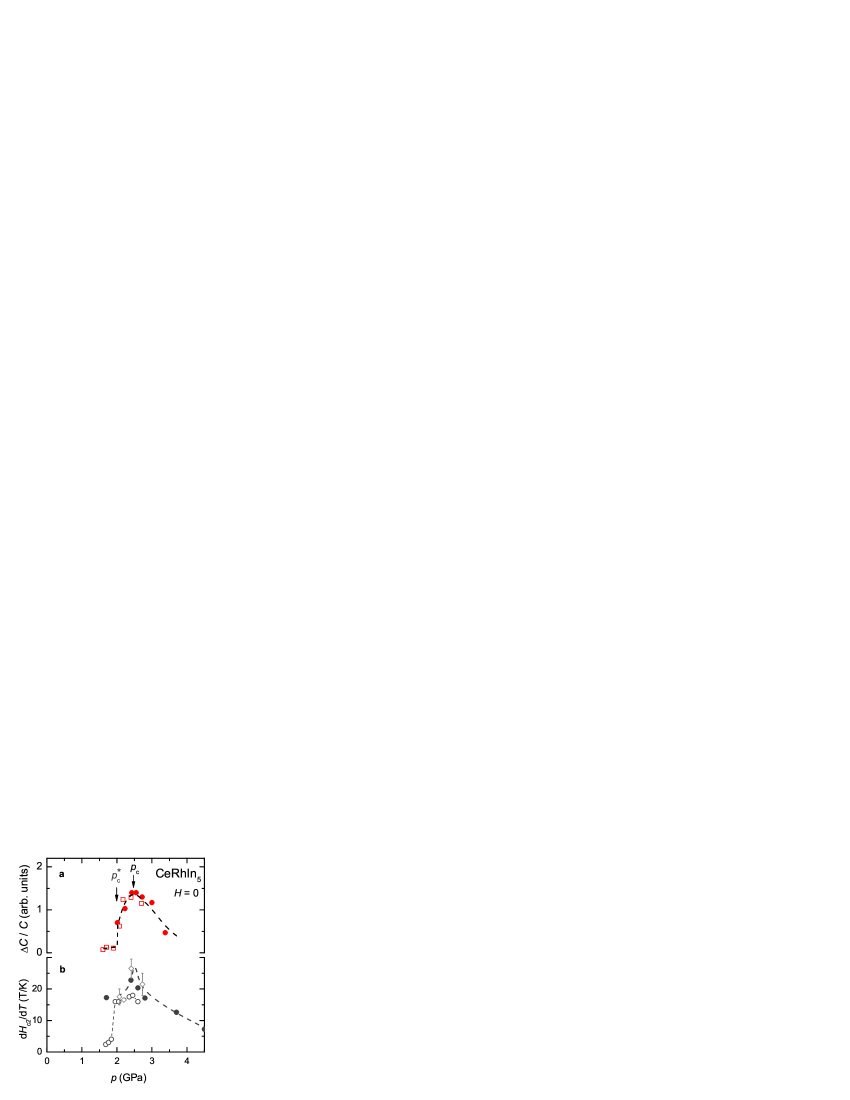
Figure 4 a) shows the pressure dependence of the normalized specific heat anomaly at the superconducting transition in zero magnetic field. Two points get obviously: firstly, the superconducting anomaly in the AF+SC state below the specific heat anomaly at the superconducting transition is very small and increases step-like at . Secondly, at the critical pressure the specific heat jump shows a pronounced maximum and decreases to higher pressures. For a conventional BCS-like superconductor in the weak coupling limit, the jump at the superconducting transition has an universal value, independent of . The fact that the specific heat anomaly below is very small has been first interpreted as indication that superconductivity may not be bulk, but only a small volume fraction shows bulk superconductivity [34]. As mentioned above now the interpretations is different as the coexistence of antiferromagnetism and superconductivity has been shown explicitly in the NQR experiments [13]. However, the pressure evolution of the specific heat jump at indicates that the onset of superconductivity must be accompanied with a change in the magnetic properties leading to a non BCS anomaly. antiferromagnetism and superconductivity are competing phenomena on the Fermi surface and they are intuitively coupled.
Further insights on the superconducting properties can be obtained from the temperature dependence of the upper critical field. From the initial slope it should be possible to estimate the effective mass of the charge carriers. The pressure dependence of the initial slope is shown in Fig. 4b). In the AF+SC state the initial slope as detected in the ac calorimetry [25] increases gradually with pressure up to , but at a step increase of the initial slope appears. Thus in low magnetic fields an abrupt change in the electronic properties must occur at at the border to the pure superconducting state. Looking at the properties of the Fermi surface this abrupt increase can be interpreted in that way that the average Fermi velocity decreases strongly or in terms of the effective mass of the charge carriers a jump of the average effective mass which is connected to the change of the Fermi surface for at . At the hidden magnetic quantum critical point at GPa the initial slope has a rather pronounced maximum and corresponds to a maximum in the effective mass as has been already discussed for the coefficient. This reflects itself again in the superconducting properties. To analyze completely the upper critical field curve, at least above , it is necessary to take into account strong coupling effects. For CeRhIn5 we found a strong coupling parameter of close to the critical pressure, thus the mass enhancement due to the superconducting coupling is [17]. However, compared to the pressure variation of the effective mass as determined from the transport measurements at high pressure this is a rather smooth variation. De facto the strong coupling constant changes under pressure but its changing is not directly linked to the pressure variation of as itself can change drastically under pressure notably near a valence transition.
There is no conclusive determination of the superconducting order parameter of the coexistence regime for . In the NQR experiments a residual density of states is observed [12]. Evidence for wave superconductivity has been reported from angular dependent specific heat experiments [35]. Above it is well accepted in the literature that CeRhIn5 is a -wave superconductor with line nodes as the non magnetic compounds CeCoIn5 and CeIrIn5. This is mainly concluded from the temperature dependence of the nuclear spin relaxation rate and the absence of the Hebel-Slichter peak [36].
4 Suppression of AF in CeRhIn5 by Sn doping
Another way to suppress the antiferromagnetism in CeRhIn5 is given by doping. Different experiments have been performed in the past like diluting the Kondo lattice by the substitution of Ce by La [37, 38] or an isoelectronic substitution of Rh by Co or Ir, which leads to a coexistence of antiferromagnetism and superconductivity in a broad concentration range,[39, 40, 41, 42, 43]. The substitutions on the transition metal site leads to rather complicated phase diagrams with a strong interplay between the incommensurate and the commensurate antiferromagnetic ordering vector and superconductivity. Another possibility is given by Sn, Cd, or Hg doping on the In site [44, 45, 46] which is non-isoelectronic: Sn has one electron more and Cd, Hg one less electron than In. Thus the effect is opposite for these substitutions. In the case of Cd doping in CeCoIn5 detailed NQR experiments have inferred that the Cd ions nucleate magnetic order on a local scale by creating magnetic droplet [47] whereas the electron doping with Sn suppresses superconductivity linearly [48].
In CeRhIn5, Sn doping suppresses the antiferromagnetic order [44] as the additional electron of Sn atoms increases the conduction electron density of states and thus the Kondo temperature will be enhanced. To study the magnetic phase diagram as function of Sn doping in more detail, we grew new single crystals of CeRhIn5-xSnx out of the In flux starting with a ratio Ce : Rh : In : Sn = 1 : 1 : 20 : . In Ref. \citenBauer2006b a linear relationship between the actual Sn concentration in the crystal and the starting Sn ratio in the flux has been found. We took the same relation in the determination of the actual concentration throughout this article. In addition, to verify the actual concentration neutron diffraction experiments at ILL Grenoble on the thermal four-circle diffractometer D15 on a single crystal with an nominal concentration of have been performed recently. The result of the best refinement gives a slightly higher Sn concentration taking into account that the Sn does not occupy only the In(1) but also the In(2) site in the structure [49] which is in difference to CeCoIn5-xSnx where the preferential occupation of Sn is the In(1) site within the ”CeIn3” planes [50]. However, a more detailed structural analysis has to be done to define the actual Sn concentration for all concentrations.
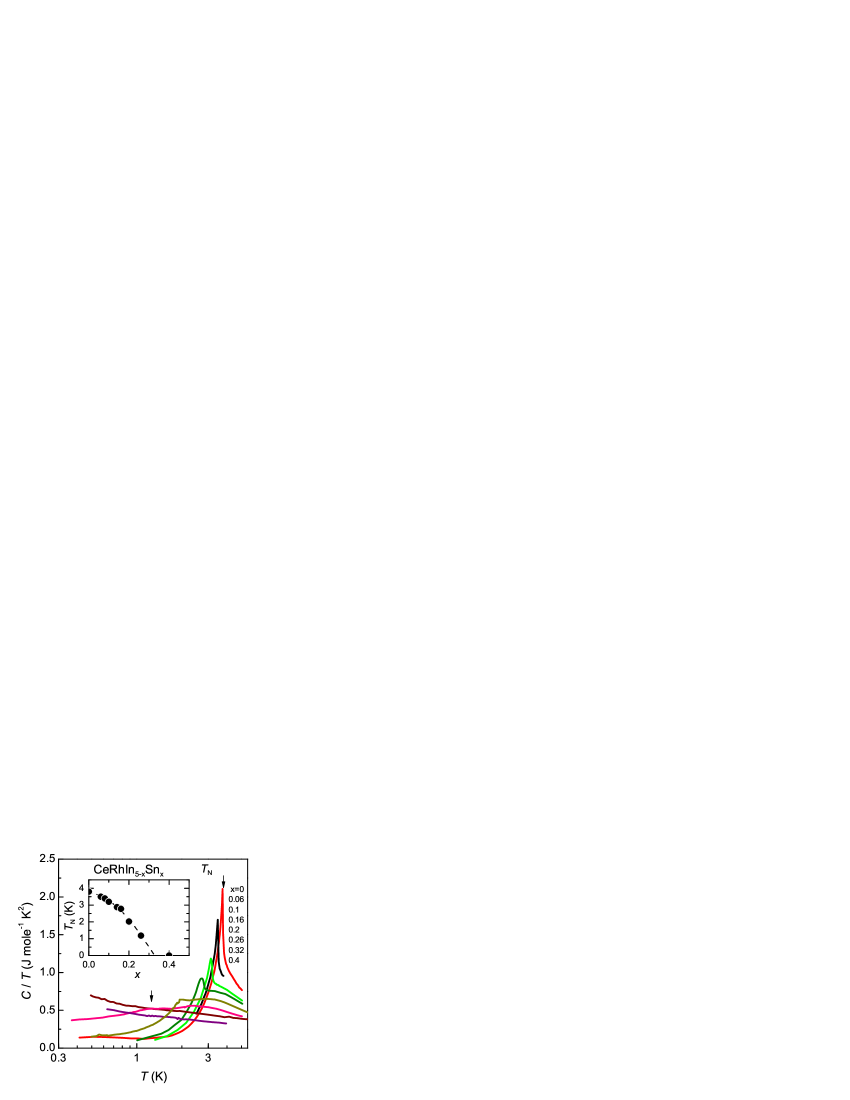
Figure 5 shows the specific heat of CeRhIn5-xSnx for various Sn concentrations. With increasing the lambda-like magnetic anomaly at is suppressed and the magnetic transition gets smeared out. For e.g. only a small hump is visible at the magnetic transition. A broad Schottky-like peak in appears around K for and this anomaly shifts to lower temperature with increasing . In pure CeRhIn5 this anomaly cannot be identified as its maximum coincides almost with . In CeRhIn5 the entropy associated with the magnetic transition is only and the remaining entropy is recovered only at K indicating strong magnetic correlations above . The Schottky like anomaly has been attributed to short range magnetic correlations [44, 51]. For the specific heat increases logarithmically to low temperatures in the range from at least 5 K to 0.75 K and increases stronger to lower temperatures. This increase may be due to the onset of magnetic order at even lower temperatures. For we find roughly in all measured temperature range. This dependence is generally found close to an antiferromagnetic quantum critical instability in a 3D spin-density scenario at intermediate temperatures followed by a square root temperature dependence at lowest temperatures. However, more detailed very low temperature specific heat experiments are required to study this criticality.
The inset in Fig. 5 shows the the Néel temperature as function of the actual Sn concentration and we find good agreement of with previous published data [44]. A linear extrapolation of indicates a critical concentration of . However, low temperature thermal-expansion measurements suggest higher critical concentration of as deviates at low temperatures from the linear extrapolation and this may be due to the weak disorder induced by doping.[52] A similar tail of has been observed e.g. in CeIn3-xSnx series.[53]
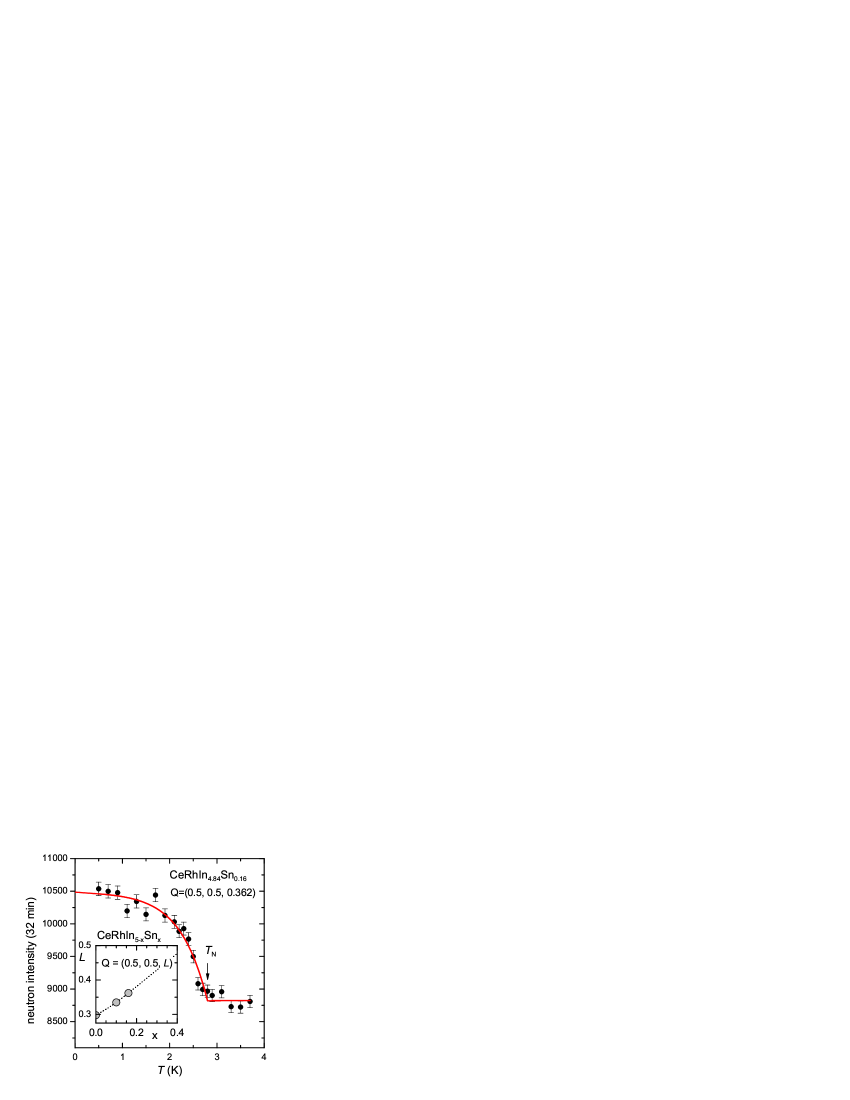
The magnetic structure of Sn doped single crystals have been studied at ILL Grenoble on diffractometer D23. Details of the experiments will be published in a forthcoming article [49]. Sn doping leads to a continuous change of the magnetic propagation vector. In Fig. 6 we show the temperature dependence of the peak intensity measured at the ordering wave vector for CeRhIn4.84Sn0.16. The magnetic moment is reduced compared to the moment of the pure compound.[9] The Néel temperature K determined from the neutron diffraction is in good agreement with the specific heat experiment. The inset in Fig. 3 shows the evolution of the component of the propagation vector along the direction as function of Sn doping . With increasing Sn contents it changes continuously from for to at . Interestingly, a rough extrapolation to the critical concentration would indicate a commensurate magnetic structure very close to the critical concentration.
Next we want to focus on the phase diagram under magnetic field axis which is plotted in Fig. 7 for a Sn concentration of . The phase diagram has been obtained by specific heat experiments under magnetic field. Again, as in the pure compound, three different magnetic phases can be assigned. We know from neutron scattering that at zero field the magnetic structure is incommensurable with a component along the direction of . In analogy to CeRhIn5, under magnetic field the structure may change at a field of T probably to an commensurate structure with an ordering vector .
The important point we want to stress is that the effect on the magnetic properties induced by Sn doping or hydrostatic pressure is very similar. However, a significant difference is that superconductivity is not observed at ambient pressure. In a more general view, antiferromagnetism and superconductivity are strongly interacting order parameters on the Fermi surface. In the pure CeRhIn5 the pressure induced change of the Fermi leads close to 2 GPa implies a suppression of antiferromagnetism and the formation of a pure superconducting ground state. Sn doping however does not only modify the Fermi surface properties, but also induces an additional scattering mechanism which acts as pair breaking. Detailed studies of this effect have been performed for the suppression of superconductivity in CeCoIn5 by Sn doping [48, 50].

It should be noted that pressure induced superconductivity has been observed in CeRhIn4.84Sn0.16 in resistivity and specific heat experiments.[54] The obtained pressure–temperature phase diagram for that Sn concentration is very similar to the pure compound, but shifted to lower pressures.
5 Conclusions and Perspectives
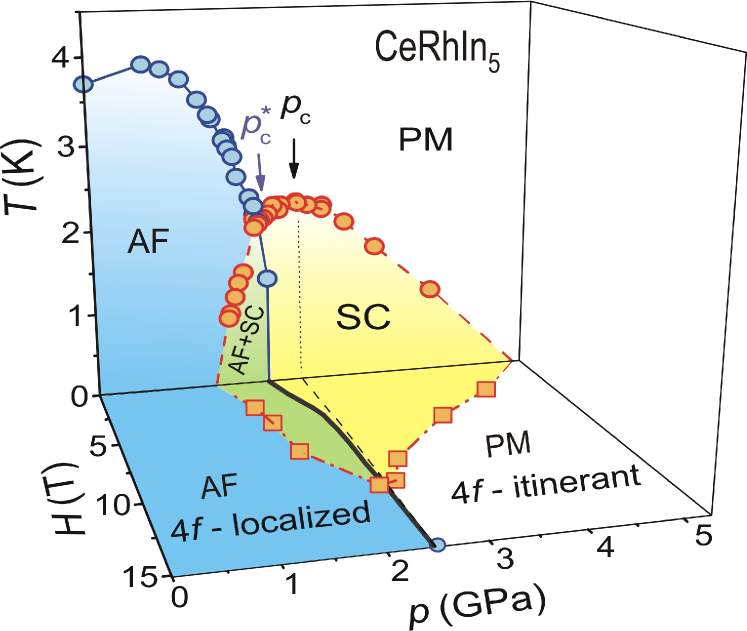
CeRhIn5 is an exciting heavy-fermion system which allows to study in detail the interplay of long range antiferromagnetic order and superconductivity. Due to the fact that in this system the transition temperatures of antiferromagnetism and superconductivity are of the same order of magnitude a precise determination of the high pressure phase diagram could be realized. The combined phase diagram is plotted in Fig. 8. Under pressure and magnetic field three different regions appear, purely antiferromagnetic AF, a coexistence regime AF+SC, and a purely superconducting phase SC above . Thus as function of pressure at zero field the series of phases is AF – AF+SC – SC. In the pressure region between and under application of magnetic field magnetic order is induced and one can observe the cascades of phases SC – AF+SC – AF with increasing field. There seems to be a difference between the pressure induced AF+SC and field induced AF+SC states. When the AF state is established first under pressure at , the measured specific heat jump and the initial slope of the upper critical field are still small and the superconducting transition at may coincide with a magnetic transition from an incommensurate to a commensurate structure. In contrast, when above first superconductivity appears on cooling, the field induced AF state seems to have no influence on the SC properties such as . Up to now no microscopic measurements exist in the pressure range from to under magnetic field, obviously the field induced magnetic state is directly connected to the appearance of vortices in the mixed state of the superconductor.
The substitution of In by Sn suppresses the magnetic order of CeRhIn5. While the magnetic structure as function of Sn doping and hydrostatic pressure seems to have a very similar behavior, superconductivity at ambient pressure appears only under pressure what indicates that Sn doping suppresses superconductivity.
Acknowledgment
This work has been financially supported by the French ANR programs DELICE and CORMAT.
References
- [1] N. D. Mathur, F. M. Grosche, S. R. Julian, I. R. Walker, D. M. Freye, R. K. W. Haselwimmer and G. G. Lonzarich: Nature 394 (1998) 39.
- [2] S. Sachdev: phys. stat. sol. B 247 (2010) 537.
- [3] C. Bourbonnais and D. Jérome: Physics of Organic Superconductors and Conductors, SpringerSeries in Material Science Vol.110 (Springer, Berlin, 2008) p. 357.
- [4] J. Paglione and R. L. Greene: Nature Phys. 6 (2010) 645.
- [5] G. Knebel, D. Braithwaite, P. C. Canfield, G. Lapertot and J. Flouquet: Phys. Rev. B 65 (2001) 024425.
- [6] P. Monthoux and G. G. Lonzarich: Phys. Rev. B 63 (2001) 054529.
- [7] P. Monthoux and G. G. Lonzarich: Phys. Rev. B 66 (2002) 224504.
- [8] W. Bao, P. G. Pagliuso, J. L. Sarrao, J. D. Thompson, Z. Fisk and J. W. Lynn: Phys. Rev. B 64 (2001) 020401.
- [9] S. Raymond, E. Ressouche, G. Knebel, D. Aoki and J. Flouquet: J. Phys.: Condens. Matter 19 (2007) 242204.
- [10] G. Knebel, D. Aoki, J.-P. Brison, L. Howald, G. Lapertot, J. Panarin, S. Raymond and J. Flouquet: phys. stat. sol. B 247 (2010) 557.
- [11] M. Yashima, H. Mukuda, Y. Kitaoka, H. Shishido, R. Settai and Y. Onuki: Phys. Rev. B 79 (2009) 214528.
- [12] S. Kawasaki, T. Mito, Y. Kawasaki, G. q Zheng, Y. Kitaoka, D. Aoki, Y. Haga and Ōnuki: Phys. Rev. Lett. 91 (2003) 137001.
- [13] M. Yashima, S. Kawasaki, H. Mukuda, Y. Kitaoka, H. Shishido, R. Settai and Y. Ōnuki: Phys. Rev. B 76 (2007) 020509.
- [14] S. Raymond, G. Knebel, D. Aoki and J. Flouquet: Phys. Rev. B 77 (2008) 172502.
- [15] N. Aso, K. Ishii, H. Yoshizawa, T. Fujiwara, Y. Uwatoko, G.-F. Chen, N. K. Sato and K. Miyake: Journal of the Physical Society of Japan 78 (2009) 073703.
- [16] K. Miyake and O. Narikiyo: J. Phys. Soc. Jpn. 71 (2002) 867.
- [17] G. Knebel, D. Aoki, J.-P. Brison and J. Flouquet: Journal of the Physical Society of Japan 77 (2008) 114704.
- [18] V. A. Park, T. amd Sidorov, F. Ronning, J.-X. Zhu, Y. Tokiwa, H. Lee, E. D. Bauer, R. Movshovich, J. L. Sarrao and J. D. Thompson: Nature 456 (2008) 366.
- [19] T. Moriya: Rep. Prog. Phys. 66 (2003) 1299.
- [20] S. Watanabe and K. Miyake: arXiv: 1009.5757v1 .
- [21] C. Pépin: Physical Review B (Condensed Matter and Materials Physics) 77 245129.
- [22] H. Q. Yuan, F. M. Grosche, M. Deppe, C. Geibel, G. Sparn and F. Steglich: Science 302 (2003) 2104.
- [23] A. T. Holmes, D. Jaccard and K. Miyake: Phys. Rev. B 69 (2004) 024508.
- [24] A. Demuer, D. Jaccard, I. Sheikin, S. Raymond, B. Salce, J. Thomasson, D. Braithwaite and J. Flouquet: J. Phys.: Condens. Matter 13 (2001) 9335.
- [25] T. Park, M. J. Graf, L. Boulaevskii, J. L. Sarrao and J. D. Thompson: Proc. Natl. Acad. Sci. U.S.A. 105 (2008) 6825.
- [26] T. Takeuchi, T. Inoue, K. Sugiyama, D. Aoki, Y. Tokiwa, Y. H. K. Kindo and Y. Ōnuki: J. Phys. Soc. Jpn. 70 (2001) 877.
- [27] A. L. Cornelius, P. G. Pagliuso, M. F. Hundley and J. L. Sarrao: Phys. Rev. B 64 (2001) 144411.
- [28] G. Knebel, D. Aoki, D. Braithwaite, B. Salce and J. Flouquet: Phys. Rev. B 74 (2006) 020501(R).
- [29] T. Park, F. Ronning, H. Q. Yuan, M. B. Salamon, R. Movshovich, J. L. Sarrao and J. D. Thompson: Nature 440 (2006) 65.
- [30] Y. Zhang, E. Demler and S. Sachdev: Phys. Rev. B 66 (2002) 094501.
- [31] E. Demler, W. Hanke and S.-C. Zhang: Rev. Mod. Phys. 76 (2004) 909.
- [32] H. Shishido, R. Settai, H. Harima and Y. Ōnuki: J. Phys. Soc. Jpn. 74 (2005) 1103.
- [33] N. Harrison, U. Alver, R. G. Goodrich, I. Vekhter, J. L. Sarrao, P. G. Pagliuso, N. O. Moreno, L. Balicas, Z. Fisk, D. Hall, R. T. Macaluso and J. Y. Chan: Phys. Rev. Lett. 93 (2004) 186405.
- [34] G. Knebel, M. A. Measson, B. Salce, D. Aoki, D. Braithwaite, J. P. Brison and J. Flouquet: J. Phys.: Condens. Matter 16 (2004) 8905.
- [35] T. Park, E. D. Bauer and J. D. Thompson: Phys. Rev. Lett. 101 177002 (pages 4).
- [36] T. Mito, S. Kawasaki, G. q Zheng, Y. Kawasaki, K. Ishida, Y. Kitaoka, D. Aoki, Y. Haga and Ōnuki: Phys. Rev. B 63 (2001) 220507(R).
- [37] J. S. Kim, J. Alwood, D. Mixson, P. Watts and G. R. Stewart: Phys. Rev. B 66 (2002) 134418.
- [38] B. E. Light, R. S. Kumar, A. L. Cornelius, P. G. Pagliuso and J. L. Sarrao: Phys. Rev. B 69 (2004) 024419.
- [39] P. G. Pagliuso, R. Movshovich, A. D. Bianchi, M. Nicklas, N. O. Moreno, J. D. Thompson, M. F. Hundley, J. L. Sarrao and Z. Fisk: Physica B 312 (2002) 129.
- [40] V. S. Zapf, E. J. Freeman, E. D. Bauer, J. Petricka, C. Sirvent, N. A. Frederick, R. P. Dickey and M. B. Maple: Phys. Rev. B 65 (2001) 014506.
- [41] A. D. Christianson, A. Llobet, W. Bao, J. S. Gardner, I. P. Swainson, J. W. Lynn, J. M. Mignot, K. Prokes, P. G. Pagliuso, N. O. Moreno, J. L. Sarrao, J. D. Thompson and A. H. Lacerda: Phys. Rev. Lett. 95 (2005) 217002.
- [42] S. Ohira-Kawamura, H. Shishido, A. Yoshida, R. Okazaki, H. Kawano-Furukawa, T. Shibauchi, H. Harima and Y. Matsuda: Phys. Rev. B 76 (2007) 132507.
- [43] S. K. Goh, J. Paglione, M. Sutherland, E. C. T. O’Farrell, C. Bergemann, T. A. Sayles and M. B. Maple: Physical Review Letters 101 056402.
- [44] E. Bauer, D. Mixson, F. Ronning, N. Hur, R. Movshovich, J. Thompson, J. Sarrao, M. Hundley, P. Tobash and S. Bobev: Physics B 378-80 (2006) 142.
- [45] L. D. Pham, T. Park, S. Maquilon, J. D. Thompson and Z. Fisk: Phys. Rev. Lett. 97 (2006) 056404.
- [46] E. D. Bauer, F. Ronning, S. Maquilon, L. D. Pham, J. D. Thompson and Z. Fisk: Physica B 403 (2008) 1135.
- [47] R. R. Urbano, B.-L. Young, N. J. Curro, J. D. Thompson, L. D. Pham and Z. Fisk: Phys. Rev. Lett. 99 (2007) 146402.
- [48] E. D. Bauer, C. Capan, F. Ronning, R. Movshovich, J. D. Thompson and J. L. Sarrao: Phys. Rev. Lett. 94 (2005) 047001.
- [49] E. Ressouche: unpublished .
- [50] M. Daniel, E. D. Bauer, S.-W. Han, C. H. Booth, A. L. Cornelius, P. G. Pagliuso and J. L. Sarrao: Phys. Rev. Lett. 95 (2005) 016406.
- [51] W. Bao, G. Aeppli, J. W. Lynn, P. G. Pagliuso, J. L. Sarrao, M. F. Hundley, J. D. Thompson and Z. Fisk: Phys. Rev. B 65 (2002) 100505.
- [52] J. G. Donath, F. Steglich, E. D. Bauer, F. Ronning, J. L. Sarrao and P. Gegenwart: EPL (Europhysics Letters) 87 (2009).
- [53] P. Pedrazzini, M. Berisso, N. Caroca-Canales, M. Deppe, C. Geibel and J. Sereni: Eur. Phys. J. B 38 (2004) 445.
- [54] L. Mendonça Ferreira, T. Park, V. Sidorov, M. Nicklas, E. M. Bittar, R. Lora-Serrano, E. N. Hering, S. M. Ramos, M. B. Fontes, E. Baggio-Saitovich, H. Lee, J. L. Sarrao, J. D. Thompson and P. G. Pagliuso: Phys. Rev. Lett. 101 (2008) 017005.