An H search for over-dense regions at ††thanks: Based on observations obtained with the Wide Field CAMera (WFCAM) on the United Kingdom Infrared Telescope (UKIRT), and in part on data collected at Subaru Telescope, which is operated by the National Astronomical Observatory of Japan, and collected at the W.M. Keck Observatory, which is operated as a scientific partnership among the California Institute of Technology, the University of California and the National Aeronautics and Space Administration.
Abstract
We present the results of a narrow-band (H2S1, m, m) imaging search with WFCAM/UKIRT for H emitters around several potential signposts of rare ( 10-7–10-8 Mpc-3) over-dense regions at : an over-density of QSOs (2QZ cluster), a powerful, high-redshift radio galaxy (HzRG), and a concentration of submillimetre galaxies (SMGs) and optically faint radio galaxies (OFRGs). In total, we detect 137 narrow-band emitter candidates down to emission-line fluxes of 0.5–1 10-16 erg s-1 cm-2, across a total area of 0.56 sq. degrees (2.1 105 comoving Mpc at ) in these fields. The colours of the emitters suggest that at least 80% of our sample are likely to be H emitters (HAEs) at . This is one of the largest HAE samples known at . We find modest () local over-densities of emitters associated with all the three targets. In the 2QZ cluster field, the emitters show a striking filamentary structure connecting four of the QSOs extending over 30 Mpc (comoving). In the HzRG and SMG/OFRG fields, the structures appear to be smaller and seen only in the vicinities of the targets. The -band magnitudes and the H equivalent widths of the emitters are weakly correlated with the over-density of the emitters: emitters in over-dense region are more evolved systems compared to those in under-dense regions at . We find several examples of extended HAEs in our target fields, including a striking example with a spatial extent of 7.5 arcsec (60 kpc at ) in the 2QZ field, suggesting that these are relatively common in high-density regions. We conclude that narrow-band H surveys are efficient routes to map over-dense regions at high- and thus to understand the relation between the growth of galaxies and their surrounding large-scale structures.
keywords:
galaxies: formation – galaxies: evolution – galaxies: high-redshift – cosmology: observations – early Universe1 Introduction
Local galaxy clusters are characterised by populations of passive, early-type galaxies, whose properties contrast markedly with the star-forming, late-type galaxies found in the surrounding low-density field (e.g. Dressler, 1980). The main formation phase of the stars in elliptical galaxies in clusters appears to have occurred at high redshift (probably , e.g. Ellis et al., 1997; Blakeslee et al., 2003; Mei et al., 2009), in contrast to the field where most of the star-formation activity occurs at (e.g. Lilly et al., 1995; Thomas et al., 2005). Hence the evolution of galaxies in clusters appears to be accelerated relative to that in low-density regions (e.g. Steidel et al., 2005; Tanaka et al., 2010; Tadaki et al., 2010; Hatch et al., 2011). As a result, while the average star-formation rate (SFR) of a galaxy decreases with increasing local galaxy density in the low-redshift Universe (e.g. Lewis et al., 2002; Gómez et al., 2003), this trend should reverse at earlier times: with the SFR increasing with increasing galaxy density (Elbaz et al., 2007; Hayashi et al., 2010; Tran et al., 2010; Grützbauch et al., 2011). Hence the progenitors of massive clusters at high-redshifts (proto-clusters) should be identifiable as over-densities of star-forming galaxies (Steidel et al., 1998, 2005; Venemans et al., 2007; Matsuda et al., 2009, 2010). If the growth of the galaxies is synchronised with that of their super-massive black holes, then populations of active galactic nuclei should also be located in these proto-clusters (Smail et al., 2003; Lehmer et al., 2009; Digby-North et al., 2010).
To identify proto-clusters, the most representative, but time-consuming, technique is to find significant redshift over-densities in large spectroscopic redshift surveys of star-forming galaxies (Steidel et al., 1998, 2005; Chapman et al., 2009; Kurk et al., 2009). A quicker route is to perform such searches around luminous high-redshift sources, such as quasi-stellar objects (QSOs) or powerful high-redshift radio galaxies (HzRGs), where the expectation is that the massive black holes in these galaxies will be hosted by correspondingly massive galaxies which will signpost over-dense regions at high redshifts. An even more efficient technique is to forego spectroscopy and instead search for concentrations of emission-line galaxies in narrow-band imaging surveys of these regions (e.g. Hu & McMahon, 1996; Pascarelle et al., 1996; Keel et al., 1999; Kurk et al., 2000, 2004a, 2004b; Venemans et al., 2007; Kashikawa et al., 2007; Tanaka et al., 2010; Hatch et al., 2011).
For target QSOs or HzRGs at , Ly is redshifted into the optical and hence most of the narrow-band imaging surveys have targeted Ly emission. However, Ly is far from ideal as it is a resonance line and even a small amount of dust is enough to destroy the line, thus biasing searches against the dusty and perhaps most active galaxies in any structure. A better choice is to use H, which is less sensitive to dust and also a more accurate tracer of star formation (Kennicutt, 1998; Garn et al., 2010). However, for galaxies at , H is redshifted into the near-infrared, and it is only through the recent development of panoramic, near-infrared imagers that narrow-band searches based on H have become possible (Sobral et al., 2009a, b, 2010, 2011; Geach et al., 2008, hereafter G08).
We have exploited the wide-field, near-infrared imaging capabilities of WFCAM on UKIRT (Casali et al., 2007) to carry out an H imaging survey around several potential signposts of over-dense regions at 2.23. The paper is structured as follows: §2 describes our target selection, while §3 details our observations and data reduction and §4 describes the results derived from these data. Finally, §5 discusses our results and summarises our main conclusions. We use Vega magnitudes unless otherwise stated and adopt cosmological parameters, 0.27, 0.73 and 73 km s-1 Mpc-1. In this cosmology, the Universe at 2.23 is 2.9 Gyr old and 1.0 arcsec corresponds to a physical length of 8.1 kpc.
| Field | Target | Redshift | Magnitude | Ref.a |
|---|---|---|---|---|
| 2QZ cluster | 2QZ J100351.5+001501 | 2.217 | 1 | |
| 2QZ J100412.8+001257 | 2.240 | 1, 2 | ||
| 2QZ J100339.7+002109 | 2.241 | 1, 2 | ||
| 2QZ J100323.0+000725b | 2.235 | 1, 2 | ||
| 2QZ J100204.0+001643c | 2.245 | 1, 2 | ||
| 0200+015 | NVSS J020242+014910 | 2.229 | 3, 4, 5, 6 | |
| SSA 13 | SMM J131230.92+424051.0 | 2.247 | 7 | |
| SMM J131239.14+424155.7 | 2.242 | 7 | ||
| RG J131207.74+423945.0 | 2.228 | 8 | ||
| RG J131208.34+424144.4 | 2.234 | 8 | ||
| RG J131236.05+424044.1 | 2.224 | 8 |
a (1) Croom et al. (2004), (2) Shen et al. (2007) (3) Large et al. (1981), (4) Röttgering et al. (1997), (5) Condon et al. (1998), (6) Iwamuro et al. (2003), (7) Chapman et al. (2005), (8) Smail et al. (2004).
b This source is just outside of the WFCAM field of view.
c This source is outside of the WFCAM field of view.
2 Target field selection
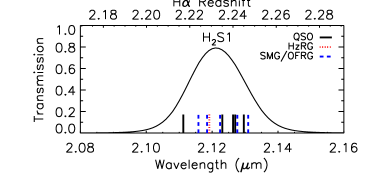
Our survey uses the H2S1 narrow-band filter on WFCAM to isolate H emitters at 2.23. We plot the transmission curve of the narrow-band filter (H2S1, m, m) in Figure 1. The redshift range of the H line corresponding to the 50% transmission wavelengths of the filter is –2.248 (equivalent to a comoving length of 43.1 Mpc along the line of sight). We therefore searched for targets which could be potential signposts of over-dense regions at using the NASA/IPAC Extragalactic Database (NED).111The NASA/IPAC Extragalactic Database (NED) is operated by the Jet Propulsion Laboratory, California Institute of Technology, under contract with the National Aeronautics and Space Administration. We selected three targets; an over-density of QSOs, a HzRG, and a concentration of submillimetre galaxies (SMGs) and optically faint radio galaxies (OFRGs). We summarise the targets in Table 1.
2.1 2QZ cluster
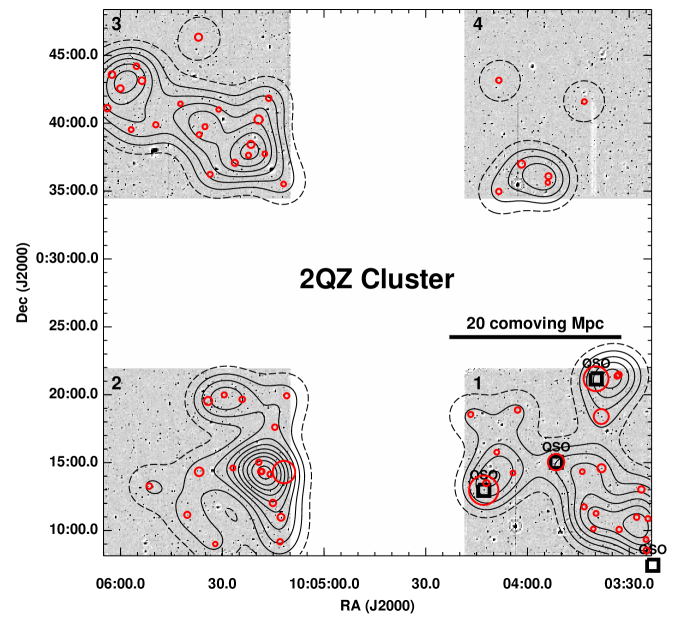
Our first target is a concentration of QSOs selected from the 2dF QSO redshift survey (2QZ, Croom et al., 2001). There now appears to be some consensus that on average, over-densities of galaxies are present around typical QSOs (both radio-loud and quiet) at (e.g. Ellingson, Yee, & Green, 1991; Hall & Green, 1998). However, using over-densities of QSOs should be a much clearer marker of structures at high redshift (Clowes & Campusano, 1991). We searched the whole equatorial region from the 2QZ survey for regions with more than four QSOs at 2.216–2.248 in a 1-degree diameter field. There are 285 QSOs at –2.248 in the 2QZ survey area of 289.6 deg2 (or comoving Mpc). We found only one structure satisfying the criteria in this volume indicating a volume density of any associated structure of 10-8 comoving Mpc-3. We refer to this target as the 2QZ cluster, it contains five QSOs at 2.217, 2.235, 2.240, 2.241 and 2.245 (see Figure 1 and Table 1).222Four of the 5 QSOs are also listed in the SDSS QSO catalog (Shen et al., 2007) Four out of the five QSOs are even more strongly clustered in a arcmin2 region, with three of these QSOs falling within the field of view of a single WFCAM chip, with the fourth located just outside the field of view.
2.2 0200+015
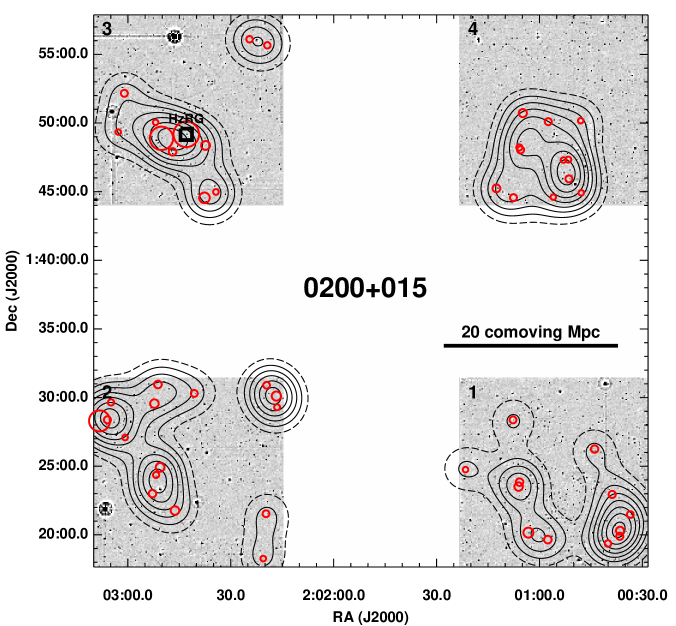
Our second target is a HzRG: MRC 0200+015. The number density of HzRGs at 2–5 is a few times Mpc-3 (Miley & De Breuck, 2007), and thus HzRGs are quite rare. There is growing evidence that a significant fraction of HzRGs reside in over-dense environments (Kurk et al., 2000; Pentericci et al., 2000; Stevens et al., 2003; Smail et al., 2003; Miley et al., 2004; Kajisawa et al., 2006; Kodama et al., 2007; Venemans et al., 2007; Tanaka et al., 2010; Hatch et al., 2011). However, Best et al. (2003) show that HzRG at 1.5–2 are found in a very wide range of environments, from essentially no over-density, through a small-scale central over-density to larger scale over-densities. Using NED, we identified a HzRG, MRC 0200+015 (or NVSS J020242+014910) at (hereafter 0200+015, Large et al., 1981; Röttgering et al., 1997; Condon et al., 1998). This HzRG field was observed using H imaging by van der Werf, Moorwood, & Bremer (2000). They imaged an area of just 6.37 arcmin2 down to a 3 flux limit of 1.0 10-16 erg s-1 cm-2 for H emitters in redshift range of 2.19–2.26. Although they detected the HzRG as an H emitter, they did not identify any additional H emitter candidates around the HzRG. A single WFCAM chip has a field of view times larger than the area surveyed by van der Werf, Moorwood, & Bremer (2000), giving us the first opportunity to conclusively search for a structure around this HzRG.
2.3 SSA 13
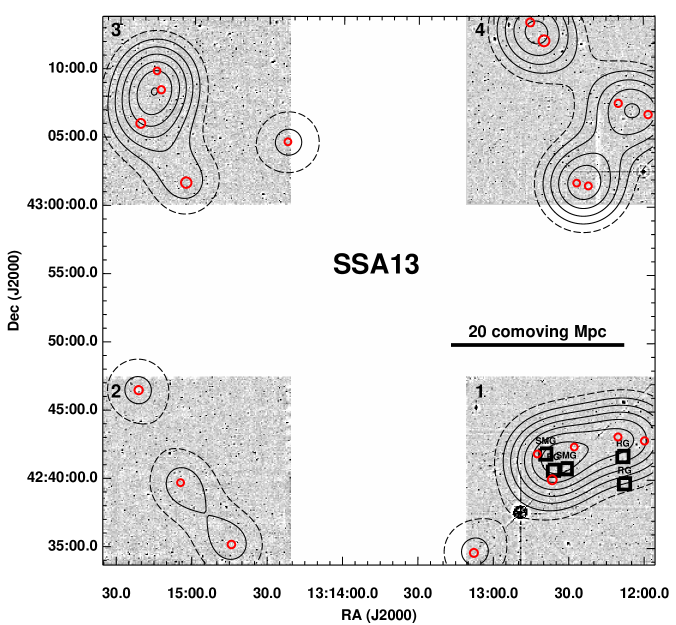
Our final target is a potential concentration of massive starburst galaxies. From redshift surveys of SMGs and OFRGs, a significant redshift spike was discovered at 2.224–2.247 ( 0.023) in the Small Selected Area 13 (SSA 13) field (Smail et al., 2004; Chapman et al., 2005). This spike contains two SMGs at 2.242, 2.247 and three OFRGs at 2.224, 2.228, and 2.234 (see Figure 1 and Table 1). This spike is one of the most prominent structures in their survey volume of a few times 106 comoving Mpc, suggesting a structure with a number density of a few times Mpc-3 (c.f. Chapman et al., 2009).
| Field | Coordinate (J2000) | Date | Filter | Chip | Exp time | Deptha | FWHM | Area | Number densityb |
|---|---|---|---|---|---|---|---|---|---|
| (h:m:s) (d:m:s) | (mm/yyyy) | (ks) | (mag) | (arcsec) | (arcmin2) | (arcmin-2) | |||
| 2QZ cluster | 10:03:51.0 +00:15:09 | 02/2010 | H2S1 | 1 | 34.44 | 19.9 | 0.9 | 169 | 8.1 (H2S119.9) |
| 10:05:37.2 +00:15:03 | 2 | 34.44 | 20.0 | 0.9 | 171 | 9.6 (H2S119.9) | |||
| 10:05:37.8 +00:41:22 | 3 | 34.44 | 19.9 | 0.9 | 172 | 10.1 (H2S119.9) | |||
| 10:03:51.5 +00:41:33 | 4 | 34.44 | 20.1 | 0.9 | 171 | 8.6 (H2S119.9) | |||
| 10:03:51.0 +00:15:09 | 02-03/2010 | 1 | 4.48 | 20.4 | 0.7 | 169 | 8.2 (19.9) | ||
| 10:05:37.2 +00:15:03 | 2 | 4.48 | 20.3 | 0.8 | 171 | 10.0 (19.9) | |||
| 10:05:37.8 +00:41:22 | 3 | 4.48 | 20.4 | 0.8 | 172 | 10.3 (19.9) | |||
| 10:03:51.5 +00:41:33 | 4 | 4.48 | 20.3 | 0.8 | 171 | 8.8 (19.9) | |||
| 0200+015 | 02:02:42.6 +01:50:54 | 10/2007 | H2S1 | 3 | 13.44 | 19.6 | 0.9 | 148 | 8.3 (H2S119.5) |
| 02:00:56.0 +01:24:38 | 1 | 13.44 | 19.6 | 1.0 | 172 | 8.1 (H2S119.5) | |||
| 02:02:42.2 +01:24:35 | 2 | 13.44 | 19.7 | 1.1 | 169 | 7.2 (H2S119.5) | |||
| 02:00:56.1 +01:51:02 | 4 | 13.44 | 19.5 | 1.0 | 174 | 6.5 (H2S119.5) | |||
| 02:02:42.6 +01:50:54 | 10/2007 | 3 | 1.335 | 20.1 | 1.0 | 148 | 8.0 (19.5) | ||
| 02:00:56.0 +01:24:38 | 1 | 1.23 | 20.1 | 1.1 | 172 | 8.0 (19.5) | |||
| 02:02:42.2 +01:24:35 | 2 | 1.25 | 20.1 | 1.0 | 169 | 7.4 (19.5) | |||
| 02:00:56.1 +01:51:02 | 4 | 1.365 | 20.0 | 1.2 | 174 | 6.5 (19.5) | |||
| SSA 13 | 13:12:34.1 +42:40:43 | 05/2006 | H2S1 | 1 | 14.76 | 19.0 | 0.9 | 146 | 4.2 (H2S119.0) |
| 13:14:58.5 +42:40:49 | 2 | 14.32 | 19.1 | 0.9 | 174 | 5.1 (H2S119.0) | |||
| 13:14:58.2 +43:07:03 | 3 | 14.56 | 19.1 | 0.9 | 174 | 4.9 (H2S119.0) | |||
| 13:12:33.2 +43:07:08 | 4 | 14.96 | 19.1 | 0.9 | 171 | 4.6 (H2S119.0) | |||
| 13:12:34.1 +42:40:43 | 05/2006 | 1 | 0.625 | 19.7 | 1.0 | 147 | 4.3 (19.0) | ||
| 13:14:58.5 +42:40:49 | 2 | 0.615 | 19.7 | 0.9 | 174 | 5.0 (19.0) | |||
| 13:14:58.2 +43:07:03 | 3 | 0.63 | 19.8 | 0.9 | 174 | 4.8 (19.0) | |||
| 13:12:33.2 +43:07:08 | 4 | 0.62 | 19.5 | 0.9 | 171 | 4.7 (19.0) |
aThe 5 limiting magnitude based on photometry with a 3-arcsec diameter aperture.
bThe number density of H2S1 detected sources.
3 Observations and Data Reduction
3.1 WFCAM Observations
The three target fields were observed between 2006 May and 2010 April with WFCAM on UKIRT, using the -band and H2S1 filters. We summarise the observations in Table 2. WFCAM has four arcmin2 chips offset by 20 arcmin (a comoving separation of 32 Mpc at ). For our observations we place the target on one of the chips (Chip 1 for the 2QZ cluster and SSA 13, Chip 3 for 0200+015), with the other three chips providing control fields to derive the mean density of emitters –60 Mpc (comoving) away from the target. To help with cosmic ray rejection over the relatively long narrow-band exposures (40–60 s), we used the NDR (Non Destructive Read) mode, whereas CDS (Correlated Double Sampling) mode was used for the shorter broad-band exposures. To improve sampling of the PSF with the 0.4 arcsec pixels of WFCAM, the narrow-band frames were microstepped in a grid with 1.2 arcsec offsets at each position, following a 14-point jitter sequence. The seeing in our observations varied between 0.7–1.2 arcsec FWHM.
The data reduction was carried out in the same manner as for the HiZELS survey (G08; Sobral et al., 2009a, b, 2010, 2011). We flatfield a given image using a normalised median combination of the 13 remaining frames from the same sequence, taking care to mask-out bright sources in each frame. A world coordinate system is then automatically fit to each frame by querying the USNO A2.0 catalogue, on average returning sources to derive the astrometric fit. Frames are aligned and co-added with swarp (Bertin et al., 2002). Both -band and H2S1 magnitudes were calibrated by matching 10–15 stars from the 2MASS All-Sky Catalogue of Point Sources (Cutri et al., 2003) which are unsaturated in our frames. The magnitudes were not corrected for Galactic extinction, because the extinction is negligible in these bands ( mag, Schlegel, Finkbeiner, & Davis, 1998).
The combined images were aligned and smoothed with Gaussian kernels to ensure that the final images in each field have the same seeing (FWHM = 0.9–1.2 arcsec). The size of each chip analyzed here is 13.2 13.2 arcmin2 after removal of low S/N regions near the edge. We also masked out halos and cross-talk residuals of the bright stars ( 15). The resultant total effective area of each chip is 150–170 arcmin2 (corresponding to a comoving volume of 1.6–1.8 104 Mpc3 for H emitters at in the H2S1 filter).
Source detection and photometry were performed using SExtractor version 2.5.0 (Bertin & Arnouts, 1996). The source detections were made on the H2S1 image. We detected sources with five connected pixels above 1.0–1.5 of the sky noise. Each WFCAM chip has four amplifiers, we added small ( 0.1 mag) shifts to the narrow-band zero point magnitudes to make the median colour zero for each region with the same amplifier in each chip. The magnitudes and colours are measured for each source in a 3 arcsec diameter aperture. In Table 2, we give the number densities of H2S1 detected sources down to the 5 limit in each field. We confirmed that these are consistent with -band number counts of galaxies in UKIDSS/DXS by Kim et al. (2011). The number densities in each chip in each field agree within 12%, and the variations are also consistent with those seen in the UKIDSS/DXS data (Jae-Woo Kim, private communication). The agreement suggest that our photometric calibration is reliable for each field.
3.2 Supporting Observations
3.2.1 SCAM Observations
To check contamination in our emitter sample from foreground and background line emitters, we obtained and -band images of the target fields with Subaru/Suprime-Cam (Miyazaki et al., 2002). We observed the 2QZ cluster field in 2009 November and the 0200+015 field in 2010 November. For the SSA 13 field, we used archival data. All the images were a single pointing of Suprime-Cam, covering only one chip of the WFCAM observations. The exposure times were 0.9–3.0 ks for the -band and 0.9–1.8 ks for -band, respectively. The data were reduced using sdfred (Yagi et al., 2002; Ouchi et al., 2004). For photometric calibration, we used the photometric standard stars in SA 101 field (Landolt, 1992; Smith et al., 2002) and SDSS -band images for the 2QZ cluster and SSA 13 fields. We corrected the magnitudes using the Galactic extinction map of Schlegel, Finkbeiner, & Davis (1998). The seeing of the stacked images are 0.9–1.2 arcsec for -band and 0.6–0.8 arcsec for -band, respectively. The 1 limiting AB magnitudes derived with 3 arcsec diameter aperture photometry are 27.0–27.6 ABmag for -band and 25.6–26.0 ABmag for -band, respectively.
3.2.2 MOIRCS Observations
The 0200+015 field was also observed with the -band and H2S1 filters using Subaru/MOIRCS (Suzuki et al., 2008) in 2007 August as part of engineering tests (performed by IT). The H2S1 filter on MOIRCS has 2.116m and 0.021m. The H redshift range covered with the H2S1 filter is 2.208–2.240, which is only 0.008 smaller than that covered with the H2S1 filter on WFCAM. As one of the two chips had problems, we used only one chip. The exposure times were 1.17 ks for -band and 1.44 ks for , respectively. We reduced the data using the MOIRCS imaging data reduction pipeline (mcsred, Tanaka et al., 2010). For photometric calibration, we used the 2MASS All-Sky Catalogue of Point Sources (Cutri et al., 2003). The seeing of the stacked images are 0.48 arcsec for -band and 0.42 arcsec for . The survey area is 12.4 arcmin2 after masking low S/N regions. The 1 limiting magnitudes calculated with a 0.84 arcsec diameter aperture are 22.3 mag for -band and 21.0 mag for H2S1. The deeper, higher resolution images can be used as a test of the completeness of our WFCAM observations and to examine the H morphology in the central 4 3.5 arcmin2 part of the 0200+015 field. These data will be discussed these further in I. Tanaka et al. (in preparation).
3.2.3 LRIS Observations
In addition, we carried out a long-slit spectroscopic observation of a bright emitter candidate in the 0200+015 field with Keck/LRIS (Oke et al., 1995) in 2010 September. As the red-side CCD had problems, we used only the blue arm. We used the 400/3400 grism and a 1.0 arcsec slit, yielding spectral coverage across 3500–5700 Å, at a spectral resolution of FWHM 7 Å or 600 km s-1. The exposure time was 0.9 ks and we reduced the data with standard iraf tasks. For wavelength calibration, we used arc lamp spectra with Hg, Cd, and Zn lines, giving a wavelength calibration with an rms 0.6 Å. We also confirmed that there is no overall shift ( 0.2 Å) for the wavelength calibration using the strong [Oi] sky emission at 5577.3 Å.
| Field | Chip | N | n | |
|---|---|---|---|---|
| (arcmin-2) | ||||
| 2QZ cluster | 1 | 22 | ||
| Control | 2,3,4 | 44 | ||
| 2 | 18 | |||
| 3 | 20 | |||
| 4 | 6 | |||
| 0200+015 | 3 | 11 | ||
| Control | 1,2,4 | 40 | ||
| 1 | 12 | |||
| 2 | 16 | |||
| 4 | 12 | |||
| SSA 13 | 1 | 6 | ||
| Control | 2,3,4 | 14 | ||
| 2 | 3 | |||
| 3 | 5 | |||
| 4 | 6 |
a , where is the mean density of emitter candidates derived from the three chips surrounding each target field.
4 Analysis and Results
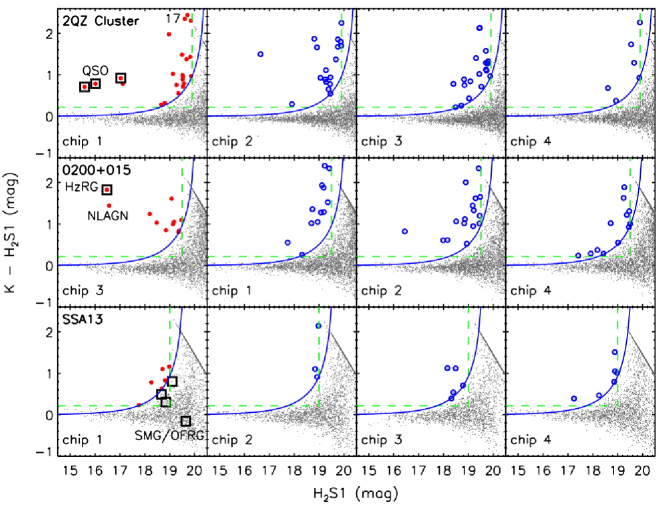
We show in Figure 2 the colour–magnitude plots for the -detected sample. From the -detected sources with 5 in each field, we select emitter candidates with the following criteria:
-
(1).
0.215 (EW 50 Å),
-
(2).
2.5,
where is the ratio between the H2S1 excess and the uncertainty in the colour based on photometric errors of both and H2S1 for sources with a constant spectra. These criteria are the same as used in G08. One slight difference from G08 is that we don’t correct the -band magnitudes using the colour for the emitter selection, because we don’t have -band images in our control fields. As we show below, this does not appear to adversely effect the purity of our narrow-band excess sample. We note that in each field, the limiting magnitudes between the chips are slightly different and so we use the shallowest 5 limits and significance curves for the colour cut for both the targets and the surrounding control fields to ensure a fair comparison of the number density in each field. The colour cuts correspond to flux limits of 0.5, 0.7 and 1.0 10-16 erg s-1 cm-2 for the 2QZ cluster, 0200+015 and SSA 13 fields respectively.
In total we detect 137 emitter candidates over a combined area of 0.56 sq. degrees (2.1 105 comoving Mpc3 at 2.23) in the three fields. A flux limit of 0.5 10-16 erg s-1 cm-2 corresponds to a star-formation rate (attenuation-uncorrected) of SFR 14 M⊙ yr-1 using the calibration of Kennicutt (1998) or SFR 70 M⊙ yr-1 (attenuation-corrected) using the reddening estimates from Garn et al. (2010). We listed the resulting catalogue of emitter candidates in the tables in Appendix A.
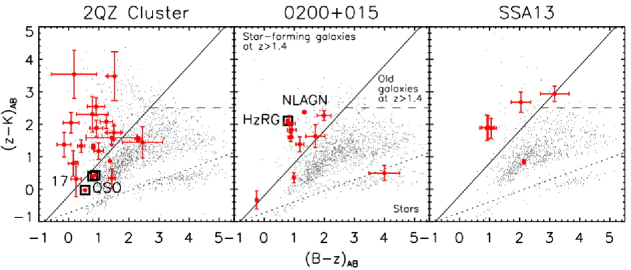
We have used the Suprime-Cam optical imaging to investigate the contamination from potential foreground and background line emitters (e.g., Pa emitters at 0.13, Pa emitters at 0.65 and [Oiii]5007 emitters at 3.24). We show in Figure 3 the and colour-colour plot for emitter candidates in the target fields. This colour-colour plane allows us to isolate 1.4–2.5 galaxies (Daddi et al., 2004), which are likely to be H emitters (HAEs), from any foreground or background contamination (see G08). Although the criteria, 0.2 or 2.5, were determined using a filter set from different instruments, it has been confirmed that the same criteria can also be used for Suprime-Cam and , and WFCAM -bands to select 1.4–2.5 galaxies (e.g. Hayashi et al., 2009). We find that 80% of the emitter candidates satisfy the criteria, indicating that these are likely to be 2.23 HAEs. Note that the three QSOs in the 2QZ cluster field are slightly outside the colour-selection region ( 0.0–0.2 mag), even though they are spectroscopically confirmed at 2.23. As the analysis was designed for galaxies, and not for AGNs, this it is perhaps not that surprising.
The apparent contamination rate in our candidate emitter sample, % is similar to the % rates in other H emitter surveys for protoclusters (Tanaka et al., 2010; Hatch et al., 2011). Although our contamination rate seems to be lower than the % rates in other H emitter surveys in blank fields (G08; Hayes, Schaerer, Östlin, 2010; Hatch et al., 2011), it is similar to the % rate for the sub-sample of Hayes, Schaerer, Östlin (2010)’s emitters with the similar flux range to our sample. As we show below, the resulting H luminosity functions of our emitters (in both target and control fields) and G08’s HAEs are consistent, supporting the low contamination in our HAE sample. We note that for the following comparison of the number density between the target and control fields, we have to use the full sample of emitter candidates (i.e., before applying the criteria) because we lack optical images in our control fields. However, due to our low contamination rate this only slightly affect the significance of the over-densities we find in these fields.
In Table 3, we summarise the number, number density, and over-density of the emitter candidates in each field. We derive the mean emitter densities using the surrounding control fields for each target field. Our analysis of the number densities suggests that there is no significant excess of emitters in any of the three target fields on the scale of the WFCAM chips (22 comoving Mpc at 2.23). Note that in the 2QZ cluster field, the number of emitter candidates on chip 4 appears to be lower than on the other chips. However, we have confirmed that across all fields the total number of all H2S1-detected sources (not just those showing excess emission in the H2S1 filter) on chip 4 is not different with those in the other chips, as shown in Table 2. Thus, the lower numbers of the emitter candidates on chip 4 in the 2QZ cluster field are likely to be real (i.e., a void of emitters).
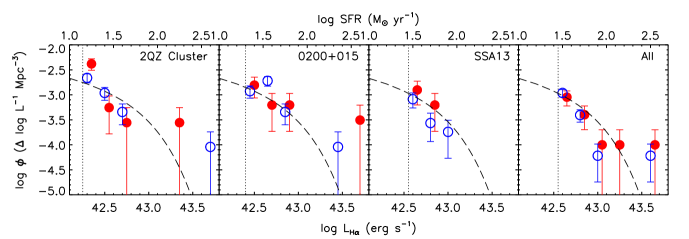
We compare the H luminosity functions (LF) of the emitter candidates in the target and control fields in Figure 4. All the LFs appear to be consistent with the blank field LF of 2.23 HAEs from G08. We could not find any clear difference between the shapes of LFs in the target and control fields. In this comparison, we have excluded the three QSOs and HzRG from our emitter sample.
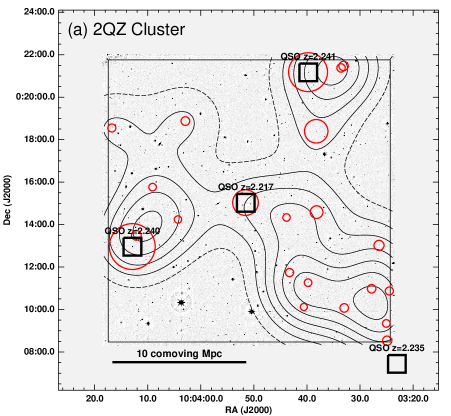
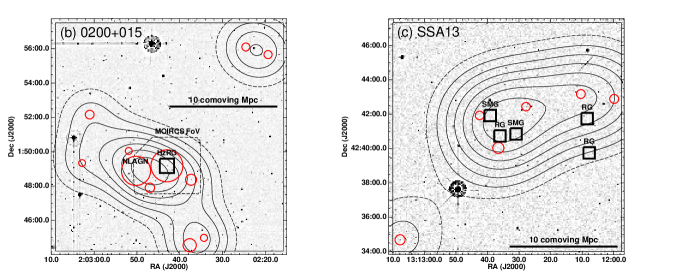
To search for over-densities on scales smaller than the chip field-of-view, we show in Figure 5 the sky distribution and smoothed density map of emitter candidates in the target fields. The surface density maps are generated with a gaussian smoothing kernel with a size chosen to match the median distance between the nearest-neighbour emitters in the control fields, 1.4 arcmin for the 2QZ cluster and 0200+015, and 2.3 arcmin for SSA 13. In these maps, we can see modest over-densities ( 3 deviations from the average densities) of emitters within all three target fields. In the 2QZ cluster field, the emitters appear to have a filamentary structure connecting the four QSOs, while in the HzRG and SMG/OFRG fields, the structures appear to be smaller and only seen in the vicinities of the targets. We discuss these structures below, but we first note that the estimated significance of these over-densities may be conservative, because the potential contamination will be unclustered and so should slightly decrease the significance of any real over-densities, although again we stress that the contamination rate in our emitter sample is expected to be quite low ( 20%) so this should not be a large effect.
2QZ cluster: As can be seen in Figure 5, the over-density in the 2QZ cluster field comprises an apparently filamentary structure connecting at least three of the QSOs at 2.23, as well as an extension of the structure towards the QSO just outside of the field of view to the south west. The three target QSOs lie in weak over-dense regions ( 0–1) rather than the local density peaks. The structure around the QSOs contains a 2.9 density peak from the average density derived in the control field, and it is the second highest peak in the full density map of the 2QZ cluster and the surrounding three control fields (see Figure B1 in Appendix). The local emitter density of this peak is 3.7 times higher than the average density. The highest density peak is located in the west edge of the chip 2. There is a very bright, point-source emitter near to this density peak. This bright emitter may be another luminous AGN at 2.23 as the emission-line luminosity is similar to the target QSOs.333 If there is a galaxy over-density around the QSOs, a signature might appear as associated absorption lines in the spectrum of background QSOs (e.g. Young, Sargent, & Boksenberg, 1982; Chen, Lanzetta, & Webb, 2001; Wilman et al., 2007; Crighton et al., 2010). There is one background SDSS QSOs at 3.045 behind this structure (Shen et al., 2007). However, we could not see any clear Ly absorption-line nor Civ absorption between 2.216–2.245 in its spectrum.
0200+015: There is a local over-density of emitters in the vicinity of the HzRG, with a 3.0 deviation from the average density. The local emitter density of this peak is 3.3 times higher than the average density. This is one of the highest density peaks in the 0200+015 and the surrounding control fields (see Figure B2). We confirmed that all of the five emitter candidates in this over-density satisfy the criteria indicating that they are highly likely to be HAEs at 2.23. Four out of the five HAEs in the over-density, including the HzRG, are also observed with our independent MOIRCS data and selected as narrow-band excess sources, supporting the reliability of our sample selection (see Figure 5 and Figure 9). Finally, we obtained optical spectroscopy of the 0200+015-C3-HAE2 using LRIS on Keck, the second brightest HAE in the 0200+015 field. The 0200+015-C3-HAE2 is a member of the over-density and 1.8 arcmin (900 kpc at 2.23 in projection) away from the HzRG. The spectrum confirms that this galaxy is at 2.235. We present the spectrum of this source in Figure 6, which shows strong Ly, Civ 1549 and Heii 1640 emissions lines with velocity widths of FWHM 1000 km s-1, suggesting that this HAE is in fact a narrow-line AGN (NLAGN) and further confirms that our emitter selection works well to identify H emitter at 2.23.
SSA 13: We also find a hint for a local over-density of emitters in the SSA 13 field. The local over-density in the vicinity of the SMG/OFRG concentration and has a 2.9 deviation from the average density. The local emitter density of this peak is 2.7 times higher than the average density. This is the highest density peak in the SSA 13 and surrounding control fields (see Figure B3). All the SMGs and OFRGs are detected in -band and their -band magnitudes are consistent with the previous results from Smail et al. (2004). However, none of them are selected as emitter candidates, although we detect four out of the five SMGs or OFRGs in our H2S1 image (see Figure 2). This may be due to the relatively shallow depth of the H2S1 image in SSA 13 (Table 2). For two of the OFRGs in this field the observed H equivalent widths have been spectroscopically measured to be 65Å and 80Å (Swinbank et al., 2004). However, a source with 19 needs to exhibit a narrow-band excess of 1 or EW 400Å to comply with our emitter selection criteria. The H of the undetected SMG at 2.247 falls near the edge of the H2S1 transmission curve (see Figure 1).

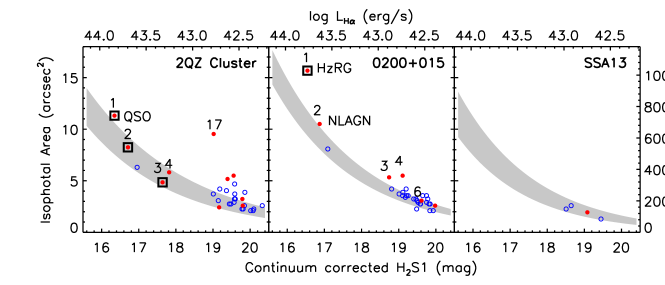
We examine the emission-line morphology of the emitter candidates with 4 (Figure 7). The magnitudes and isophotal areas are measured in the continuum corrected H2S1 images with isophotes determined with 2 surface brightness thresholds of 1.0, 1.4 and 2.3 10-17 erg s-1 cm-2 arcsec-2 for the 2QZ cluster, 0200+015 and SSA 13 fields respectively. While the isophotal areas of most of the emitter candidates are similar to, or somewhat larger than, the sequence of the point sources, several emitters in the 2QZ cluster and 0200+015 fields show significantly larger isophotal areas than expected for point sources.
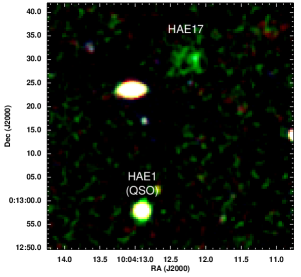
The giant HAE candidate in the 2QZ field is HAE17, referred to as 2QZC-C1-HAE17 in Table A1, and this has a spatial extent of arcsec (60 kpc at ) in our narrow-band image. This HAE is only 34 arcsec ( kpc) from the brightest target QSO (HAE1) in this region (see Figure 8) and the continuum source associated with HAE17 satisfies the criteria, suggesting that this is likely to be an H emission-line nebula at 2.23. The emission-line nebula has a continuum-corrected H2S1 magnitude of 19.0 mag in an isophotal aperture with an area of 9.4 arcsec2, corresponding to an emission-line flux of 1.7 10-16 erg s-1 cm-2 or an H luminosity of 6 1042 erg s-1. There is no evidence for an optically bright AGN in HAE17 as the continuum source is spatially resolved in the and -band images and in addition the HAE does not have any bright radio source with mJy in the VLA FIRST catalog (Becker, White, & Helfand, 1995), suggesting that it is not similar to the extended emission-line nebulae often seen around powerful radio galaxies (e.g. McCarthy, 1993), such as MRC 0200+015 (Figure 9). Unfortunately there is no deep X-ray data in this field necessary to further constrain the presence of an obscured AGN in this nebula.
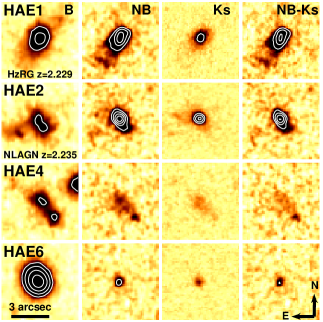
As shown by Figure 7 there are several potentially resolved emitters in the 0200+015 field: the HzRG and the NLAGN, 0200+015-C3-HAE2, as well as 0200+015-C3-HAE4. All show evidence of having larger isophotal areas than expected for point sources with their narrow-band magnitudes. To investigate the morphologies of these HAEs we can make use of the high-quality imaging from MOIRCS in this field. In Figure 9 we show thumbnails of the three resolved HAEs from MOIRCS, as well as a fourth more compact HAE which falls in the image: 0200+015-C3-HAE6. This figure clearly demonstrates the presence of bright H emission-line nebulae around the HzRG and the NLAGN, 0200+015-C3-HAE2, with spatial extents of 4–5 arcsec corresponding to –40 kpc at 2.23, while 0200+015-C3-HAE4 also exhibits fainter but similarly extended emission-line nebulosity. The -band morphology of HAE4 also seems extended on 3 arcsec or 30 kpc scales, with the H emission-line peaking on the outer edge of the -band structure. These properties of the HAE4 may resemble to galaxies with large disks at (Labbé et al., 2003). These extended HAEs, along with HAE17 in the 2QZ field, are obviously relatively common and indicate that star formation is occuring over large regions, comparable to the size of massive galaxies at the present day, even at 2.23. Current surveys of the HAEs in lower density regions at this epoch have turned up few such examples (e.g. Figure 7 and G08) and so it is possible that these extended emission-line nebulae are an environmental signature, as has been found for giant Ly nebulae (Ly blobs, e.g. Steidel et al., 2000; Palunas et al., 2004; Matsuda et al., 2004, 2009; Yang et al., 2010).
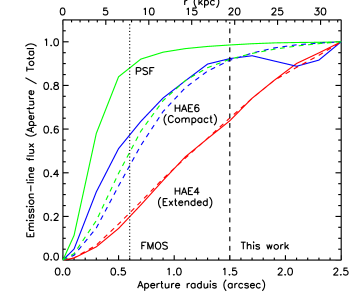
We can also use the MOIRCS imaging to determine the efficiency of fibre spectrograph surveys of HAEs using instruments such as FMOS on Subaru (Kimura et al., 2010). In Figure 10, we therefore show the growth curves of the emission-line fluxes from two examples of extended and compact HAEs (0200+015-C3-HAE4 and HAE6) as a function of photometric aperture using the MOIRCS continuum corrected H2S1 image. For comparison, we also plot a point spread function (PSF) using a bright star in the MOIRCS H2S1 image. This result suggests that the 10–40% of the total fluxes are missing in the 3 arcsec diameter aperture used in this work, while 40–80% could be missed if we measured the flux in a 1.2 arcsec diameter aperture fibre similar to Subaru/FMOS. This suggests that care must be taken to assess the fibre losses for such spectroscopic surveys, even of high-redshift galaxies, as a fraction of the targets may exhibit highly extended emission. However, as Figure 10 demonstrates, in these cases aperture corrections using rest-frame UV continuum images could be employed to correct these losses and should all the recovery of 80–100% of the total fluxes.
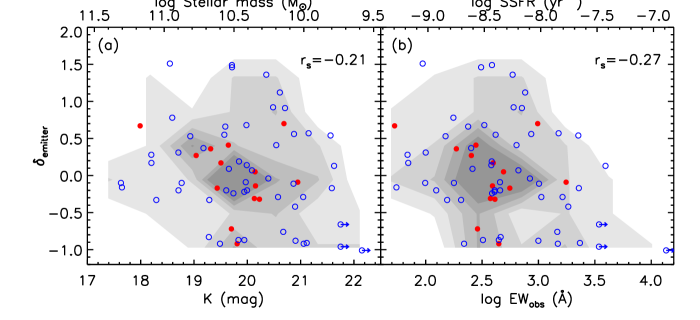
Finally, in Figure 11 we plot the observed -band magnitudes and equivalent widths of the emitters as a function of the emitter local over-densities (the local densities around each emitters are calculated excluding the source itself). In order to select an homogeneous emitter sample from the three fields, given their different depths, we exclude emitter candidates in the 2QZ cluster and 0200+015 fields below the detection limit in the SSA 13 field ( 1 10-16 erg s-1 cm-2). From this combined sample, we also exclude potential AGNs with emission-line fluxes similar to those of target QSOs and HzRG ( erg s-1 cm-2), this then means we can crudely relate the -band magnitude to a measure of the stellar mass of the galaxies, assuming that all the HAEs have roughly comparable mass-to-light ratios. We therefore use the relation estimated from G08, M0.4 18.45, to convert our -band magnitudes into stellar masses. In a similar manner, as the H luminosity is a good indicator of star-formation rate (Kennicutt, 1998), we can use our H equivalent width for the HAEs to estimate their specific star formation rate (SSFR). We show both of these inferred properties in Figure 11. We see that both the -band magnitudes and equivalent widths (or stellar mass and SSFR) of the resulting sample show weak correlations with the local over-density. The Spearman’s rank correlation coefficients are 0.21 (-band magnitude), and 0.27 (equivalent width), respectively, indicating that the sample distributions are consistent with random distributions at 8% (-band magnitude) and 3% (equivalent width) confidence levels. Thus our observations suggest there is weak evidence that the emitters in over-dense region tend to have smaller SSFR compared to those in under-dense environments, potentially indicating accelerated evolution in the build-up of galaxies in dense regions at 2.23 (cf. Steidel et al., 2005; Tanaka et al., 2010; Hatch et al., 2011).
5 Discussion and Conclusions
We have undertaken a narrow-band imaging survey of three target fields which contain potential signpost of rare over-dense regions with space densities of 10-7–10-8 Mpc-3 and local control fields to assess the significance of any over-densities. Our survey detects 137 emitter candidates in a volume of 2.1 105 comoving Mpc3 at 2.23 down to limiting H fluxes of 0.5–1 erg s-1 cm-2 (equivalent to attenuation un-corrected SFR of 14–28 M⊙ yr-1 or a dust-corrected SFR of 70–190 M⊙ yr-1). This is one of the largest HAE samples currently available at 2. Based on supporting optical imaging of these fields, we estimate that at least 80% of these narrow-band excess sources likely correspond to HAEs at 2.23. We have confirmed the reliability of our sample selection in one field, 0200+015, by using independent H2S1 observations from MOIRCS/Subaru, recovering all four HAEs selected in the overlap area from our WFCAM imaging, and also spectroscopically confirmed that one of the bright emitters in this field is an H source at 2.235.
Wide-field narrow-band H survey is one of the most effective routes to map over-dense regions of star-forming galaxies at high redshift. Our analysis of the density distribution of emitters in our survey, using statistical corrections for the blank-field density (including any potential foreground or background contamination) derived from the parallel control fields, indicates the presence of 3 local over-densities in all three of our target fields. In the 2QZ cluster field the over-dense regions of emitters displays a filamentary structure connecting the four target QSOs. This is similar to the large-scale filamentary structure of Ly emitters found around the SSA22 protocluster (Steidel et al., 1998; Hayashino et al., 2004; Matsuda et al., 2005). Although the over-densities in the vicinities of the QSOs are small ( 0–1), there is the density peak with 3 surrounded by these QSOs. These properties may be similar to the large-scale structure found around another QSO cluster at 1.1 (Tanaka et al., 2000, 2001). In the HzRG and SMG/OFRG fields, there are smaller-scale over-dense regions in the vicinities of the targets,with peak over-densities of 2. These structures are comparable, if slightly smaller, than those found in other H surveys for proto-clusters around HzRGs at 2 (e.g. Kurk et al., 2004a; Tanaka et al., 2010; Hatch et al., 2011). In part this may reflect the fact that our survey is 5–10 times wider but 5–10 times shallower than these surveys. It is therefore possible that the structures found in this survey are just the tips of more significant, underlying proto-clusters. Future deeper H2S1 imaging observations will more accurately reveal the true over-densities of these structures.
Narrow-band H survey is also useful to understand the relation between the growth of galaxies and their surrounding large-scale structures. We could not find any clear difference between the H luminosity functions in the target and control (or blank) fields. However, analysing our sample of emitters and their environments, we find that their -band magnitudes and equivalent widths (crudely corresponding to stellar mass and specific star-formation rate) show weak correlations with the local over-densities of the emitters. These results hint at the possibility that the emitters in over-dense region may be more evolved systems compared to those in under-dense regions. This would be consistent with the picture that star-formation activity is accelerated (or enhanced) in galaxies in over-dense regions at 2. Similar results have also been reported from the previous studies of proto-clusters at (Steidel et al., 2005; Tanaka et al., 2010; Hatch et al., 2011).
Deep narrow-band imaging also enables us to examine the H morphology of emitters, which provides us with information on star-formation activity in high-redshift galaxies during their formation phase and/or on their surrounding circum galactic medium. In the 0200+015 field, our deeper, higher-resolution MOIRCS narrow-band imaging confirms that the H emission from three HAEs (including both the HzRG and the newly discovered narrow-line AGN) is significantly extended on scales of 25–40 kpc. We find several examples of such extended HAEs in our target fields, including a striking example in the 2QZ field, suggesting that these are relatively common in high-density regions, with no clear examples in our control field or reported in the field survey of G08. The spatial extent of these systems, 30–60 kpc, suggests that star formation at 2.23 is occuring over regions in these galaxies comparable to the size of the largest galaxies at the present day or large-scale gas outflows are interacting with the surrounding circum galactic medium in overdense environments. Looking at the H luminosity of the most extended example, 6 1042 erg s-1 for HAE17 in the 2QZ field, if we assume Ly/H (case B and no dust extinction, e.g. McCarthy, Elston, & Eisenhardt, 1992), then its Ly luminosity is expected to be 5 1043 erg s-1, which would make its spatial extent and Ly luminosity comparable to those of giant Ly blobs (Matsuda et al., 2011). However, we need spectroscopic follow-up or deeper H imaging to confirm that this extended emission-line nebula is real and is the first H blob. More generally, future higher resolution H imaging and integral field spectroscopic observations are essential to investigate the star-formation activiy and gas dynamics and metallicity of the inter-stellar medium in these spatially-extended emitters to constrain their role in galaxy formation.
Acknowledgments
We thank Alastair Edge, Masayuki Akiyama, Tomoki Hayashino and Scott Chapman for useful discussions. We also thank Jae-Woo Kim for providing their UKIDSS/DXS catalog. YM and IRS acknowledge support from STFC. JEG is supported by NSERC. Some of the data reported here were obtained as part of the UKIRT Service Programme. UKIRT is funded by the STFC. The W. M. Keck Observatory was made possible by the generous financial support of the W. M. Keck Foundation. The authors wish to recognize and acknowledge the very significant cultural role and reverence that the summit of Mauna Kea has always had within the indigenous Hawaiian community. We are most fortunate to have the opportunity to conduct observations from this mountain.
References
- Becker, White, & Helfand (1995) Becker R. H., White R. L., Helfand D. J., 1995, ApJ, 450, 559
- Bertin & Arnouts (1996) Bertin, E., & Arnouts, S. 1996, A&A, 117, 393
- Bertin et al. (2002) Bertin E., Mellier Y., Radovich M., Missonnier G., Didelon P., Morin B., 2002, ASPC, 281, 228
- Best et al. (2003) Best P. N., Lehnert M. D., Miley G. K., Röttgering H. J. A., 2003, MNRAS, 343, 1
- Blakeslee et al. (2003) Blakeslee J. P., et al., 2003, ApJ, 596, L143
- Casali et al. (2007) Casali M., et al., 2007, A&A, 467, 777
- Chapman et al. (2005) Chapman S. C., Blain A. W., Smail I., Ivison R. J., 2005, ApJ, 622, 772
- Chapman et al. (2009) Chapman S. C., Blain A., Ibata R., Ivison R. J., Smail I., Morrison G., 2009, ApJ, 691, 560
- Chen, Lanzetta, & Webb (2001) Chen H.-W., Lanzetta K. M., Webb J. K., 2001, ApJ, 556, 158
- Clowes & Campusano (1991) Clowes R. G., Campusano L. E., 1991, MNRAS, 249, 218
- Condon et al. (1998) Condon J. J., Cotton W. D., Greisen E. W., Yin Q. F., Perley R. A., Taylor G. B., Broderick J. J., 1998, AJ, 115, 1693
- Crighton et al. (2010) Crighton N. H. M., et al., 2010, arXiv, arXiv:1006.4385
- Croom et al. (2001) Croom S. M., Smith R. J., Boyle B. J., Shanks T., Loaring N. S., Miller L., Lewis I. J., 2001, MNRAS, 322, L29
- Croom et al. (2004) Croom S. M., Smith R. J., Boyle B. J., Shanks T., Miller L., Outram P. J., Loaring N. S., 2004, MNRAS, 349, 1397
- Cutri et al. (2003) Cutri R. M., et al., 2003, 2MASS All Sky Catalog of point sources, The IRSA 2MASS All-Sky Point Source Catalog, NASA/IPAC Infrared Science Archive. http://irsa.ipac.caltech.edu/applications/Gator/
- Daddi et al. (2004) Daddi E., Cimatti A., Renzini A., Fontana A., Mignoli M., Pozzetti L., Tozzi P., Zamorani G., 2004, ApJ, 617, 746
- Digby-North et al. (2010) Digby-North J. A., et al., 2010, MNRAS, 407, 846
- Dressler (1980) Dressler A., 1980, ApJ, 236, 351
- Elbaz et al. (2007) Elbaz D., et al., 2007, A&A, 468, 33
- Ellingson, Yee, & Green (1991) Ellingson E., Yee H. K. C., Green R. F., 1991, ApJ, 371, 49
- Ellis et al. (1997) Ellis R. S., Smail I., Dressler A., Couch W. J., Oemler A., Jr., Butcher H., Sharples R. M., 1997, ApJ, 483, 582
- Garn et al. (2010) Garn T., et al., 2010, MNRAS, 402, 2017
- Geach et al. (2008) Geach J. E., Smail I., Best P. N., Kurk J., Casali M., Ivison R. J., Coppin K., 2008, MNRAS, 388, 1473 (G08)
- Grützbauch et al. (2011) Grützbauch R., Chuter R. W., Conselice C. J., Bauer A. E., Bluck A. F. L., Buitrago F., Mortlock A., 2011, MNRAS, 47
- Gómez et al. (2003) Gómez P. L., et al., 2003, ApJ, 584, 210
- Hall & Green (1998) Hall P. B., Green R. F., 1998, ApJ, 507, 558
- Hatch et al. (2011) Hatch N. A., Kurk J. D., Pentericci L., Venemans B. P., Kuiper E., Miley G. K., Röttgering H. J. A., 2011, arXiv, arXiv:1103.4364
- Hayashi et al. (2009) Hayashi M., et al., 2009, ApJ, 691, 140
- Hayashi et al. (2010) Hayashi M., Kodama T., Koyama Y., Tanaka I., Shimasaku K., Okamura S., 2010, MNRAS, 402, 1980
- Hayashino et al. (2004) Hayashino T., et al., 2004, AJ, 128, 2073
- Hayes, Schaerer, Östlin (2010) Hayes M., Schaerer D., Östlin G., 2010, A&A, 509, L5
- Hu & McMahon (1996) Hu E. M., McMahon R. G., 1996, Natur, 382, 231
- Iwamuro et al. (2003) Iwamuro F., et al., 2003, ApJ, 598, 178
- Kajisawa et al. (2006) Kajisawa M., Kodama T., Tanaka I., Yamada T., Bower R., 2006, MNRAS, 371, 577
- Keel et al. (1999) Keel W. C., Cohen S. H., Windhorst R. A., Waddington I., 1999, AJ, 118, 2547
- Kennicutt (1998) Kennicutt R. C., Jr., 1998, ARA&A, 36, 189
- Kashikawa et al. (2007) Kashikawa N., Kitayama T., Doi M., Misawa T., Komiyama Y., Ota K., 2007, ApJ, 663, 765
- Kim et al. (2011) Kim J.-W., Edge A. C., Wake D. A., Stott J. P., 2011, MNRAS, 410, 241
- Kimura et al. (2010) Kimura M., et al., 2010, PASJ, 62, 1135
- Kodama et al. (2007) Kodama T., Tanaka I., Kajisawa M., Kurk J., Venemans B., De Breuck C., Vernet J., Lidman C., 2007, MNRAS, 377, 1717
- Kurk et al. (2000) Kurk J. D., et al., 2000, A&A, 358, L1
- Kurk et al. (2004a) Kurk J. D., Pentericci L., Röttgering H. J. A., Miley G. K., 2004, A&A, 428, 793
- Kurk et al. (2004b) Kurk J. D., Pentericci L., Overzier R. A., Röttgering H. J. A., Miley G. K., 2004, A&A, 428, 817
- Kurk et al. (2009) Kurk J., et al., 2009, A&A, 504, 331
- Labbé et al. (2003) Labbé I., et al., 2003, ApJ, 591, L95
- Landolt (1992) Landolt A. U., 1992, AJ, 104, 340
- Large et al. (1981) Large M. I., Mills B. Y., Little A. G., Crawford D. F., Sutton J. M., 1981, MNRAS, 194, 693
- Lehmer et al. (2009) Lehmer B. D., et al., 2009, ApJ, 691, 687
- Lewis et al. (2002) Lewis I., et al., 2002, MNRAS, 334, 673
- Lilly et al. (1995) Lilly S. J., Tresse L., Hammer F., Crampton D., Le Fevre O., 1995, ApJ, 455, 108
- Matsuda et al. (2004) Matsuda Y., et al., 2004, AJ, 128, 569
- Matsuda et al. (2005) Matsuda Y., et al., 2005, ApJ, 634, L125
- Matsuda et al. (2009) Matsuda Y., et al., 2009, MNRAS, 400, L66
- Matsuda et al. (2010) Matsuda Y., et al., 2010, MNRAS, 403, L54
- Matsuda et al. (2011) Matsuda Y., et al., 2011, MNRAS, 410, L13
- McCarthy, Elston, & Eisenhardt (1992) McCarthy P. J., Elston R., Eisenhardt P., 1992, ApJ, 387, L29
- McCarthy (1993) McCarthy P. J., 1993, ARA&A, 31, 639
- Mei et al. (2009) Mei S., et al., 2009, ApJ, 690, 42
- Miley et al. (2004) Miley G. K., et al., 2004, Natur, 427, 47
- Miley & De Breuck (2007) Miley G., De Breuck C., 2007, A&ARv, 15, 67
- Miyazaki et al. (2002) Miyazaki S., et al., 2002, PASJ, 54, 833
- Oke et al. (1995) Oke J. B., et al., 1995, PASP, 107, 375
- Ouchi et al. (2004) Ouchi M., et al., 2004, ApJ, 611, 660
- Palunas et al. (2004) Palunas P., Teplitz H. I., Francis P. J., Williger G. M., Woodgate B. E., 2004, ApJ, 602, 545
- Pascarelle et al. (1996) Pascarelle S. M., Windhorst R. A., Keel W. C., Odewahn S. C., 1996, Natur, 383, 45
- Pentericci et al. (2000) Pentericci L., et al., 2000, A&A, 361, L25
- Röttgering et al. (1997) Röttgering H. J. A., van Ojik R., Miley G. K., Chambers K. C., van Breugel W. J. M., de Koff S., 1997, A&A, 326, 505
- Schlegel, Finkbeiner, & Davis (1998) Schlegel D. J., Finkbeiner D. P., Davis M., 1998, ApJ, 500, 525
- Shen et al. (2007) Shen Y., et al., 2007, AJ, 133, 2222
- Smail et al. (2003) Smail I., Scharf C. A., Ivison R. J., Stevens J. A., Bower R. G., Dunlop J. S., 2003, ApJ, 599, 86
- Smail et al. (2004) Smail I., Chapman S. C., Blain A. W., Ivison R. J., 2004, ApJ, 616, 71
- Smith et al. (2002) Smith J. A., et al., 2002, AJ, 123, 2121
- Sobral et al. (2011) Sobral D., Best P. N., Smail I., Geach J. E., Cirasuolo M., Garn T., Dalton G. B., 2011, MNRAS, 411, 675
- Sobral et al. (2010) Sobral D., Best P. N., Geach J. E., Smail I., Cirasuolo M., Garn T., Dalton G. B., Kurk J., 2010, MNRAS, 404, 1551
- Sobral et al. (2009b) Sobral D., et al., 2009, MNRAS, 398, L68
- Sobral et al. (2009a) Sobral D., et al., 2009, MNRAS, 398, 75
- Swinbank et al. (2004) Swinbank A. M., Smail I., Chapman S. C., Blain A. W., Ivison R. J., Keel W. C., 2004, ApJ, 617, 64
- Steidel et al. (1998) Steidel C. C., Adelberger K. L., Dickinson M., Giavalisco M., Pettini M., Kellogg M., 1998, ApJ, 492, 428
- Steidel et al. (2000) Steidel, C. C., Adelberger, K. L., Shapley, A. E., Pettini, M., Dickinson, M., & Giavalisco, M. 2000, ApJ, 532, 170
- Steidel et al. (2005) Steidel C. C., Adelberger K. L., Shapley A. E., Erb D. K., Reddy N. A., Pettini M., 2005, ApJ, 626, 44
- Steidel et al. (2011) Steidel C. C., Bogosavljević M., Shapley A. E., Kollmeier J. A., Reddy N. A., Erb D. K., Pettini M., 2011, arXiv, arXiv:1101.2204
- Stevens et al. (2003) Stevens J. A., et al., 2003, Natur, 425, 264
- Suzuki et al. (2008) Suzuki R., et al., 2008, PASJ, 60, 1347
- Tadaki et al. (2010) Tadaki K.-i., Kodama T., Koyama Y., Hayashi M., Tanaka I., Tokoku C., 2010, arXiv, arXiv:1012.4860
- Tanaka et al. (2000) Tanaka I., Yamada T., Aragón-Salamanca A., Kodama T., Miyaji T., Ohta K., Arimoto N., 2000, ApJ, 528, 123
- Tanaka et al. (2001) Tanaka I., Yamada T., Turner E. L., Suto Y., 2001, ApJ, 547, 521
- Tanaka et al. (2010) Tanaka I., et al., 2010, arXiv, arXiv:1012.1869
- Tanaka et al. (2010) Tanaka M., De Breuck C., Venemans B., Kurk J., 2010, A&A, 518, A18
- Thomas et al. (2005) Thomas D., Maraston C., Bender R., Mendes de Oliveira C., 2005, ApJ, 621, 673
- Tran et al. (2010) Tran K.-V. H., et al., 2010, ApJ, 719, L126
- van der Werf, Moorwood, & Bremer (2000) van der Werf P. P., Moorwood A. F. M., Bremer M. N., 2000, A&A, 362, 509
- Venemans et al. (2007) Venemans B. P., et al., 2007, A&A, 461, 823
- Wilman et al. (2007) Wilman R. J., Morris S. L., Jannuzi B. T., Davé R., Shone A. M., 2007, MNRAS, 375, 735
- Yagi et al. (2002) Yagi M., Kashikawa N., Sekiguchi M., Doi M., Yasuda N., Shimasaku K., Okamura S., 2002, AJ, 123, 66
- Yang et al. (2010) Yang Y., Zabludoff A., Eisenstein D., Davé R., 2010, ApJ, 719, 1654
- Young, Sargent, & Boksenberg (1982) Young P., Sargent W. L. W., Boksenberg A., 1982, ApJS, 48, 455
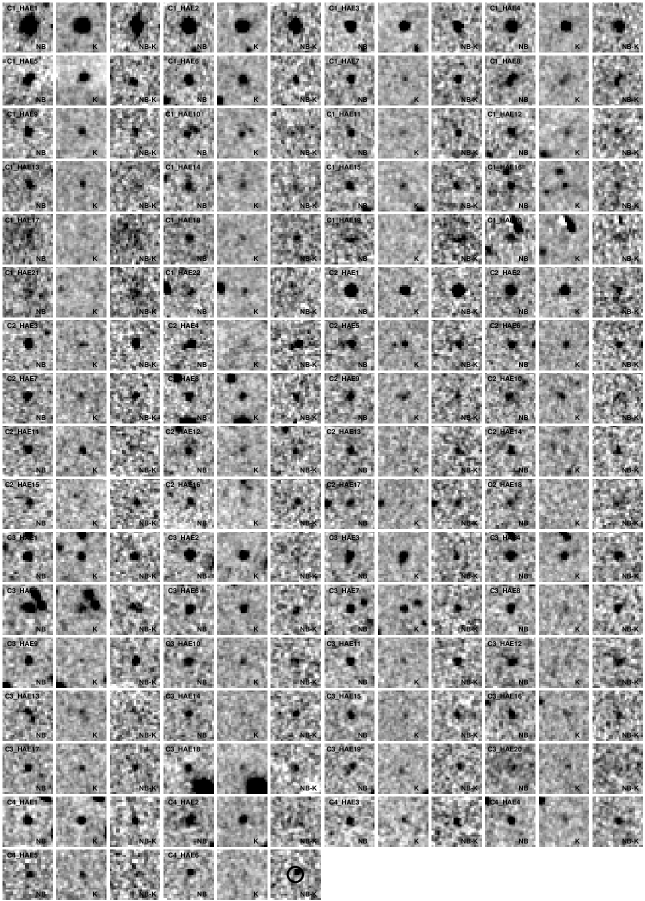
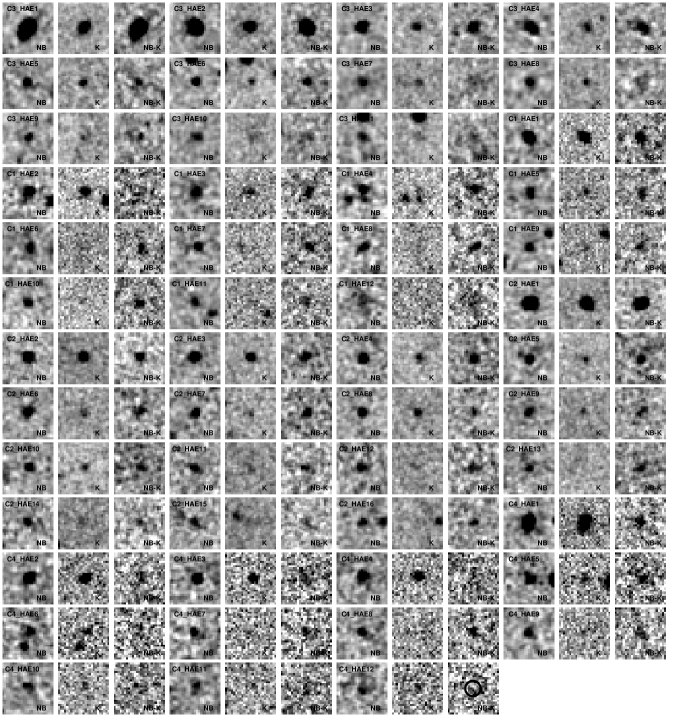
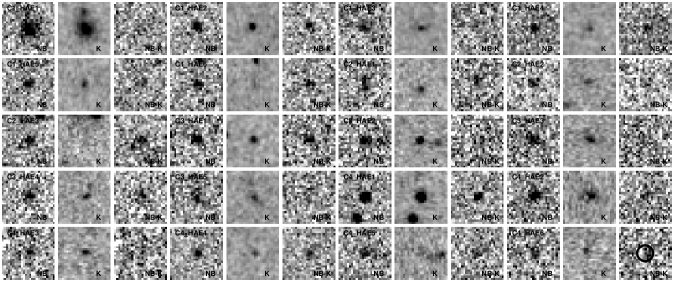
Appendix A Tables and thumbnail images of H emitter candidates
| ID | Coordinate (J2000) | log | log | SFR | M | Note | ||||
|---|---|---|---|---|---|---|---|---|---|---|
| (h:m:s) (d:m:s) | (mag) | (mag) | (Å) | (cgs) | (cgs) | |||||
| 2QZC-C1-HAE1 | 10:04:12.90 +00:12:57.9 | 15.58 | 16.29 | 110.0 | 219 | -14.68 | 43.88 | 7289 | 11.9 | QSO |
| 2QZC-C1-HAE2 | 10:03:39.79 +00:21:10.8 | 16.02 | 16.80 | 79.1 | 255 | -14.82 | 43.74 | 4868 | 11.7 | QSO |
| 2QZC-C1-HAE3 | 10:03:51.58 +00:15:02.1 | 17.03 | 17.95 | 34.5 | 327 | -15.18 | 43.38 | 1761 | 11.3 | QSO |
| 2QZC-C1-HAE4 | 10:03:38.27 +00:18:23.8 | 17.11 | 17.89 | 28.8 | 255 | -15.26 | 43.30 | 1414 | 11.3 | … |
| 2QZC-C1-HAE5 | 10:03:25.05 +00:09:20.5 | 18.66 | 18.93 | 3.0 | 66 | -16.24 | 42.33 | 90 | 10.9 | … |
| 2QZC-C1-HAE6 | 10:04:09.08 +00:15:45.9 | 18.80 | 19.12 | 3.0 | 78 | -16.24 | 42.32 | 88 | 10.8 | BzK |
| 2QZC-C1-HAE7 | 10:03:38.19 +00:14:35.2 | 18.97 | 20.95 | 8.5 | 1758 | -15.79 | 42.77 | 316 | 10.1 | BzK |
| 2QZC-C1-HAE8 | 10:03:26.43 +00:13:01.2 | 19.13 | 20.15 | 5.3 | 391 | -15.99 | 42.57 | 179 | 10.4 | BzK |
| 2QZC-C1-HAE9 | 10:03:32.97 +00:10:04.5 | 19.27 | 20.03 | 3.8 | 241 | -16.13 | 42.43 | 120 | 10.4 | BzK |
| 2QZC-C1-HAE10 | 10:04:04.29 +00:14:14.4 | 19.34 | 19.90 | 2.9 | 156 | -16.26 | 42.30 | 84 | 10.5 | BzK |
| 2QZC-C1-HAE11 | 10:03:33.09 +00:21:28.4 | 19.50 | 20.98 | 4.6 | 808 | -16.05 | 42.51 | 151 | 10.1 | BzK |
| 2QZC-C1-HAE12 | 10:03:33.57 +00:21:22.8 | 19.52 | 20.50 | 3.7 | 369 | -16.16 | 42.41 | 113 | 10.2 | BzK |
| 2QZC-C1-HAE13 | 10:03:24.48 +00:10:52.4 | 19.52 | 20.40 | 3.4 | 307 | -16.19 | 42.38 | 103 | 10.3 | BzK |
| 2QZC-C1-HAE14 | 10:03:43.28 +00:11:44.5 | 19.53 | 20.48 | 3.5 | 344 | -16.17 | 42.39 | 108 | 10.3 | BzK |
| 2QZC-C1-HAE15 | 10:03:43.84 +00:14:20.2 | 19.53 | 20.24 | 2.9 | 221 | -16.26 | 42.31 | 85 | 10.4 | BzK |
| 2QZC-C1-HAE16 | 10:03:39.78 +00:11:15.8 | 19.57 | 20.36 | 3.0 | 257 | -16.24 | 42.32 | 88 | 10.3 | BzK |
| 2QZC-C1-HAE17 | 10:04:12.16 +00:13:29.7 | 19.60 | 21.95 | 5.0 | 3460 | -16.02 | 42.54 | 165 | 9.7 | BzK |
| 2QZC-C1-HAE18 | 10:03:27.82 +00:10:58.6 | 19.67 | 21.04 | 3.8 | 682 | -16.14 | 42.42 | 118 | 10.0 | BzK |
| 2QZC-C1-HAE19 | 10:03:24.89 +00:08:31.8 | 19.71 | 22.15 | 4.6 | 4237 | -16.06 | 42.50 | 148 | 9.6 | … |
| 2QZC-C1-HAE20 | 10:04:16.74 +00:18:33.0 | 19.82 | 21.25 | 3.4 | 745 | -16.19 | 42.37 | 102 | 9.9 | … |
| 2QZC-C1-HAE21 | 10:04:02.90 +00:18:52.5 | 19.85 | 22.15 | 4.0 | 3167 | -16.12 | 42.44 | 124 | 9.6 | … |
| 2QZC-C1-HAE22 | 10:03:40.59 +00:10:07.1 | 19.86 | 20.83 | 2.6 | 356 | -16.30 | 42.26 | 75 | 10.1 | … |
a The H flux (erg s-1 cm-2) corrected for 33% [Nii] contribution to the measured flux.
b The H luminosity (erg s-1).
c The attenuation corrected star-formation rate derived from the H luminosity (M☉ yr-1).
d The stellar mass estimated from the -band magnitude by assuming a constant mass-to-light ratio from Geach et al. (2008).
| ID | Coordinate (J2000) | log | log | SFR | M | Note | ||||
| (h:m:s) (d:m:s) | (mag) | (mag) | (Å) | (cgs) | (cgs) | |||||
| 2QZC-C2-HAE1 | 10:05:11.82 +00:14:18.3 | 16.65 | 18.14 | 64.3 | 824 | -14.91 | 43.65 | 3778 | 11.2 | … |
| 2QZC-C2-HAE2 | 10:05:12.69 +00:10:58.7 | 17.91 | 18.20 | 6.3 | 70 | -15.92 | 42.64 | 219 | 11.2 | … |
| 2QZC-C2-HAE3 | 10:05:36.81 +00:14:19.4 | 18.81 | 20.67 | 9.6 | 1469 | -15.73 | 42.83 | 370 | 10.2 | … |
| 2QZC-C2-HAE4 | 10:05:34.17 +00:19:32.4 | 18.92 | 20.58 | 8.3 | 1061 | -15.80 | 42.76 | 309 | 10.2 | … |
| 2QZC-C2-HAE5 | 10:05:15.08 +00:12:01.8 | 19.06 | 19.98 | 5.4 | 331 | -15.99 | 42.57 | 180 | 10.5 | … |
| 2QZC-C2-HAE6 | 10:05:18.63 +00:14:20.9 | 19.25 | 20.14 | 4.3 | 308 | -16.08 | 42.48 | 139 | 10.4 | … |
| 2QZC-C2-HAE7 | 10:05:40.32 +00:11:09.1 | 19.27 | 20.38 | 4.9 | 450 | -16.03 | 42.53 | 161 | 10.3 | … |
| 2QZC-C2-HAE8 | 10:05:24.12 +00:19:39.4 | 19.28 | 20.10 | 4.1 | 276 | -16.11 | 42.45 | 128 | 10.4 | … |
| 2QZC-C2-HAE9 | 10:05:26.89 +00:14:36.4 | 19.38 | 20.02 | 3.1 | 193 | -16.22 | 42.34 | 93 | 10.4 | … |
| 2QZC-C2-HAE10 | 10:05:29.41 +00:19:59.4 | 19.44 | 20.21 | 3.3 | 250 | -16.19 | 42.37 | 101 | 10.4 | … |
| 2QZC-C2-HAE11 | 10:05:15.88 +00:14:08.7 | 19.45 | 20.39 | 3.7 | 337 | -16.15 | 42.42 | 116 | 10.3 | … |
| 2QZC-C2-HAE12 | 10:05:32.07 +00:09:00.4 | 19.45 | 20.00 | 2.5 | 151 | -16.31 | 42.25 | 72 | 10.5 | … |
| 2QZC-C2-HAE13 | 10:05:12.95 +00:09:10.2 | 19.68 | 21.05 | 3.8 | 680 | -16.14 | 42.42 | 118 | 10.0 | … |
| 2QZC-C2-HAE14 | 10:05:14.51 +00:17:36.5 | 19.75 | 21.43 | 3.9 | 1084 | -16.13 | 42.43 | 121 | 9.9 | … |
| 2QZC-C2-HAE15 | 10:05:51.55 +00:13:16.4 | 19.76 | 21.61 | 4.0 | 1436 | -16.12 | 42.45 | 126 | 9.8 | … |
| 2QZC-C2-HAE16 | 10:05:10.98 +00:19:55.6 | 19.87 | 21.66 | 3.6 | 1312 | -16.17 | 42.40 | 110 | 9.8 | … |
| 2QZC-C2-HAE17 | 10:05:18.32 +00:14:21.0 | 19.89 | 21.59 | 3.4 | 1125 | -16.18 | 42.38 | 104 | 9.8 | … |
| 2QZC-C2-HAE18 | 10:05:19.23 +00:15:01.5 | 19.90 | 22.15 | 3.8 | 2862 | -16.14 | 42.42 | 116 | 9.6 | … |
| 2QZC-C3-HAE1 | 10:05:19.28 +00:40:16.0 | 18.40 | 19.18 | 8.8 | 253 | -15.77 | 42.79 | 331 | 10.8 | … |
| 2QZC-C3-HAE2 | 10:05:17.44 +00:37:44.5 | 18.48 | 18.70 | 2.9 | 50 | -16.26 | 42.30 | 84 | 11.0 | … |
| 2QZC-C3-HAE3 | 10:05:31.07 +00:41:00.7 | 18.71 | 18.96 | 2.7 | 60 | -16.29 | 42.27 | 77 | 10.9 | … |
| 2QZC-C3-HAE4 | 10:05:21.53 +00:38:26.3 | 18.82 | 19.71 | 6.5 | 310 | -15.91 | 42.65 | 227 | 10.6 | … |
| 2QZC-C3-HAE5 | 10:05:53.65 +00:43:07.9 | 18.84 | 19.59 | 5.7 | 238 | -15.96 | 42.60 | 194 | 10.6 | … |
| 2QZC-C3-HAE6 | 10:05:56.86 +00:39:31.8 | 19.02 | 19.45 | 3.1 | 112 | -16.22 | 42.34 | 94 | 10.7 | … |
| 2QZC-C3-HAE7 | 10:05:26.30 +00:37:05.0 | 19.07 | 19.92 | 5.0 | 285 | -16.02 | 42.54 | 164 | 10.5 | … |
| 2QZC-C3-HAE8 | 10:06:00.01 +00:42:33.6 | 19.31 | 20.71 | 5.4 | 713 | -15.99 | 42.57 | 181 | 10.2 | … |
| 2QZC-C3-HAE9 | 10:05:36.99 +00:46:20.2 | 19.35 | 22.15 | 6.6 | 13565 | -15.90 | 42.66 | 231 | 9.6 | … |
| 2QZC-C3-HAE10 | 10:05:55.27 +00:44:11.7 | 19.43 | 20.45 | 4.0 | 387 | -16.12 | 42.45 | 126 | 10.3 | … |
| 2QZC-C3-HAE11 | 10:06:02.53 +00:43:34.8 | 19.44 | 21.56 | 5.6 | 2257 | -15.97 | 42.59 | 192 | 9.8 | … |
| 2QZC-C3-HAE12 | 10:06:03.90 +00:41:06.3 | 19.46 | 21.59 | 5.5 | 2281 | -15.97 | 42.59 | 188 | 9.8 | … |
| 2QZC-C3-HAE13 | 10:05:11.91 +00:35:31.2 | 19.52 | 20.23 | 2.9 | 221 | -16.25 | 42.31 | 86 | 10.4 | … |
| 2QZC-C3-HAE14 | 10:05:49.59 +00:39:53.2 | 19.70 | 20.99 | 3.6 | 599 | -16.16 | 42.40 | 110 | 10.1 | … |
| 2QZC-C3-HAE15 | 10:05:16.28 +00:41:50.4 | 19.70 | 21.28 | 3.9 | 934 | -16.12 | 42.44 | 124 | 9.9 | … |
| 2QZC-C3-HAE16 | 10:05:33.56 +00:36:13.9 | 19.70 | 20.83 | 3.3 | 463 | -16.20 | 42.36 | 100 | 10.1 | … |
| 2QZC-C3-HAE17 | 10:05:35.09 +00:39:44.7 | 19.72 | 20.82 | 3.2 | 444 | -16.21 | 42.35 | 96 | 10.1 | … |
| 2QZC-C3-HAE18 | 10:05:36.78 +00:39:09.2 | 19.77 | 21.04 | 3.3 | 587 | -16.19 | 42.37 | 101 | 10.0 | … |
| 2QZC-C3-HAE19 | 10:05:22.24 +00:37:38.4 | 19.79 | 21.11 | 3.3 | 634 | -16.19 | 42.37 | 101 | 10.0 | … |
| 2QZC-C3-HAE20 | 10:05:42.34 +00:41:26.0 | 19.87 | 20.84 | 2.6 | 353 | -16.30 | 42.26 | 74 | 10.1 | … |
| 2QZC-C4-HAE1 | 10:04:01.76 +00:36:59.4 | 18.61 | 19.29 | 6.6 | 206 | -15.90 | 42.66 | 230 | 10.7 | … |
| 2QZC-C4-HAE2 | 10:03:43.23 +00:41:35.6 | 18.93 | 19.30 | 3.0 | 93 | -16.24 | 42.32 | 89 | 10.7 | … |
| 2QZC-C4-HAE3 | 10:03:53.81 +00:36:05.7 | 19.54 | 21.27 | 4.8 | 1185 | -16.04 | 42.52 | 156 | 9.9 | … |
| 2QZC-C4-HAE4 | 10:04:08.44 +00:43:09.8 | 19.66 | 20.95 | 3.7 | 600 | -16.15 | 42.41 | 115 | 10.1 | … |
| 2QZC-C4-HAE5 | 10:03:54.01 +00:35:37.6 | 19.87 | 20.79 | 2.5 | 331 | -16.31 | 42.25 | 72 | 10.1 | … |
| 2QZC-C4-HAE6 | 010:04:08.45 +00:34:58.3 | 19.89 | 22.15 | 3.8 | 2913 | -16.14 | 42.42 | 118 | 9.6 | … |
a The H flux (erg s-1 cm-2) corrected for 33% [Nii] contribution to the measured flux.
b The H luminosity (erg s-1).
c The attenuation corrected star-formation rate derived from the H luminosity (M☉ yr-1).
d The stellar mass estimated from the -band magnitude by assuming a constant mass-to-light ratio from Geach et al. (2008).
| ID | Coordinate (J2000) | log | log | SFR | M | Note | ||||
| (h:m:s) (d:m:s) | (mag) | (mag) | (Å) | (cgs) | (cgs) | |||||
| 0200-C3-HAE1 | 2:02:42.99 +01:49:10.8 | 16.48 | 18.30 | 55.9 | 1369 | -14.81 | 43.76 | 5080 | 11.1 | HzRG |
| 0200-C3-HAE2 | 2:02:50.22 +01:48:53.3 | 16.57 | 18.01 | 46.5 | 760 | -14.89 | 43.68 | 4054 | 11.2 | NLAGN |
| 0200-C3-HAE3 | 2:02:37.68 +01:44:33.2 | 18.19 | 19.43 | 9.6 | 557 | -15.57 | 42.99 | 589 | 10.7 | BzK |
| 0200-C3-HAE4 | 2:02:37.36 +01:48:22.2 | 18.47 | 19.50 | 6.7 | 397 | -15.73 | 42.84 | 378 | 10.6 | BzK |
| 0200-C3-HAE5 | 2:03:01.04 +01:52:09.9 | 18.85 | 19.70 | 4.2 | 288 | -15.93 | 42.63 | 212 | 10.6 | … |
| 0200-C3-HAE6 | 2:02:46.98 +01:47:54.2 | 19.08 | 20.69 | 4.8 | 984 | -15.87 | 42.69 | 254 | 10.2 | BzK |
| 0200-C3-HAE7 | 2:02:19.37 +01:55:39.8 | 19.13 | 20.13 | 3.6 | 375 | -16.00 | 42.56 | 175 | 10.4 | BzK |
| 0200-C3-HAE8 | 2:02:24.55 +01:56:06.4 | 19.18 | 20.23 | 3.5 | 411 | -16.00 | 42.56 | 174 | 10.4 | … |
| 0200-C3-HAE9 | 2:03:02.81 +01:49:20.5 | 19.35 | 20.15 | 2.6 | 265 | -16.15 | 42.42 | 116 | 10.4 | BzK |
| 0200-C3-HAE10 | 2:02:51.92 +01:50:02.9 | 19.36 | 20.19 | 2.6 | 280 | -16.14 | 42.42 | 118 | 10.4 | BzK |
| 0200-C3-HAE11 | 2:02:34.33 +01:44:58.9 | 19.47 | 20.57 | 2.8 | 442 | -16.11 | 42.45 | 128 | 10.2 | BzK |
| 0200-C1-HAE1 | 2:01:03.23 +01:20:09.7 | 17.74 | 18.29 | 8.5 | 155 | -15.62 | 42.94 | 508 | 11.1 | … |
| 0200-C1-HAE2 | 2:01:21.56 +01:24:45.0 | 18.32 | 18.58 | 2.6 | 61 | -16.13 | 42.43 | 121 | 11.0 | … |
| 0200-C1-HAE3 | 2:00:36.54 +01:20:18.0 | 18.69 | 19.71 | 5.4 | 387 | -15.82 | 42.74 | 291 | 10.6 | … |
| 0200-C1-HAE4 | 2:01:06.09 +01:23:30.8 | 18.73 | 20.09 | 6.1 | 664 | -15.77 | 42.80 | 339 | 10.4 | … |
| 0200-C1-HAE5 | 2:00:38.81 +01:22:56.7 | 18.94 | 20.00 | 4.4 | 409 | -15.91 | 42.65 | 225 | 10.5 | … |
| 0200-C1-HAE6 | 2:00:36.58 +01:19:53.7 | 19.08 | 20.36 | 4.3 | 590 | -15.92 | 42.65 | 221 | 10.3 | … |
| 0200-C1-HAE7 | 2:00:57.57 +01:19:39.2 | 19.11 | 21.05 | 5.0 | 1635 | -15.85 | 42.71 | 266 | 10.0 | … |
| 0200-C1-HAE8 | 2:00:43.94 +01:26:14.8 | 19.18 | 21.06 | 4.7 | 1485 | -15.88 | 42.68 | 243 | 10.0 | … |
| 0200-C1-HAE9 | 2:00:33.53 +01:21:28.7 | 19.19 | 20.48 | 3.9 | 602 | -15.96 | 42.60 | 196 | 10.3 | … |
| 0200-C1-HAE10 | 2:01:05.81 +01:23:50.3 | 19.23 | 21.63 | 4.9 | 3931 | -15.87 | 42.70 | 255 | 9.8 | … |
| 0200-C1-HAE11 | 2:00:40.04 +01:19:22.0 | 19.35 | 20.88 | 3.7 | 863 | -15.99 | 42.57 | 181 | 10.1 | … |
| 0200-C1-HAE12 | 2:01:07.72 +01:28:22.6 | 19.41 | 21.75 | 4.1 | 3438 | -15.94 | 42.62 | 206 | 9.8 | … |
| 0200-C2-HAE1 | 2:03:08.25 +01:28:18.1 | 16.44 | 17.26 | 37.6 | 273 | -14.98 | 43.58 | 3121 | 11.5 | … |
| 0200-C2-HAE2 | 2:02:16.71 +01:30:06.7 | 17.99 | 18.59 | 7.3 | 176 | -15.69 | 42.87 | 420 | 11.0 | … |
| 0200-C2-HAE3 | 2:02:52.26 +01:29:33.7 | 18.16 | 18.77 | 6.3 | 178 | -15.75 | 42.81 | 349 | 10.9 | … |
| 0200-C2-HAE4 | 2:02:50.60 +01:24:55.1 | 18.51 | 19.57 | 6.6 | 417 | -15.73 | 42.83 | 371 | 10.6 | … |
| 0200-C2-HAE5 | 2:02:52.81 +01:23:00.1 | 18.83 | 19.84 | 4.8 | 385 | -15.87 | 42.69 | 250 | 10.5 | … |
| 0200-C2-HAE6 | 2:02:51.23 +01:30:57.2 | 18.85 | 19.97 | 4.9 | 456 | -15.86 | 42.70 | 260 | 10.5 | … |
| 0200-C2-HAE7 | 2:02:46.26 +01:21:46.2 | 18.89 | 20.90 | 6.2 | 1839 | -15.76 | 42.81 | 347 | 10.1 | … |
| 0200-C2-HAE8 | 2:03:00.80 +01:27:05.4 | 18.93 | 19.45 | 2.7 | 144 | -16.12 | 42.45 | 126 | 10.7 | … |
| 0200-C2-HAE9 | 2:03:05.95 +01:28:22.9 | 19.17 | 20.61 | 4.2 | 762 | -15.93 | 42.64 | 216 | 10.2 | … |
| 0200-C2-HAE10 | 2:02:51.75 +01:24:21.8 | 19.19 | 20.14 | 3.3 | 344 | -16.04 | 42.53 | 158 | 10.4 | … |
| 0200-C2-HAE11 | 2:02:19.56 +01:30:54.0 | 19.21 | 20.54 | 3.9 | 639 | -15.96 | 42.60 | 195 | 10.2 | … |
| 0200-C2-HAE12 | 2:02:19.72 +01:21:32.2 | 19.28 | 20.90 | 4.0 | 998 | -15.95 | 42.61 | 201 | 10.1 | … |
| 0200-C2-HAE13 | 2:02:40.64 +01:30:18.2 | 19.41 | 21.75 | 4.1 | 3445 | -15.94 | 42.62 | 206 | 9.8 | … |
| 0200-C2-HAE14 | 2:02:20.53 +01:18:16.1 | 19.44 | 20.45 | 2.7 | 384 | -16.12 | 42.44 | 125 | 10.3 | … |
| 0200-C2-HAE15 | 2:02:16.49 +01:29:17.8 | 19.45 | 20.65 | 3.0 | 521 | -16.08 | 42.48 | 139 | 10.2 | … |
| 0200-C2-HAE16 | 2:03:04.90 +01:29:38.8 | 19.47 | 21.12 | 3.4 | 1046 | -16.02 | 42.54 | 165 | 10.0 | … |
| 0200-C4-HAE1 | 2:01:04.87 +01:50:43.6 | 17.41 | 17.65 | 5.6 | 55 | -15.80 | 42.76 | 306 | 11.4 | … |
| 0200-C4-HAE2 | 2:00:57.44 +01:50:06.2 | 17.91 | 18.20 | 4.2 | 69 | -15.93 | 42.63 | 214 | 11.2 | … |
| 0200-C4-HAE3 | 2:00:51.42 +01:45:56.2 | 18.18 | 18.55 | 4.2 | 94 | -15.93 | 42.63 | 210 | 11.0 | … |
| 0200-C4-HAE4 | 2:00:53.01 +01:47:18.6 | 18.43 | 18.71 | 2.6 | 68 | -16.13 | 42.43 | 120 | 11.0 | … |
| 0200-C4-HAE5 | 2:01:12.56 +01:45:14.7 | 18.72 | 19.74 | 5.3 | 388 | -15.83 | 42.73 | 283 | 10.6 | … |
| 0200-C4-HAE6 | 2:00:47.83 +01:44:55.2 | 19.02 | 19.56 | 2.6 | 154 | -16.13 | 42.43 | 120 | 10.6 | … |
| 0200-C4-HAE7 | 2:01:07.59 +01:44:34.1 | 19.24 | 20.87 | 4.2 | 1012 | -15.93 | 42.63 | 213 | 10.1 | … |
| 0200-C4-HAE8 | 2:01:05.52 +01:48:03.1 | 19.27 | 21.15 | 4.3 | 1509 | -15.92 | 42.65 | 222 | 10.0 | … |
| 0200-C4-HAE9 | 2:01:05.89 +01:48:13.6 | 19.37 | 20.59 | 3.2 | 537 | -16.04 | 42.52 | 155 | 10.2 | … |
| 0200-C4-HAE10 | 2:00:48.00 +01:50:10.0 | 19.45 | 20.38 | 2.5 | 331 | -16.15 | 42.42 | 116 | 10.3 | … |
| 0200-C4-HAE11 | 2:00:51.62 +01:47:20.2 | 19.46 | 20.77 | 3.1 | 617 | -16.07 | 42.50 | 145 | 10.1 | … |
| 0200-C4-HAE12 | 2:00:55.98 +01:44:36.2 | 19.50 | 20.50 | 2.6 | 378 | -16.14 | 42.42 | 116 | 10.2 | … |
a The H flux (erg s-1 cm-2) corrected for 33% [Nii] contribution to the measured flux.
b The H luminosity (erg s-1).
c The attenuation corrected star-formation rate derived from the H luminosity (M☉ yr-1).
d The stellar mass estimated from the -band magnitude by assuming a constant mass-to-light ratio from Geach et al. (2008).
| ID | Coordinate (J2000) | log | log | SFR | M | Note | ||||
| (h:m:s) (d:m:s) | (mag) | (mag) | (Å) | (cgs) | (cgs) | |||||
| SSA 13-C1-HAE1 | 13:12:27.80 +42:42:26.6 | 17.76 | 17.99 | 2.6 | 53 | -15.95 | 42.61 | 201 | 11.3 | … |
| SSA 13-C1-HAE2 | 13:12:36.58 +42:40:02.5 | 18.26 | 19.04 | 4.5 | 254 | -15.72 | 42.84 | 387 | 10.8 | BzK |
| SSA 13-C1-HAE3 | 13:12:42.53 +42:41:56.0 | 18.68 | 19.31 | 2.6 | 187 | -15.95 | 42.61 | 201 | 10.7 | BzK |
| SSA 13-C1-HAE4 | 13:13:07.72 +42:34:41.0 | 18.71 | 19.81 | 3.7 | 445 | -15.80 | 42.76 | 304 | 10.5 | BzK |
| SSA 13-C1-HAE5 | 13:12:10.36 +42:43:10.6 | 18.81 | 19.64 | 2.8 | 279 | -15.92 | 42.64 | 218 | 10.6 | BzK |
| SSA 13-C1-HAE6 | 13:11:59.75 +42:42:53.3 | 18.98 | 20.14 | 3.0 | 490 | -15.90 | 42.66 | 231 | 10.4 | BzK |
| SSA 13-C2-HAE1 | 13:14:44.24 +42:35:13.7 | 18.84 | 19.94 | 3.3 | 445 | -15.86 | 42.70 | 261 | 10.5 | … |
| SSA 13-C2-HAE2 | 13:15:04.66 +42:39:44.0 | 18.92 | 19.83 | 2.7 | 322 | -15.94 | 42.62 | 207 | 10.5 | … |
| SSA 13-C2-HAE3 | 13:15:21.66 +42:46:29.0 | 18.97 | 21.11 | 3.9 | 2331 | -15.78 | 42.78 | 325 | 10.0 | … |
| SSA 13-C3-HAE1 | 13:15:03.25 +43:01:42.6 | 18.15 | 19.28 | 6.2 | 462 | -15.58 | 42.98 | 575 | 10.7 | … |
| SSA 13-C3-HAE2 | 13:15:15.31 +43:09:52.7 | 18.32 | 18.71 | 2.5 | 100 | -15.97 | 42.59 | 190 | 11.0 | … |
| SSA 13-C3-HAE3 | 13:15:13.54 +43:08:30.1 | 18.39 | 18.93 | 3.0 | 150 | -15.89 | 42.67 | 238 | 10.9 | … |
| SSA 13-C3-HAE4 | 13:15:21.67 +43:06:01.3 | 18.49 | 19.61 | 4.6 | 457 | -15.71 | 42.85 | 394 | 10.6 | … |
| SSA 13-C3-HAE5 | 13:14:22.61 +43:04:44.9 | 18.78 | 19.49 | 2.6 | 219 | -15.96 | 42.61 | 197 | 10.7 | … |
| SSA 13-C4-HAE1 | 13:12:39.90 +43:12:11.9 | 17.24 | 17.63 | 6.7 | 99 | -15.55 | 43.02 | 630 | 11.4 | … |
| SSA 13-C4-HAE2 | 13:11:58.12 +43:06:47.3 | 18.24 | 18.71 | 3.1 | 124 | -15.88 | 42.68 | 244 | 11.0 | … |
| SSA 13-C4-HAE3 | 13:12:26.80 +43:01:46.4 | 18.86 | 19.65 | 2.6 | 260 | -15.96 | 42.61 | 199 | 10.6 | … |
| SSA 13-C4-HAE4 | 13:12:45.44 +43:13:32.7 | 18.89 | 20.39 | 3.7 | 840 | -15.80 | 42.76 | 303 | 10.3 | … |
| SSA 13-C4-HAE5 | 13:12:10.09 +43:07:36.8 | 18.89 | 19.94 | 3.0 | 408 | -15.89 | 42.67 | 238 | 10.5 | … |
| SSA 13-C4-HAE6 | 13:12:22.13 +43:01:34.0 | 18.98 | 19.99 | 2.7 | 382 | -15.94 | 42.63 | 210 | 10.5 | … |
a The H flux (erg s-1 cm-2) corrected for 33% [Nii] contribution to the measured flux.
b The H luminosity (erg s-1).
c The attenuation corrected star-formation rate derived from the H luminosity (M☉ yr-1).
d The stellar mass estimated from the -band magnitude by assuming a constant mass-to-light ratio from Geach et al. (2008).
Appendix B Full sky maps of emitters