Gas Kinematics in Ly Nebulae**affiliation: This paper includes data gathered with the 6.5 meter Magellan Telescopes located at Las Campanas Observatory, Chile.
Abstract
Exploring the origin of Ly nebulae (“blobs”) at high redshift requires measurements of their gas kinematics that are impossible with only the resonant, optically-thick Ly line. To define gas motions relative to the systemic velocity of the blob, the Ly line must be compared with an optically-thin line like H 6563, which is not much altered by radiative transfer effects and is more concentrated about the galaxies embedded in the nebula’s core. We obtain optical and near-infrared (NIR) spectra of the two brightest Ly blobs (CDFS-LAB01 and CDFS-LAB02) from the Yang et al. (2010) sample using the Magellan/MagE optical and VLT/SINFONI NIR spectrographs. Both the Ly and H lines confirm that these blobs lie at the survey redshift, . Within each blob, we detect several H sources, which roughly correspond to galaxies seen in HST rest-frame UV images. The H detections show that these galaxies have large internal velocity dispersions ( km s-1) and that, in the one system (LAB01), where we can reliably extract profiles for two H sources, their velocity difference is 440 km s-1. The presence of multiple galaxies within the blobs, and those galaxies’ large velocity dispersions and large relative motion, is consistent with our previous finding that Ly blobs inhabit massive dark matter halos that will evolve into those typical of rich clusters today and that the embedded galaxies may eventually become brightest cluster galaxies (Yang et al., 2010). To determine whether the gas near the embedded galaxies is predominantly infalling or outflowing, we compare the Ly and H line centers, finding that Ly is not offset ( = +0 km s-1) in LAB01 and redshifted by only +230 km s-1 in LAB02. These offsets are small compared to those of Lyman break galaxies, which average +450 km s-1 and extend to about +700 km s-1. In LAB02, we detect C II 1334 and Si II 1526 absorption lines, whose blueward shifts of km s-1 are consistent with the small outflow implied by the redward shift of Ly. We test and rule out the simplest infall models and those outflow models with super/hyper-winds, which require large outflow velocities. Because of the unknown geometry of the gas distribution and the possibility of multiple sources of Ly emission embedded in the blobs, a larger sample and more sophisticated models are required to test more complex or a wider range of infall and outflow scenarios.
Subject headings:
galaxies: formation — galaxies: high-redshift — intergalactic medium1. Introduction
Ly nebulae, or “blobs,” are extended sources at 2–6 with typical Ly sizes of 5″ ( 50 kpc) and line luminosities of erg s-1 (e.g., Keel et al., 1999; Steidel et al., 2000; Francis et al., 2001; Matsuda et al., 2004, 2010; Dey et al., 2005; Saito et al., 2006; Smith & Jarvis, 2007; Hennawi et al., 2009; Ouchi et al., 2009; Prescott et al., 2009; Yang et al., 2009, 2010). Their number density and its large variance suggests that blobs lie in massive ( ) dark matter halos, which will evolve into those typical of rich clusters today (Yang et al., 2010). Galaxies embedded within blobs are likely to become brightest cluster galaxies. Therefore, blobs are important sites for studying the early interaction of galaxies with the surrounding intergalactic medium (IGM).
This interaction is probably tied on some scale to the source of the blobs’ extended Ly emission, but the mechanism is poorly understood. For example, the blob may represent emission from galactic-scale outflows generated by star formation (Taniguchi & Shioya, 2000), intense radiative feedback from AGNs (Haiman & Rees, 2001; Geach et al., 2009), or even cooling radiation from accreting gas (Fardal et al., 2001; Haiman, Spaans, & Quataert, 2000; Dijkstra & Loeb, 2009; Goerdt et al., 2010).
There are generally two ways to unravel the nature of the blobs. The first approach is to study what powers the Ly emitting gas, counting all ionizing sources within or around the extended Ly emission and comparing that energy budget with the observed Ly luminosity. Sometimes, one can identify possible energy sources, e.g., powerful AGNs detected in X-rays (Yang et al., 2009; Geach et al., 2009). Some potential sources may even lie outside a blob (Hennawi et al., 2009). If no such source is found, the remaining Ly luminosity may be attributable to cooling radiation (e.g., Nilsson et al., 2006; Smith & Jarvis, 2007; Smith et al., 2008).
An alternative path is to observe spectroscopically the kinematics of the extended Ly-emitting gas. Even addressing whether the gas is falling into an embedded galaxy or outflowing into the IGM would be a significant step forward, providing evidence for either gas accretion by forming galaxies or for AGN/starburst-driven galactic winds, respectively. Combining the two approaches by considering the blob’s energetics and kinematics simultaneously is ideal, a test of whether the bulk motions of the gas are in fact coupled to the source of its illumination. For example, gas infall is possible even in the presence of an AGN (e.g., Weidinger et al., 2005; Humphrey et al., 2007; Adams et al., 2009). Cases in which blob gas is both outflowing on small scales due to galactic processes and infalling on larger scales from the extended IGM are not unlikely.
Unfortunately, the kinematic approach has been stymied by the limitations of the Ly line, which, although bright compared with other lines, is hard to interpret. The ambiguity arises because Ly is a resonant line and typically optically thick in the surrounding intergalactic medium. As a result, studies even of the same blob’s kinematics can disagree. On one hand, Wilman et al. (2005) argue that IFU spectra from a certain blob are consistent with a simple model where the Ly emission is absorbed by a foreground slab of neutral gas swept out by a galactic scale outflow. On the other, Dijkstra et al. (2006b) claim that the same data can be explained by the infall of the surrounding intergalactic medium. Worse, Verhamme et al. (2006) comment that the same Ly profiles are most consistent with static surrounding gas.
To distinguish among such possibilities requires a comparison of the Ly line center with the center of an optically-thin line like H 6563 (see also Yang et al., 2006). H is a better measure of the blob’s systemic velocity, i.e., of the precise redshift, because it is not seriously altered by radiative transfer effects and is more concentrated about the galaxies in the blob’s core. Despite the complexity of various blob models, infall models predict that the peak of the optically thick Ly emission line must be blueshifted with respect to H, whereas outflows will redshift the Ly line (Dijkstra et al., 2006a). This diagnostic has been applied both to local starburst galaxies (Legrand et al., 1997) and to Lyman break galaxies (LBGs) at =1.5–2.5 (Pettini et al., 2001; Steidel et al., 2004) and has provided evidence for outflows driven by strong stellar winds. An analysis in a similar spirit, but using the H I 21cm absorption line to mark the systemic redshift of a high- radio galaxy, finds that the Ly line is blueshifted and thus that extended gas is inflowing to the AGN (Adams et al., 2009). Previous spectroscopic observations of Ly blobs (e.g., at ; Wilman et al., 2005; Matsuda et al., 2006; Saito et al., 2008) include only Ly, precluding a direct comparison with a cleaner line’s center and muddling the interpretation of the kinematics.
To overcome this challenge, Yang et al. (2009, 2010) conduct blind surveys for Ly blobs at , a redshift at which important rest-frame optical diagnostic lines (e.g., [O II] 3727, [O III] 5007, H 4868, H 6563) fall in NIR windows and avoid bright OH sky lines (or atmospheric absorption). In this paper, we present optical and NIR spectroscopy of the two brightest blobs, CDFS-LAB01 and CDFS-LAB02, of the 25 in the Yang et al. (2010) sample. For each, we compare the Ly line profile with the center of the H line and use existing radiative transfer models (Dijkstra et al., 2006a; Verhamme et al., 2006, 2008) to test whether the detected gas is infalling or outflowing.
In addition to the blob’s systemic velocity, NIR spectroscopy can constrain (1) the velocity dispersion and any ordered motion like disk rotation of the brightest embedded galaxies, (2) the presence of AGNs with rest-frame optical nebular line diagnostics (e.g., [N II]/H), (3) the gas-phase metallicity, and (4) the star formation rate (SFR) directly from the H flux, allowing a comparison with that derived from the rest-frame UV. Before now, none of these measurements has been available for Ly blobs. In this paper, we focus on the kinematics of the gas in the blob and in the embedded galaxies, deferring discussions of the AGN line diagnostics, gas-phase metallicity, and SFRs to a future paper (Y. Yang et al. 2011, in preparation).
In §2, we review how we selected blobs from our narrowband imaging surveys (Yang et al., 2010) and then describe the optical/NIR spectroscopy of the first two blobs. In §3, we present the first results from the spectroscopic campaign. We confirm spectroscopically the blob redshift and discover multiple H sources within each blob (§3.1). We compare the Ly profiles with the H line centers to discriminate between simple infall and outflow scenarios (§3.2). In §3.3, we describe the interstellar absorption lines detected in LAB02 and compare the low ionization lines with H. We estimate the velocity dispersions of three of the embedded galaxies in §3.4. In §4, we compare the Ly profiles and LyH offsets with existing radiative transfer models. We also discuss our results in the context of the clumpy circum-galactic gas model proposed by Steidel et al. (2010). §5 summarizes our conclusions. Throughout this paper, we adopt cosmological parameters: = 70 , , and .
2. Observations and Data Reduction


2.1. Sample
We observe the two brightest Ly blobs from the Yang et al. (2010) sample, which consists of 25 blobs discovered in four different survey fields. These two blobs lie in the Extended Chandra Deep Field South (E-CDFS) and were found via deep imaging with the CTIO-4m MOSAIC–II camera and a custom narrowband filter (NB403). This filter has a central wavelength of Å, designed for selecting Ly-emitting sources at , and a band-width of Å, providing a line of sight (hereafter LOS) depth of that corresponds to 46.8 comoving Mpc. The blob selection criteria are: EWobs 100Å and isophotal area 10 □″ above the surface brightness threshold of 5.5 10-18 erg s-1 cm-2 arcsec-2. We show the images of the two blobs (CDFS-LAB01 and CDFS-LAB02) in Figure 1. We refer readers to Yang et al. (2010) for details of the sample selection.
2.2. Optical Spectroscopy
We obtained high resolution optical spectra of the two Ly blobs using the Magellan Echellette Spectrograph (MagE; Marshall et al., 2008) on the Magellan Clay 6.5m telescope. MagE provides a spectral resolution of 4100 for a 1″ slit over a wide wavelength range of 3000Å – 10000Å. While the slit length is small (10″) compared to typical longslits, the excellent blue sensitivity around 4000Å is ideal for obtaining the Ly line profile. Observations were carried out on UT 2008 July 26 and October 1, and 2009 February 17. For LAB01, we first acquired a low resolution spectrum in 2008 July 26 to spectroscopically confirm the redshift prior to the NIR spectroscopic run. Later, we obtained the spectrum with a slit orientation of P.A.=42° as shown in Figure 1 (Ly panel). For LAB02, we used a 2″ slit and a P.A.=0° to obtain a 2000 spectrum. The sky condition was clear, and the seeing ranged from 0.9 to 1.3″. The individual exposure times varied from 20 to 40min, depending on the variability of the seeing. Total exposure times were 2.5 and 2.0 hrs for LAB01 and LAB02, respectively. For accurate wavelength calibration, we took ThAr lamp frames right before and after the science exposures and at the same telescope pointing to eliminate systematic errors introduced by instrument flexure.
We reduce the MagE data using the Daniel Kelson’s Carnegie-Python Package (Kelson et al., 2000; Kelson, 2003). The frames are overscan-corrected, bias-subtracted, and flat-fielded with Xenon-flash and quartz (incandescent) lamps. Using night sky lines and ThAr lamp spectra, we estimate the uncertainties in the wavelength solution to be 0.03Å (0.1 pixel). The sky background is then subtracted in 2D using the method described in Kelson (2003), and the frames are corrected for spatial distortions. We combine the rectified 2D spectra and extract the 1D spectra using IDL routines. We also re-reduce the data with the MagE Spectral Extractor package (MASE; Bochanski et al., 2009) and confirm that the results are consistent. The spectra are flux-calibrated with 2–3 standard stars each night. Due to the limited spatial coverage of the slit and the relatively short exposure times, our spectra are dominated by the brightest spots within the blobs, which coincide with the galaxies detected in the HST rest-frame UV images. Future IFU observations should be helpful in constraining how the Ly profiles vary over the blobs.
2.3. Near Infrared Spectroscopy
We carried out NIR Integral Field Unit (IFU) spectroscopy of the two Ly blobs using SINFONI (Eisenhauer et al., 2003; Bonnet et al., 2004) on the VLT UT4 telescope in visitor mode between UT 2009 January 30 and February 4. To measure the redshifted H ( 2.175µm) line, we used the K-band grating, which covers 1.95µm – 2.45µm with a spectral resolution of 4000 ( 75 km s-1) and dispersion of 2.5 Å pixel-1. Because the blobs are spatially extended over 5″–10″ and include multiple sources, we employed the seeing-limited mode (i.e., no adaptive optics), which provided the largest FOV (8″8″) and a plate scale of 025 pixel-1 for the spatial resolution elements (spaxels). In each observing block, we observed reference stars, which we used to blind offset to the blobs as well as to monitor the telescope pointing accuracy and the seeing variations. The K-band seeing ranged from 03 to 12, and the sky condition was clear. To maximize the on-source integration time, we adopted an “on-source dithering” strategy in which the science targets were always kept within the FOV but at different detector positions. For LAB01, we used a three-point dithering scheme that moves among the pointings by 4″ to south or west, providing a usable FOV of two 4″4″ squares (see the SINFONI panel in Figure 1). For LAB02, we employed a two-point dither pattern in the north-south direction, resulting in a 8″4″ effective FOV (dot-dashed line in Figure 1). The total integration times for LAB01 and LAB02 are 6 hrs and 0.5 hrs, respectively, which consist of 5 or 10 min individual exposures depending on the sky condition. For the telluric correction and flux calibration, we observed four B or G stars every night before or after the science targets with wide range of airmass.
We reduce the SINFONI data using the ESO pipeline. Dark current and sky background are removed from each science frame by subtracting the pseudo-sky frame, which is constructed from the average of the two science frames bracketing each science frame. Then, we flat-field the data and correct for bad pixels. Because we will compare the velocity centers of the Ly and H lines, accurate wavelength calibration is critical. We compare the wavelength solution obtained from the OH sky lines in the science frames to that from the daytime arc lamps. The arc lamp wavelength calibration error arising from instrument flexure can be as large as 1.5Å, depending on the airmass (which ranges up to 2.0). Therefore, we adopt the OH sky line wavelength calibration, whose error is typically 0.1Å (0.04 pixel) for each science frame. Using this wavelength solution, we constructed 3D data cubes from the 2D spectra after correcting spatial distortion. Because it is not possible to identify/centroid the sources in individual exposures, we align them according to the dither offsets within each observing block (OB). The spatial offsets between OBs are calculated from the PSF calibration frames and are typically small ( 01). When combining the data cubes, we adopt an iterative -clipping algorithm to reject possible outliers and produce the “sigma cubes” that represent the standard deviation of the adopted pixels. Because no stellar continuum is detected, we subtract the median sky values from each wavelength plane to avoid the strong variation of global sky background. Finally, we flux-calibrate the cubes using the broad-band magnitudes of standard stars. Atmospheric absorption is minimal at H due to our choice of survey redshift, so we do not apply a telluric correction.
3. Results
3.1. Redshift Confirmation with Ly and H Lines
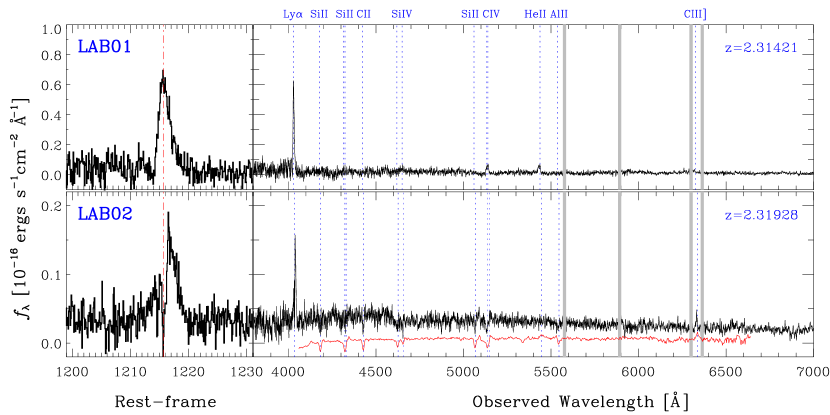
We spectroscopically confirm the redshifts ( 2.31 – 2.32) of the two Ly blobs using both the Ly and H emission lines. Figure 1 shows the two Ly blobs at various wavelengths: U, continuum-subtracted Ly line, B, K, Spitzer IRAC 3.6µm, and HST F606W images overlain with the Ly contours (left six panels). The archival ground-based images (U, B, and K), the Spitzer IRAC images, and the HST images are obtained from the Multiwavelength Survey by Yale-Chile (MUSYC; Gawiser et al., 2006a), the Spitzer IRAC/MUSYC Public Legacy in E-CDFS survey (SIMPLE; Damen et al., 2010), and the Galaxy Evolution from Morphology and SEDs (GEMS; Rix et al., 2004) survey, respectively. In the right panels, we show the enlarged HST images and SINFONI H intensity maps that are collapsed in the wavelength direction centered at 2.1746µm ( 66Å) and 2.1788µm ( 42Å) for the two blobs, respectively. For the SINFONI image of LAB01, we show only data taken in the best seeing ( 03) to be comparable with the HST resolution.
Interestingly, in the HST rest-frame UV images, both Ly blobs include multiple galaxies and/or fragments, some of which appear to be interacting (see also Colbert et al., 2006). A few are also detected in H, indicating that they lie at the same redshift. In Yang et al. (2010), we found that the number density and the field-to-field variance of Ly blobs are consistent with their occupying massive dark matter halos ( ) that probably evolve into those of typical galaxy clusters today. Thus, while some clumps/fragments could be part of a one large galaxy (e.g., Labbé et al., 2003; Elmegreen et al., 2009), we speculate that others may merge and evolve into present-day brightest cluster galaxies.
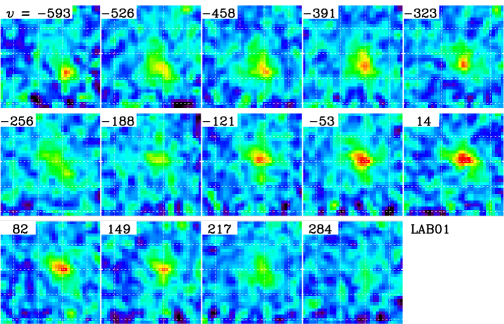

Figure 2 shows the 1D Ly spectra extracted from 1″24 and 2″24 MagE slits for LAB01 and LAB02, respectively. In addition to strong Ly emission, LAB01 also has C IV 1549 and He II 1640 emission lines, implying the presence of hard ionizing sources (e.g, Prescott et al., 2009; Scarlata et al., 2009). We defer analysis of these lines and their relative strengths to a future paper (Y. Yang et al. 2011, in preparation), which focuses on the multi-wavelength properties of the full blob survey and the implications for the sources of blob emission. LAB02 has several interstellar absorption lines that we use in §3.3 to help constrain the kinematics of gas around the embedded galaxies.
In contrast to the optically thick and spatially extended Ly emission, we can use the optically thin, more spatially concentrated H emission to make an independent determination of the blob redshift from the galaxies embedded in the centers of the blobs. We extract the H spectra from a 2″2″ aperture in the SINFONI cubes. Figure 3 shows the resulting spatially integrated H profiles within the blobs. The LAB01 H spectrum includes all 6 hr exposures combined to obtain higher S/N and total flux. Note that whenever we show individual Ly or H spectra (Figures 2 and 3), we adopt different aperture sizes that maximize the S/N. On the other hand, we use the same aperture when comparing the Ly and H lines directly (§3.2).
For LAB01, we focus on the brighter SW component of the blob. The excellent seeing of our SINFONI observation ( 0.3″) allows us to spatially resolve two embedded galaxies (A and B) in the SW part of the blob (hereafter LAB01A and LAB01B; Fig. 1)111While it is possible that these two components could be H II regions or star-forming clumps in a single galaxy, it is unlikely given that their projected separation is 5 kpc and the velocity offset is 440 km s-1.. These two galaxies are also kinematically separated as shown in the SINFONI H channel map (Figure 4), a series of H intensity maps constructed by stepping through the 3D SINFONI data cubes in increments of 70 km s-1. Galaxy B shows an apparent velocity shear of 250 km s-1, suggesting disk rotation, while galaxy A has no obvious velocity structure. In their spatially integrated H spectra, these two galaxies have the nearly same redshift, = 2.31421 0.0001 and = 2.30928 0.0001, a separation of = 0.0049 or (A–B) = 440 km s-1. This relative velocity is a poor estimate of the velocity dispersion of the halo in which these galaxies are embedded. Nevertheless, it is consistent with the expected for a massive, halo.
LAB02 also contains several continuum sources in the HST UV images (labeled as A–D). At least one of the brightest sources (LAB02A) is detected in the SINFONI H image. With SINFONI, we marginally detect the two sources (B+C) blended in the HST image. It is also possible that galaxy D is blended with the much brighter galaxy A in the IFU data. We are not able to reliably extract H profiles from galaxies (B+C) and D because of the shallow exposure (30 min) and insufficient spatial resolution. The integrated spectrum of LAB02 is dominated by the brightest galaxy A, for which we measure the = 2.31928 0.0001. We summarize the properties of H lines in Table 1.
While it is possible that the H detections include some extended gas, the centers of the emission coincide with the galaxies resolved in the HST image and are likely to originate there. Therefore, in the following section, we compare the Ly and H profiles along the LOS toward these embedded galaxies. There are small astrometry offsets (0.2″) between HST UV images and SINFONI H maps (right panels in Figure 1). While it is likely that this mismatch arises from the astrometric calibrations of SINFONI, which rely entirely on blind offsets, we extract the Ly and H spectra from the same aperture, accepting the current astrometric solution. Changing the relative position of extraction aperture (green boxes) for Ly and H does not affect any of the conclusions in this paper.
We show the selected extraction apertures (small green boxes) in Figure 1. In LAB01, we extract the spectra along the LOS toward galaxy A, because the peak of Ly map coincides with galaxy A. While galaxies A and B are well-resolved in the H image, the spectrum extracted from the sight-line to LAB01A (green box in Fig. 1) is slightly contaminated with light from galaxy B. Therefore, we simultaneously fit the profile with a total of six components (three for each galaxy) and remove the galaxy B components when comparing the H and Ly line centers in the following section.
3.2. Comparison Between Ly and H Lines
The Ly profile emerging from the blob should be complicated, a mixture of the bulk motions of the gas and geometry. For the details of Ly radiative transfer, we refer readers to the literature (e.g., Ahn et al., 2001, 2002; Dijkstra et al., 2006a; Verhamme et al., 2006; Kollmeier et al., 2010; Faucher-Giguere et al., 2010). In this section, we compare the Ly and H lines to constrain the gas kinematics within the blobs. More specifically, we measure the velocity shift of the Ly line relative to the H line center to distinguish between any infall and outflow of the IGM relative to the blob’s systemic velocity. Once we measure this first-order kinematic diagnostic (i.e., any blueshift or redshift of the Ly line), we discuss the detailed Ly and H profiles in §4, comparing them with radiative transfer calculations to determine the velocity of the dominant bulk motion.
To illustrate what we expect from this experiment, we first consider the simplest geometric case: a galaxy surrounded by a spherically symmetric gas cloud that is static, collapsing, or expanding (Dijkstra et al., 2006a; Verhamme et al., 2006). Here we assume that the H line arises from the embedded galaxy, as we do not detect extended H emission, and that the Ly line originates either in the same region of the galaxy before eventually escaping the surrounding cloud or in the cloud itself. Thus this blob will be observed as a point source in H, but as an extended source in Ly. Note that the Ly and H spectroscopy is along the LOS toward the central galaxy. While H from the galaxy can escape the surrounding gas without suffering absorption, Ly photons from the galaxy and from gas along the LOS will be resonantly scattered many times until their frequencies are right for escaping the cloud, a condition dependent on the bulk motions of gas along the LOS.
Because the cloud is optically thick to the Ly line, Ly photons on the Doppler wings should escape the cloud through random scatterings in the frequency domain. If the surrounding gas is static, the Ly line will have a double-peaked profile, while the optically thin H photons will escape without any radiative transfer effects. If the cloud is collapsing, Ly photons within the cloud on the red side of double-peaked profile will see higher optical depth due to the LOS infalling gas, and the red peak will be depressed. If the gas is outflowing, the blue side of the profile will be more diminished.
Therefore, if there is gas infall, the Ly profile will be asymmetric and blueshifted against the H line due to radiative transfer in the optically thick medium, but the corresponding H line profile should be symmetric. For outflowing gas, the Ly will be redshifted against the symmetric H line. The amount of shift depends on various parameters such as infall/outflow velocity and optical depth. Note that one cannot determine whether the Ly line is redshifted or blueshifted against the background velocity field unless there is a optically thin reference line, i.e., H.
The actual geometry of the system is likely to be more complicated (§4). Yet the blue- or redshift of the Ly photons relative to the systemic velocity will occur as they make their way out of the system, as long as they encounter optically-thick gas that is infalling or outflowing along the LOS (Dijkstra et al., 2006a). In other words, we are studying the bulk motion of gas along the pencil beam toward the embedded galaxies when we compare the Ly and H profiles extracted from this sight-line. In principle, it is even possible to compare the velocity offsets between extended Ly and extended H lines in two dimensions (i.e., H and Ly screens) with much deeper H spectroscopy and optical IFU data.
In summary, the basic assumptions for our simple test using the velocity offset between the Ly and H lines are:
-
1.
Ly should go through an optically thick column of gas (either infalling or outflowing) to escape.
-
2.
H represents the systemic velocity of the entire system, and gas is moving (infalling or outflowing) relative to this center.
With these assumptions in mind, we now consider the Ly and H line profiles for our two Ly blobs. We then examine these assumptions further and discuss how to overcome their limitations in §4.
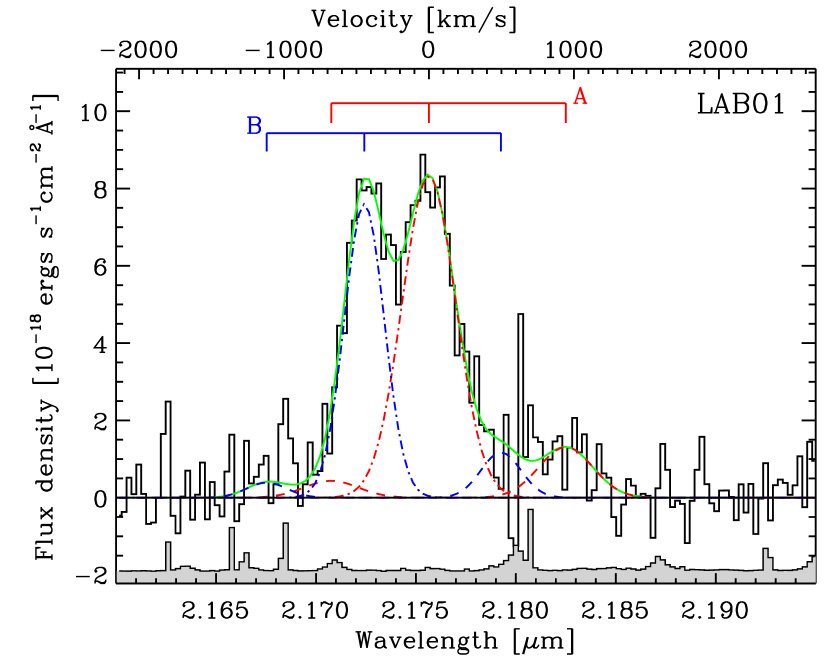
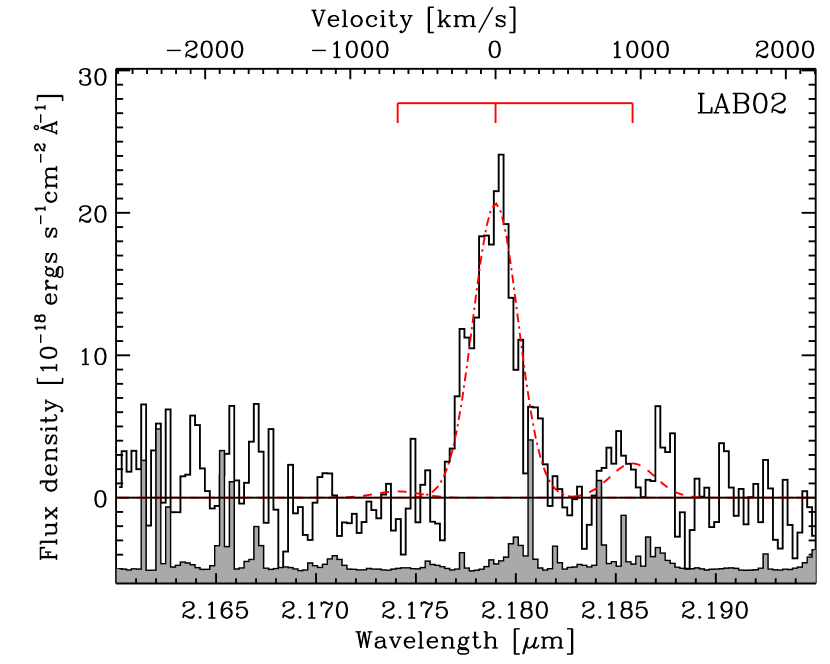
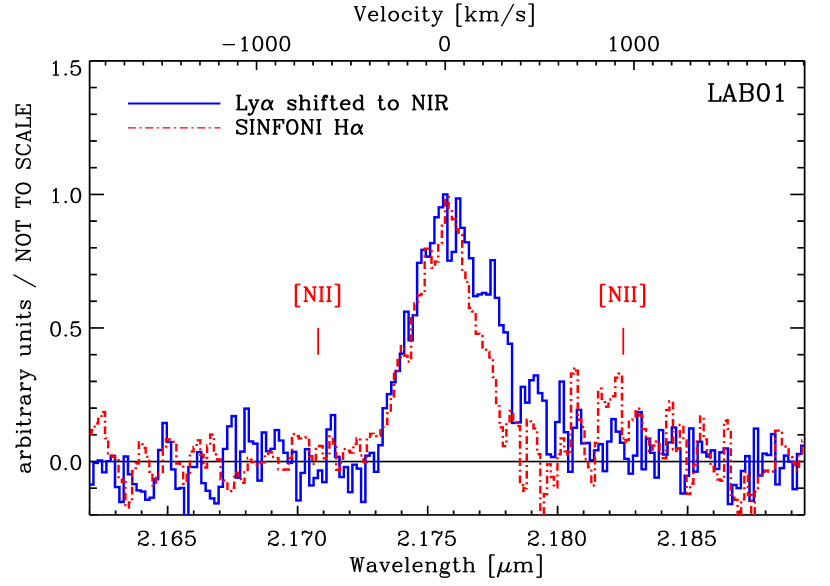
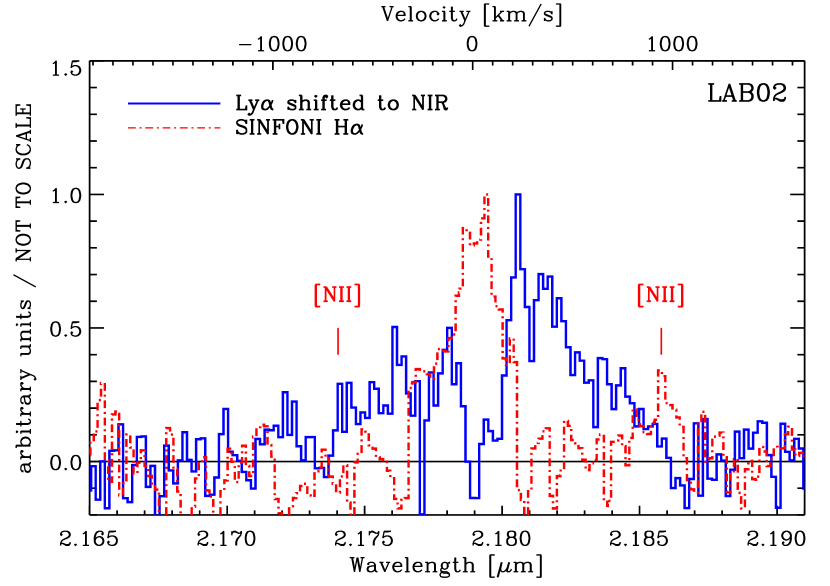
We show the Ly and H profiles for the two Ly blobs in Figure 5. We shift each blob’s Ly profile into its H frame using = . We place both blobs in the same velocity frame using the redshifts obtained from H. Note that all the optical and NIR wavelengths are converted to vacuum wavelengths and corrected to the heliocentric frame. In both blobs, the Ly line is broader than the H line and has a more complicated structure (i.e., an asymmetric profile or multiple peaks), implying that the Ly lines do experience resonant scattering.
LAB01 has a Ly line width of = 520 40 km s-1 whose peak coincides with that of the H line. While the blue side of the Ly profile ( km s-1) agrees well with that of the H line, it has an extended red wing up to at least +600 km s-1. It is not clear whether this red wing arises from the several poorly-resolved red peaks. LAB02 shows a double peaked Ly profile with a stronger red peak, which is often observed in high- Ly galaxies (Tapken et al., 2007). LAB02’s Ly profile is broad, extending from km s-1 to 1000 km s-1. The stronger red peak itself has a line width of 420 km s-1. LAB02’s Ly profile also has a sharp absorption feature (or lack of emission) at km s-1 that coincides with its H line center.
To quantitatively measure the velocity offset between the Ly and H lines, we must first determine each line’s center. For the asymmetric Ly line, we measure the wavelength at the peak flux, which is consistent with the methodology of Steidel et al. (2004, 2010). Because the Ly profile is noisy, we smooth the spectrum with a boxcar filter of 3 spectral pixels ( 40 km s-1) and measure the wavelength of the brightest flux. For the symmetric H profiles in both blobs, we fit the spectrum with a Gaussian profile including the neighboring [N II] lines. We fit three Gaussian components with the same velocity width, but different intensities, centered at 6563Å (H), 6549Å, and 6583Å ([N II]). As mentioned earlier, due to the slight contamination of LAB01A’s spectrum with light from LAB01B, we simultaneously fit the observed H profile for both galaxies and show only the spectrum of galaxy A in Figure 5.
| Target | (H) | (H) | |||
|---|---|---|---|---|---|
| (erg s-1) | (km s-1) | (km s-1) | |||
| CDFS-LAB01 | A | 2.31421 0.0001 | 1.16 0.06 | 184 9 | 0 20 |
| B | 2.30928 0.0001 | 0.78 0.05 | 134 8 | … | |
| CDFS-LAB02 | A | 2.31928 0.0001 | 2.42 0.11 | 152 5 | 230 30 |
The velocity offset, is defined as the difference between the H line center and the Ly peak wavelength. We find a negligible offset between Ly and H ( 20 km s-1) for LAB01A, and an offset, 30 km s-1, for LAB02A. These are smaller than those of LBGs, which range from +150 km s-1 up to +900 km s-1 with an average of +450 km s-1 (Steidel et al., 2010). Among this LBG sample, only 12% of galaxies have smaller than 225 km s-1, thus the probability of finding 230 km s-1 for two Ly blobs by chance is rather small (1.5%) if our Ly–H offsets are drawn from the same distribution222We note that it is not clear whether the distribution of in Steidel et al. (2010) is representative of all LBGs given its sharp break around 300 km s-1..
For our two blobs, is either consistent with zero (LAB01) or somewhat redshifted (LAB02). Therefore, according to the simplest picture, we find no evidence for a blueshift and thus for gas infall in either blob. The absence of a redshifted in LAB01 does not necessarily exclude an outflow, because LAB01A’s Ly profile has an extended red wing and/or multiple red peaks, which can be outflow signatures. If we interpret the observed as a proxy for outflow velocity, then, at face value, any outflows in LAB01 and LAB02 are weaker than those typical of LBGs. In §4, we further consider the implications of our results using radiative transfer calculations.
3.3. Interstellar Absorption Lines
In addition to the Ly emission line, the optical spectrum of LAB02 shows several absorption lines (Figure 2). These absorption lines provide an opportunity to constrain the kinematics of cold gas on the near side of the galaxy, i.e., between the galaxy and observer, and thus to verify the detection of the modest outflow signature in the previous section. Note that the systemic velocity from H spectroscopy is again critical.
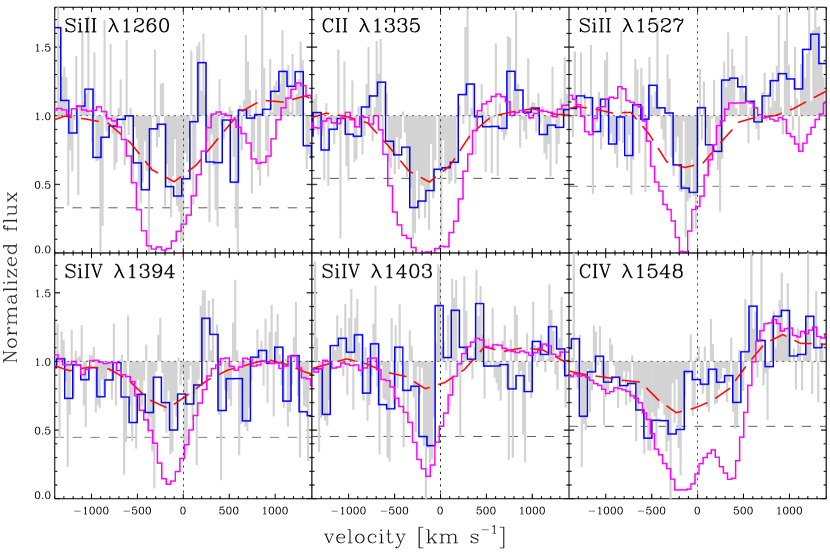
Because the S/N of the continuum in the LAB02 spectrum is very low, we first re-bin the spectrum by four spectral pixels, which worsens the resolution of the final velocity bins to 90 km s-1. Figure 6 shows the velocity profiles of six absorption lines whose peaks were detected at the 3 level in the rebinned spectrum. We show the absorption profiles of three low-ionization interstellar lines (Si II 1260.42, C II 1334.53, and Si II 1526.72) and three high-ionization lines (Si IV 1393.76, 1402.77 and C IV 1548.20). For comparison, we also plot the composite LBG spectrum () from Shapley et al. (2003) and the individual spectrum of MS1512-cB58 () which is one of the apparently brightest LBG whose light is amplified due to the gravitational lensing (Pettini et al., 2000). Although the S/N is low, the velocity ranges spanned by LAB02’s absorption lines roughly agree with these two templates.
We find that all interstellar absorption lines are blueshifted against the systemic velocity, indicating that the intervening gas is outflowing, which is consistent with the observed outflow signature discussed in the last section. To estimate the velocity of the outflowing material, we measure how much the centroids of these velocity profiles are offset from the H line: . While the high-ionization lines (Si IV 1393, 1402 and C IV 1548) have the highest S/N, they are known to be contaminated with broader absorption features arising from stellar winds from massive stars (Leitherer et al., 1995; Shapley et al., 2003). Therefore, we measure the centroid velocities () using the three low-ionization lines. Two low-ionization lines (C II 1334 and Si II 1526) have 100 km s-1 to 200 km s-1. (It is difficult to reliably measure the centroid of the Si II 1260 line.) The absorption profile of C II 1334 might extend up to 600 km s-1 blueward, although its low S/N precludes a reliable measurement. If we adopt its centroid velocity as an outflow velocity, then it is similar to that of LBGs, which average = km s-1, but can be as large as 500 km s-1 (Steidel et al., 2010).
3.4. Velocity Dispersions of Embedded Galaxies
By fitting Gaussian profiles to the integrated H profiles (Figure 3), we obtain the velocity dispersions, = 184 9 km s-1 and 134 8 km s-1 for the LAB01A and LAB01B, respectively. For LAB02A, = 152 5 km s-1. These velocity dispersions are corrected for the instrumental resolution ( 32 km s-1).
The internal velocity dispersions of the embedded galaxies ( = 130 – 190 km s-1) are high compared to those of star-forming galaxies at . Erb et al. (2006) find that LBGs at have an average of = 108 km s-1 with a standard deviation of 41 km s-1, excluding galaxies with AGNs. Our lowest km s-1 corresponds to the upper 30% percentile of their distribution. In particular, there is only one galaxy in the Erb et al. (2006) sample that has higher than LAB01A does ( = 190 km s-1).
4. Discussion
In this section, we compare the observed Ly profiles and their offsets from the H lines with the predictions of Ly radiative transfer (RT) calculations (Dijkstra et al., 2006a; Verhamme et al., 2006, 2008, hereafter D06, V06 and V08, respectively). To test the scenario in which gas in the surrounding cloud cools and flows toward the blob center, we compare our data with the spherical collapse model in D06. For the picture in which gas outflows from the embedded galaxies in the blob’s core, we employ the expanding shell model investigated by V06. Note that these RT calculations assume that infall and outflow occur in spherical symmetry, in a collapsing sphere for the inflow model and in an expanding shell for the outflow model. As we argued previously, even such simple models should reproduce the general behavior of the Ly profile as long as the basic assumptions listed in §3.2 are valid. In §4.3, we examine those assumptions in detail and discuss the future work required to overcome these limitations.
4.1. Absence of Blueshift: No Gas Infall?
In §3.2, we found that the Ly lines of the two blobs are not blueshifted relative to the H line centers within the measurement uncertainties. The absence of a blueshift rules out the simplest infall model where a spherical gas cloud is collapsing onto a central Ly source or where the collapsing cloud itself is emitting Ly photons. In this model, Verhamme et al. (2006) and Dijkstra et al. (2006a) study Ly radiative transfer, which depends on various parameters such as the location of the Ly source, the infall velocity field, the column density of neutral hydrogen (), and the Doppler parameter representing the thermal and turbulent motion of the gas (see Fig. 4 and 7 in D06 or Fig. 5–7 in V06). The key prediction of these RT calculations is that the Ly spectrum is double peaked with an enhanced blue peak, producing an effective blueshift of the Ly profile. While the blue peak might be suppressed by the intervening IGM after the Ly photons escape the collapsing cloud (Dijkstra et al., 2006b), this effect is unlikely to be significant here because the mean transmission blueward of Ly should be relatively high at : 0.8 (McDonald et al., 2001), where represents Ly optical depth.
The blueshift of Ly photons against the systemic velocity should arise as long as 1) there are infall motions along the LOS and 2) Ly photons on their way out of the system encounter optically thick gas with a velocity opposite to their propagation direction (Dijkstra et al., 2006a). One possible way to hide a blueshift in this simple infall model would be if the infalling gas is made optically thin by an ionizing source or has low enough column density so that the Ly photons do not suffer resonant scattering (see Fig. 11 in D06 or Fig. 6 in V06). In this case, we should still see nearly symmetric Ly profiles or extended blue wings, neither of which is observed in our Ly profiles. Therefore, we rule out this simple gas infall scenario for our two Ly blobs.
In contrast to this simple model, the actual situation is likely to be more complex and the bulk motion of gas may not be spherically symmetric. For example, the H detections suggest that the galaxies embedded in the blobs are forming stars, which could generate mechanical feedback into the surrounding gas cloud. There is also ample evidence for galactic scale outflows in star-forming galaxies at = 2–3 (e.g., Steidel et al., 2010). Thus, one could imagine that even if gas infall takes place over larger radii (up to 50 kpc), the innermost part of the gas cloud, close to the galaxies, could be strongly affected by outflows similar to those observed in other star-forming galaxies at . In this case, the emerging Ly profile will be more sensitive to the core of the blob, presumably the densest part of the IGM, than to the gas infall. As a result, it might be difficult to detect the infalling gas by measuring the Ly line shift. More simulations are required to test whether generic galactic scale outflows could affect gas infall and whether infall and outflows can coexist. This kind of more realistic model has not been considered yet in RT calculations, so its spectral signatures (if any) are unknown.
The other caveat is that the inflow might occur along filamentary streams (Kereš et al., 2005; Dekel et al., 2009) and their covering factor could be small (Faucher-Giguere & Keres, 2010) such that we might completely miss the infall signatures in a particular LOS. We will further discuss this caveat in §4.3.1.
4.2. Small : Weak or No Outflow?
In §3.2, we found that the offset of the Ly line relative to H was either consistent with zero (LAB01) or redshifted (LAB02). The existence of a modest outflow in LAB02 was further supported by the low-ionization absorption line shifts discussed in Section 3.3. The absence of a redshifted in LAB01 does not necessarily exclude an outflow because of its extended Ly profile toward the red. Here we compare the Ly profiles of our blobs with the RT outflow models of Verhamme et al. (2006, 2008) to interpret the velocity offset in a more sophisticated manner.
In these radiative transfer calculations, the Ly–H velocity offset is modulated entirely by the radiative transfer of Ly photons through a continuous medium within the shell. Another possibility, which we discuss in Section 4.3.3, is that the gas around the galaxy is clumpy and that the bulk motions of these clumps primarily modulate the emerging Ly profile (Steidel et al., 2010). In the following section, we constrain the outflow velocity or “wind velocity” from the embedded galaxies using the RT calculations. It is then possible to ask whether such an outflow is energetic enough (i.e., the expansion velocity is large) to expel/launch gas out to larger radii, thus creating the extended Ly emission observed as a blob with a typical size of 50kpc.
4.2.1 Comparison with Radiative Transfer Models
To connect with an outflow velocity, we compare each blob’s Ly profile with a model with an expanding shell geometry. Such a geometry would arise in the simple “superwind” or “hyperwind” model for Ly blobs proposed by Taniguchi & Shioya (2000) and Taniguchi et al. (2001). In this scenario, supernova explosions or stellar winds following an intense starburst in galaxies develop into a so-called superbubble. If the kinetic energy deposited into the surrounding gas overcomes the gravitational potential energy of the galaxy, the gas clouds are blown out into intergalactic space as a superwind (e.g., Heckman et al. 1990). The gas blown out from the galaxies forms a shell, and the Ly photons are scattered from this expanding shell (with ), escaping preferentially by the scattering from the backside. In contrast, the H lines provide the systemic velocity of the star forming region.
V06 and V08 demonstrate that the radiative transfer of Ly in this simple shell geometry is able to explain a wide range of observed Ly profiles. V08 classified Ly profiles into three categories: (1) single-peaked asymmetric profile with an extended red wing, (2) profile with double peaks separated by sharp absorption at km s-1, and (3) asymmetric profile with bluer bump(s). Thanks to the H line, which provides the velocity center, we can determine that LAB01 and LAB02 correspond to (1) and (2) without ambiguity.
We start with LAB01, which has an asymmetric Ly profile without any obvious blue peaks, but with an extended red wing and/or multiple red peaks (i.e., category 1 above). V06 show that a blue peak ( 0 km s-1) is strongly suppressed with increasing () ratio, i.e., when the bulk outflow motion becomes more important than the thermal and turbulent motion of the shell gas. The resonant scattering in the expanding shell produces mainly two red peaks depending on the paths of the emergent photons: one peak near the line center ( 0 km s-1) and another at , corresponding to photons that experience zero or one back-scattering from the receding shell, respectively. Here, the back-scattering of a photon means that it travels across the empty interior before re-entering the shell at a different location. Thus the location of the second red peak is a useful diagnostic for the outflow velocity.
Because of the degeneracy between many model parameters (, , , ), constraining the outflow velocity well requires fitting the spectra directly to the RT calculations. We do not have the means to do that here, so we estimate for LAB01 from how much its red Ly peaks are redshifted against its H line center. If is sufficiently large ( cm-1), the second red peak becomes larger and merges with the first red peak, so that the stronger red peak measures 2 (see Fig. 1 of V08). If this case applies here, our 0 km s-1 implies 0 km s-1, i.e., that the shell is static.
On the other hand, decreasing , increasing dust extinction (), and decreasing tends to strengthen the first red peak, so that the brighter peak is located at 0 and does not carry any information. In this case, the location of the weaker second peak provides an estimate of . As discussed in §3.1, the LAB01 profile’s extended red wing could be interpreted as multiple components (see Figure 5). If we adopt the small bump at 300 km s-1 as the second peak, the expansion velocity of the shell is 150 km s-1. Considering both cases, the outflow velocity in LAB01 could range from 0 km s-1 to 150 km s-1.
The Ly profile of LAB02 is most consistent with the double-peaked profile (i.e, category 2 above) of Verhamme et al. (2008), who claim that such profiles arise when the shell is almost static ( 0 km s-1). Due to the H measurement, there is no ambiguity about the location of the velocity center. Even if we consider only the red side of the profile and classify it as a single asymmetric profile like LAB01, we would obtain an outflow velocity only as high as /2 = 115 km s-1. The blueshifted centroids of the low-ionization absorption lines in LAB02 are also consistent with this inferred outflow velocity.
Therefore, if the expanding shell geometry is applicable to our two Ly blobs, we conclude that any outflows from the embedded galaxies are not strong ( 150 km s-1) compared to the values ( 500–1000 km s-1; see Eq. (2) of Taniguchi & Shioya, 2000) required by the extreme “superwind” or “hyperwind” scenarios (Taniguchi & Shioya, 2000; Taniguchi et al., 2001; Ohyama et al., 2003) to explain the large size ( kpc) and broad Ly linewidth (FWHM 1000 km s-1) of blobs.
The simple shell geometry assumed here has some physical motivation and has been explored by extensive RT calculations (e.g., V06 and V08). However, this model implies that the outflows are intermittent with a small duty cycle, contrary to the observation that outflows are seen in most star forming galaxies at high redshift. We note that if there is a continuous stream of outflowing material, it might lead to a different interpretation of kinematic signatures discussed above.
One other claim of an outflow in a blob was reported by Wilman et al. (2005) using IFU observations of the Ly line in Steidel’s Blob 2. Using an expanding shell model, they found that the central wavelength, i.e., velocity, of absorption systems on top of the underlying broad Ly profiles is coherent across the whole blob with a blueshift of 250 km s-1. Because the systemic velocity of the blob gas is unknown in their case, there are other possible interpretations of their data, even including an inflow (Dijkstra et al., 2006b). Bower et al. (2004) and Weijmans et al. (2009) found that Steidel’s Blob 1 has an extremely complicated velocity structure, including velocity shears around the embedded galaxies that can be interpreted as either outflow or rotation. It is interesting that all investigations of blob kinematics to date (in our CDFS-LAB01 and CDFS-LAB02, Steidel’s Blobs 1 and 2) suggest relatively small outflow velocities. Therefore, the large wind speeds required by super/hyper-wind models to explain the extended Ly emission are excluded. One way to reconcile the small outflows with the “superwind” model is to assume that the outflow was once more energetic and that the expanding shell has been broken up or slowed by contact with the surrounding IGM (Wilman et al., 2005; Weijmans et al., 2009). Clearly, constraining the kinematics of more Ly blobs is needed to address whether these small outflows are representative.
4.2.2 Summary
We conclude that the gas motion around the galaxies embedded in these Ly blobs is not consistent with models like the simple superwind picture (Taniguchi & Shioya, 2000) that assume a spherical shell geometry and a shell velocity exceeding 500 km s-1. Yet galactic scale outflows from star-forming galaxies at appear to be common. The outflow properties have been extensively studied by comparing the Ly velocity center with those of optically-thin nebular lines and/or interstellar absorption lines (e.g., Pettini et al., 2001; Shapley et al., 2003; Steidel et al., 2004, 2010). Recently, Steidel et al. (2010) show that Ly lines from LBGs are redshifted against H lines up to several hundreds km s-1 with an average of = +445 km s-1, while the interstellar absorption lines are blueshifted against the nebular lines by = km s-1.
While these and offsets are interpreted as an outflow signature, it is not clear how the absorbing material is distributed around galaxies. Were the gas blown out in a spherical shell, as in the superwind picture discussed above (e.g., Taniguchi & Shioya, 2000; Schaerer & Verhamme, 2008, V08), we could directly compare the observed of blobs and LBGs as a proxy for . The velocity offsets of our two Ly blobs, 0 km s-1 and 230 km s-1, are small in relation to LBGs (Steidel et al., 2010); of 41 LBGs at = 2 – 2.6 with both Ly and H spectroscopy, 88% have 225 km s-1. Therefore, any wind arising from galactic star formation has a lower expansion velocity in these two LABs than is typical of LBGs.
4.3. Caveats
We have adopted two basic assumptions in our analysis: that there is inflowing or outflowing gas in the LOS to the blob and that the H line marks the kinematic center of the blob gas. Here we examine how these assumptions may affect our conclusions and comment on the recent model suggested by Steidel et al. (2010) to explain the circum-galactic kinematics of LBGs.
4.3.1 Misalignment of Gas Flow to Line of Sight
We have assumed that there is gas inflowing or outflowing along the LOS to the embedded galaxies that lie in our spectroscopic slit. In this case, the observed Ly photons resonantly scatter in this optically thick infalling/outflowing material until escaping into the LOS of the observer. However, we do not know how the blob gas is distributed around the embedded galaxies nor whether it is clumpy or smooth.
For example, the gas flow may not be isotropic. As in bipolar outflows (e.g., Bland & Tully, 1988), a galactic-scale outflow may occur in the direction of minimum ISM pressure, which is typically perpendicular to the stellar disk. Or, the covering factor of the outflow material, the fraction of emission intercepted by the absorbers, could be rather high, at least 0.5 or up to unity as observed in nearby AGNs (Crenshaw et al., 2003). If gas accretion is taking place instead (Kereš et al., 2005, 2009), numerical simulations suggest that the infall may occur preferentially along filamentary streams (Dekel et al., 2009; Goerdt et al., 2010).
If the bulk motion of gas (either infalling or outflowing) happens to be mis-aligned with our LOS, we may underestimate or even fail to detect the relative velocity shifts. Therefore, it is critical to expand the Ly–H comparison to a larger sample to average over any geometric effects and obtain better constraints on the incidence, direction, speed, and isotropy of bulk gas motions in blobs. If no large values of are measured, even for a larger sample, outflows are unlikely to push the blob gas to larger radii, where it can be illuminated. On the other hand, an absence of blueshifted Ly lines would argue that infall is not dominant, at least not near the galaxies.
Recent cosmological simulations including radiative transfer (e.g., Faucher-Giguere et al., 2010) are now able to examine the statistics of blobs whose extended Ly emission arises from cooling radiation. These models can predict the range of gas accretion covering factors, surface brightness profiles and ratio of blue-to-redshifted Ly lines for blobs. A larger sample of blobs with measured Ly and H kinematics would provide a new test of these blob emission models.
4.3.2 Misidentification of Kinematic Center
Our second key assumption is that the H line marks the kinematic center of the surrounding gas, i.e., the terminus of any infall or the origin of any outflow. For an outflow, this assumption is reasonable because all possible causes of the outflow (e.g., stellar winds, SNe, or AGNs) lie in or about galaxies, as does the H line itself. For similar reasons, this assumption is likely to be valid for gas accretion (infall) into an embedded galaxy. However, it is possible that the accreting gas responds to the overall DM potential rather than to individual galaxies. Thus one could expect that detecting gas infall is more difficult than finding outflows using the technique presented in this paper.
To overcome this issue, it is critical to increase the sample size and measure how each blob’s Ly profile varies spatially. This experiment should be conducted along multiple sightlines using using different H sources found in the same blob. In principle, it is possible to compare the offsets between the extended Ly and and the extended H lines in two dimensions, i.e., between the H and Ly screens. Unfortunately, the H surface brightness is expected to be 3% – 10% of Ly depending on the energy source. Thus, it will be challenging to obtain 2D H IFU measurements in the near future.
Currently, our Ly–H comparison includes only a handful of Ly blobs because of the limited redshift range where NIR spectroscopy of the optically-thin nebular lines (e.g., H and the [O III] 5007 line) is allowed. However, future CO observations with ALMA will also provide the systemic velocity of the embedded galaxies, permitting this test to be expanded to a larger sample of Ly blobs.
4.3.3 Relationship to Clumpy, Circum-Galactic Medium of LBGs?
As we were writing this paper, Steidel et al. (2010, 2011) proposed a model for LBGs in which cool gas is distributed around the galaxy and accelerates radially outward with increasing galactocentric distance. They suggest that this blown-out material extends to 80 kpc, comparable to the typical size of Ly blobs, and that all LBGs would be classified as blobs if narrowband images were sensitive to surface brightness thresholds 10 times lower than typical of blob/emitter surveys (i.e., erg s-1 cm-2 arcsec-2). Is this “clumpy circum-galactic medium (CGM) model” consistent with the properties of our Ly blobs? Unlike in the RT models that we considered earlier, the gas in this model is composed of small clumps (e.g., Neufeld, 1991; Hansen & Oh, 2006).
A critical part of the Steidel et al. (2010) analysis involves stacking spectra of apparent galaxy-galaxy pairs at to obtain a high S/N interstellar absorption profile arising from the gas surrounding the foreground galaxies. Sightlines to the background galaxies provide information on the spatial distribution of circum-galactic gas as a function of the galactocentric distances. There are no background galaxies behind our two blobs, and even constraining the absorption profile in LAB02A was challenging. We do not detect a stellar continuum in LAB01A or LAB01B. As a result, we are unable to test whether the Steidel et al. (2010) LBG model could explain the kinematics of either of our Ly blobs. Nevertheless, we add a few qualitative comments here.
In the Steidel et al. (2010) model, Ly photons from the central galaxy are scattered off the surface of these discrete clumps; thus photons acquire a Doppler shift corresponding to the velocity of each clump. Ly photons can escape the system when they achieve velocity offsets large enough to take the photons off-resonance for any material between the last scattering clump and the observer. Therefore, the Ly line shift is due to bulk motions of the clumpy material rather than to radiative transfer effects where Ly photons experience numerous resonant scatterings before escaping the cloud (Section 4.2). The profiles of Ly and the low-ionization interstellar absorption lines are determined by the velocity field and covering fraction of these gas clumps. The apparent peak of Ly emission is modulated primarily by the clumps with : Ly emission is more redshifted and weaker for a wider velocity range spanned by the interstellar absorption. The velocity of the clumpy medium continually increases outward, unlike in the radiative transfer models discussed earlier, where the outflowing shell had one velocity. In the Steidel et al. (2010) model, the velocity range spanned by the absorption lines reflects that of the surrounding gas distribution, and the Ly–H offset does not represent the outflow velocity.
If this clumpy CGM model is applicable to blobs, then our observations of a small Ly–H offset could indicate an absence of neutral gas at rather than the weak gas outflow suggested by the RT models. One test would be to constrain the interstellar absorption line profile, which should extend to larger blueward velocities, but lack a component around km s-1, if the clumpy model is accurate. Clearly, higher S/N spectra to reliably measure these weak absorption lines are required.
The most notable outcome of the large spatial extent of a clumpy CGM around star-forming galaxies is diffuse Ly-emitting halos. Extended Ly emission has been detected in stacked narrowband images of LBGs by Hayashino et al. (2004). More recently, by stacking deeper narrowband Ly images of LBGs, Steidel et al. (2011) show that all classes of star-forming galaxies exhibit diffuse Ly halos out to projected radii of 80 kpc, regardless of their spectroscopic properties (i.e., either absorption or emission in Ly within a spectroscopic slit), although these halos are 10 lower surface brightness than typical blobs. The Ly surface brightness profiles of the stacked images are similar among LBG subclasses, with only different intensity scalings. Thus, Ly blobs may represent the most extreme example of galaxies with diffuse Ly halos. The key difference of the clumpy CGM model is that the diffuse Ly halo originates from Ly photons scattered from the galaxy’s H II region(s) rather than from external mechanisms such as photoionization by AGN, photoionzation by metagalactic UV background radiation, or via cooling radiation.
At this time, the applicability of the clumpy model to Ly blobs is unclear. Any comprehensive model must explain the differences between our blobs and LBGs: 1) a comparison of their number density and clustering properties suggests that blobs could occupy higher density environments (e.g., Yang et al., 2010), 2) the extended emission of blobs is typically 10 times brighter, 3) the Ly–H offset of our blobs is lower. The first and second differences could arise if the blobs host more massive galaxies and higher star formation rates than typical of star-forming galaxies at high-. It remains to be tested whether star formation in the galaxies embedded in blobs can produce enough Ly photons to explain the higher luminosity and surface brightness of Ly halos. The Ly–H offset is clearly tied in some way to the extended Ly emission of our blobs, as it is unusually low for both blobs compared to the offset distribution for LBGs (see also McLinden et al., 2010, for compact Ly emitters). It would interesting to check whether the LBG subclasses in Steidel et al. (2011) with brighter extended emission have smaller Ly–H offsets and weaker IS absorption at km s-1 than the others. For now, we note that the RT outflow model discussed in Section 4 adequately explains the sense and magnitude of both the Ly–H and the H-interstellar absorption line offsets in LAB02, whereas the Steidel et al. (2010) model would require this agreement of the offsets to be a coincidence. Of course, we are only able to perform this test using one blob at present. As stressed earlier, a larger sample of Ly–H offsets is required to test whether smaller Ly–H offsets are generic properties of Ly blobs.
5. Conclusions
Determining the source of Ly emission in extended nebulae at high redshift requires that we measure their gas kinematics with an optically-thin line such as H 6563, which, unlike the optically-thick Ly emission, is not much altered by radiative transfer effects and is more concentrated about the blob’s core. The comparison of the Ly and H line centers then constrains any infall or outflow of the Ly-emitting gas relative to the systemic velocity of the blob defined by H. We obtain optical and NIR spectra of the two brightest Ly blobs (CDFS-LAB01 and CDFS-LAB02) from the Yang et al. (2010) sample using the Magellan/MagE optical and VLT/SINFONI NIR spectrographs. Both the Ly and H lines confirm that these blobs lie at the survey redshift, (Å).
The blobs contain several H sources, which roughly coincide with galaxies in HST rest-frame UV images. The H detections of these embedded galaxies reveal large internal velocity dispersions ( km s-1). Furthermore, in the one system (LAB01) where we can reliably extract profiles for two different H sources, their velocity difference is 440 km s-1. The presence of multiple galaxies within the blobs, and those galaxies’ large velocity dispersions and large relative motion, supports the result of Yang et al. (2010) that Ly blobs inhabit massive dark matter halos that will evolve into rich clusters today. The embedded galaxies may represent the precursors of brightest cluster galaxies.
To determine whether the gas near the embedded galaxies is predominantly infalling or outflowing, we compare the Ly and H line centers. Ly is not offset ( = +0 km s-1) in LAB01 and redshifted by only +230 km s-1 in LAB02. These offsets are small compared to those of Lyman break galaxies, which average +450 km s-1 and extend to about +700 km s-1 (Steidel et al., 2010). By comparing the observed Ly profiles with simple radiative transfer models, we constrain the outflow velocity from the embedded galaxies to be 0 – 150 km s-1 in the two blobs. In LAB02, we detect low-ionization, interstellar absorption lines, including C II 1334 and Si II 1526, whose blueward shifts of km s-1 are consistent with the small outflow implied by the redward shift of Ly. Models with simple infall geometries or that require outflow velocities exceeding 500 km s-1 (e.g., super/hyper-winds discussed in Taniguchi & Shioya, 2000) are ruled out. Because of the unknown geometry of the gas distribution and the possibility of multiple sources of Ly emission embedded in the blobs, a larger sample and more sophisticated models are required to test other infall and outflow scenarios.
References
- Adams et al. (2009) Adams, J. J., Hill, G. J., & MacQueen, P. J. 2009, ApJ, 694, 314
- Adelberger et al. (2003) Adelberger, K. L., Steidel, C. C., Shapley, A. E., & Pettini, M. 2003, ApJ, 584, 45
- Ahn et al. (2001) Ahn, S.-H., Lee, H.-W., & Lee, H. M. 2001, ApJ, 554, 604
- Ahn et al. (2002) Ahn, S.-H., Lee, H.-W., & Lee, H. M. 2002, ApJ, 567, 922
- Bland & Tully (1988) Bland, J., & Tully, B. 1988, Nature, 334, 43
- Bochanski et al. (2009) Bochanski, J. J., et al. 2009, PASP, 121, 1409
- Bonnet et al. (2004) Bonnet, H., et al. 2004, The Messenger, 117, 17
- Bower et al. (2004) Bower, R. G., et al. 2004, MNRAS, 351, 63
- Colbert et al. (2006) Colbert, J. W., Teplitz, H., Francis, P., Palunas, P., Williger, G. M., & Woodgate, B. 2006, ApJ, 637, L89
- Crenshaw et al. (2003) Crenshaw, D. M., Kraemer, S. B., & George, I. M. 2003, ARA&A, 41, 117
- Damen et al. (2010) Damen, M., et al. 2010, arXiv:1011.2764
- Dekel et al. (2009) Dekel, A., et al. 2009, Nature, 457, 451
- Dey et al. (2005) Dey, A., et al. 2005, ApJ, 629, 654
- Dijkstra & Loeb (2009) Dijkstra, M., & Loeb, A. 2009, MNRAS, 400, 1109
- Dijkstra et al. (2006a) Dijkstra, M., Haiman, Z., & Spaans, M. 2006, ApJ, 649, 14
- Dijkstra et al. (2006b) Dijkstra, M., Haiman, Z., & Spaans, M. 2006, ApJ, 649, 37
- Eisenhauer et al. (2003) Eisenhauer, F., et al. 2003, Proc. SPIE, 4841, 1548
- Elmegreen et al. (2009) Elmegreen, D. M., Elmegreen, B. G., Marcus, M. T., Shahinyan, K., Yau, A., & Petersen, M. 2009, ApJ, 701, 306
- Erb et al. (2006) Erb, D. K., Steidel, C. C., Shapley, A. E., Pettini, M., Reddy, N. A., & Adelberger, K. L. 2006, ApJ, 646, 107
- Fardal et al. (2001) Fardal, M. A., Katz, N., Gardner, J. P., Hernquist, L., Weinberg, D. H., & Davé, R. 2001, ApJ, 562, 605
- Faucher-Giguere et al. (2010) Faucher-Giguere, C. -., Keres, D., Dijkstra, M., Hernquist, L., & Zaldarriaga, M. 2010, arXiv:1005.3041
- Faucher-Giguere & Keres (2010) Faucher-Giguere, C. -., & Keres, D. 2010, arXiv:1011.1693
- Francis et al. (2001) Francis, P. J., et al. 2001, ApJ, 554, 1001
- Gawiser et al. (2006a) Gawiser, E., et al. 2006, ApJS, 162, 1
- Geach et al. (2009) Geach, J. E., et al. 2009, ApJ, 700, 1
- Goerdt et al. (2010) Goerdt, T., Dekel, A., Sternberg, A., Ceverino, D., Teyssier, R., & Primack, J. R. 2010, MNRAS, 933
- Haiman & Rees (2001) Haiman, Z., & Rees, M. J. 2001, ApJ, 556, 87
- Haiman, Spaans, & Quataert (2000) Haiman, Z., Spaans, M., & Quataert, E. 2000, ApJ, 537, L5
- Hansen & Oh (2006) Hansen, M., & Oh, S. P. 2006, MNRAS, 367, 979
- Hayashino et al. (2004) Hayashino, T., et al. 2004, AJ, 128, 2073
- Hennawi et al. (2009) Hennawi, J. F., Prochaska, J. X., Kollmeier, J., & Zheng, Z. 2009, ApJ, 693, L49
- Humphrey et al. (2007) Humphrey, A., Villar-Martín, M., Fosbury, R., Binette, L., Vernet, J., De Breuck, C., & di Serego Alighieri, S. 2007, MNRAS, 375, 705
- Keel et al. (1999) Keel, W. C., Cohen, S. H., Windhorst, R. A., & Waddington, I. 1999, AJ, 118, 2547
- Kelson et al. (2000) Kelson, D. D., Illingworth, G. D., van Dokkum, P. G., & Franx, M. 2000, ApJ, 531, 159
- Kelson (2003) Kelson, D. D. 2003, PASP, 115, 688
- Kereš et al. (2005) Kereš, D., Katz, N., Weinberg, D. H., & Davé, R. 2005, MNRAS, 363, 2
- Kereš et al. (2009) Kereš, D., Katz, N., Fardal, M., Davé, R., & Weinberg, D. H. 2009, MNRAS, 395, 160
- Kollmeier et al. (2010) Kollmeier, J. A., Zheng, Z., Davé, R., Gould, A., Katz, N., Miralda-Escudé, J., & Weinberg, D. H. 2010, ApJ, 708, 1048
- Labbé et al. (2003) Labbé, I., et al. 2003, ApJ, 591, L95
- Legrand et al. (1997) Legrand, F., Kunth, D., Mas-Hesse, J. M., & Lequeux, J. 1997, A&A, 326, 929
- Leitherer et al. (1995) Leitherer, C., Robert, C., & Heckman, T. M. 1995, ApJS, 99, 173
- Marshall et al. (2008) Marshall, J. L., et al. 2008, Proc. SPIE, 7014,
- Matsuda et al. (2004) Matsuda, Y., et al. 2004, AJ, 128, 569
- Matsuda et al. (2006) Matsuda, Y., Yamada, T., Hayashino, T., Yamauchi, R., & Nakamura, Y. 2006, ApJ, 640, L123
- Matsuda et al. (2010) Matsuda, Y., et al. 2010, arXiv:1010.2877
- McDonald et al. (2001) McDonald, P., Miralda-Escudé, J., Rauch, M., Sargent, W. L. W., Barlow, T. A., & Cen, R. 2001, ApJ, 562, 52
- McLinden et al. (2010) McLinden, E. M., et al. 2010, arXiv:1006.1895
- Neufeld (1991) Neufeld, D. A. 1991, ApJ, 370, L85
- Nilsson et al. (2006) Nilsson, K. K., Fynbo, J. P. U., Møller, P., Sommer-Larsen, J., & Ledoux, C. 2006, A&A, 452, L23
- Ohyama et al. (2003) Ohyama, Y., et al. 2003, ApJ, 591, L9
- Ouchi et al. (2009) Ouchi, M., et al. 2009, ApJ, 696, 1164
- Palunas et al. (2004) Palunas, P., Teplitz, H. I., Francis, P. J., Williger, G. M., & Woodgate, B. E. 2004, ApJ, 602, 545
- Pettini et al. (2000) Pettini, M., Steidel, C. C., Adelberger, K. L., Dickinson, M., & Giavalisco, M. 2000, ApJ, 528, 96
- Pettini et al. (2001) Pettini, M., Shapley, A. E., Steidel, C. C., Cuby, J.-G., Dickinson, M., Moorwood, A. F. M., Adelberger, K. L., & Giavalisco, M. 2001, ApJ, 554, 981
- Prescott et al. (2009) Prescott, M. K. M., Dey, A., & Jannuzi, B. T. 2009, ApJ, 702, 554
- Rix et al. (2004) Rix, H.-W., et al. 2004, ApJS, 152, 163
- Saito et al. (2006) Saito, T., Shimasaku, K., Okamura, S., Ouchi, M., Akiyama, M., & Yoshida, M. 2006, ApJ, 648, 54
- Saito et al. (2008) Saito, T., Shimasaku, K., Okamura, S., Ouchi, M., Akiyama, M., Yoshida, M., & Ueda, Y. 2008, ApJ, 675, 1076
- Scarlata et al. (2009) Scarlata, C., et al. 2009, ApJ, 706, 1241
- Schaerer & Verhamme (2008) Schaerer, D., & Verhamme, A. 2008, A&A, 480, 369
- Shapley et al. (2003) Shapley, A. E., Steidel, C. C., Pettini, M., & Adelberger, K. L. 2003, ApJ, 588, 65
- Shapley et al. (2004) Shapley, A. E., Erb, D. K., Pettini, M., Steidel, C. C., & Adelberger, K. L. 2004, ApJ, 612, 108
- Smith & Jarvis (2007) Smith, D. J. B., & Jarvis, M. J. 2007, MNRAS, 378, L49
- Smith et al. (2008) Smith, D. J. B., Jarvis, M. J., Lacy, M., & Martínez-Sansigre, A. 2008, MNRAS, 389, 799
- Steidel et al. (2000) Steidel, C. C., Adelberger, K. L., Shapley, A. E., Pettini, M., Dickinson, M., & Giavalisco, M. 2000, ApJ, 532, 170
- Steidel et al. (2004) Steidel, C. C., Shapley, A. E., Pettini, M., Adelberger, K. L., Erb, D. K., Reddy, N. A., & Hunt, M. P. 2004, ApJ, 604, 534
- Steidel et al. (2010) Steidel, C. C., Erb, D. K., Shapley, A. E., Pettini, M., Reddy, N. A., Bogosavljević, M., Rudie, G. C., & Rakic, O. 2010, arXiv:1003.0679
- Steidel et al. (2011) Steidel, C. C., Bogosavljević, M., Shapley, A. E., Kollmeier, J. A., Reddy, N. A., Erb, D. K., & Pettini, M. 2011, arXiv:1101.2204
- Taniguchi & Shioya (2000) Taniguchi, Y. & Shioya, Y. 2000, ApJ, 532, L13
- Taniguchi et al. (2001) Taniguchi, Y., Shioya, Y., & Kakazu, Y. 2001, ApJ, 562, L15
- Tapken et al. (2007) Tapken, C., Appenzeller, I., Noll, S., Richling, S., Heidt, J., Meinköhn, E., & Mehlert, D. 2007, A&A, 467, 63
- Verhamme et al. (2006) Verhamme, A., Schaerer, D., & Maselli, A. 2006, A&A, 460, 397
- Verhamme et al. (2008) Verhamme, A., Schaerer, D., Atek, H., & Tapken, C. 2008, A&A, 491, 89
- Weidinger et al. (2005) Weidinger, M., Møller, P., Fynbo, J. P. U., & Thomsen, B. 2005, A&A, 436, 825
- Weijmans et al. (2009) Weijmans, A.-M., Bower, R. G., Geach, J. E., Swinbank, A. M., Wilman, R. J., de Zeeuw, P. T., & Morris, S. L. 2009, MNRAS, 1911
- White et al. (1997) White, R. L., Becker, R. H., Helfand, D. J., & Gregg, M. D. 1997, ApJ, 475, 479
- Wilman et al. (2005) Wilman, R. J., Gerssen, J., Bower, R. G., Morris, S. L., Bacon, R., de Zeeuw, P. T., & Davies, R. L. 2005, Nature, 436, 227
- Yang et al. (2006) Yang, Y., Zabludoff, A. I., Davé, R., Eisenstein, D. J., Pinto, P. A., Katz, N., Weinberg, D. H., & Barton, E. J. 2006, ApJ, 640, 539
- Yang et al. (2009) Yang, Y., Zabludoff, A., Tremonti, C., Eisenstein, D., & Davé, R. 2009, ApJ, 693, 1579
- Yang et al. (2010) Yang, Y., Zabludoff, A., Eisenstein, D., & Davé, R. 2010, ApJ, 719, 1654