Negative thermal expansion in ZnF2
Abstract
We have investigated temperature dependence of the lattice parameters and the unit cell volume of ZnF2 by neutron diffraction and have discovered negative thermal expansion (NTE) at low temperature. To understand why this simple compound exhibits NTE we performed first principle calculations. These calculations reproduce qualitatively the experimental temperature dependence of volume.
pacs:
61.05.fm, 65.40.DeThe negative thermal expansion (NTE) in solids has attracted the renewed attention of condensed matter scientists ever since Sleight and coworkers mary96 ; evans96 discovered that ZrW2O8 contracts over a wide temperature range of more than 1000 K. There are excellent review articles sleight98 ; evans99 on the NTE of this type of so-called framework materials. However NTE is known and has been studied experimentally and theoretically for a long time. Among these Si and Ge and other tetrahedrally bonded crystals at low temperature are classic examples gibbons58 ; sparks67 ; biernacki89 . The NTE is however limited in the low temperature range in these materials, whereas in higher temperature range they exhibit normal positive thermal expansion. There exists a more general review article barrera05 covering all types of materials that exhibit NTE. Here we report observation of NTE in diamagnetic ZnF2 with the simple rutile-type structure. We also report the results of our ab-initio calculations that reproduce qualitatively the observed NTE in ZnF2.
The transition-metal difluorides MF2 (M = V, Cr, Mn, Fe, Ni, Cu, Zn) with the rutile-type or distorted rutile-type crystal structure form an important class of materials with interesting magnetic and magneto-optic properties. In order to entangle magnetic effects from the lattice effects, the last of this series viz. the non-magnetic ZnF2 has often been used to study the background lattice effects. However even this non-magnetic solid showed anomalies in elastic constants at low temperatures not expected for ZnF2 with no temperature-induced phase transition. The observed softening of and at low temperature in ZnF2 had been interpreted as an incipient ferroelectric transition rimai77 ; boccara68 but has also been contested steiner94 ; vassiliou86 .
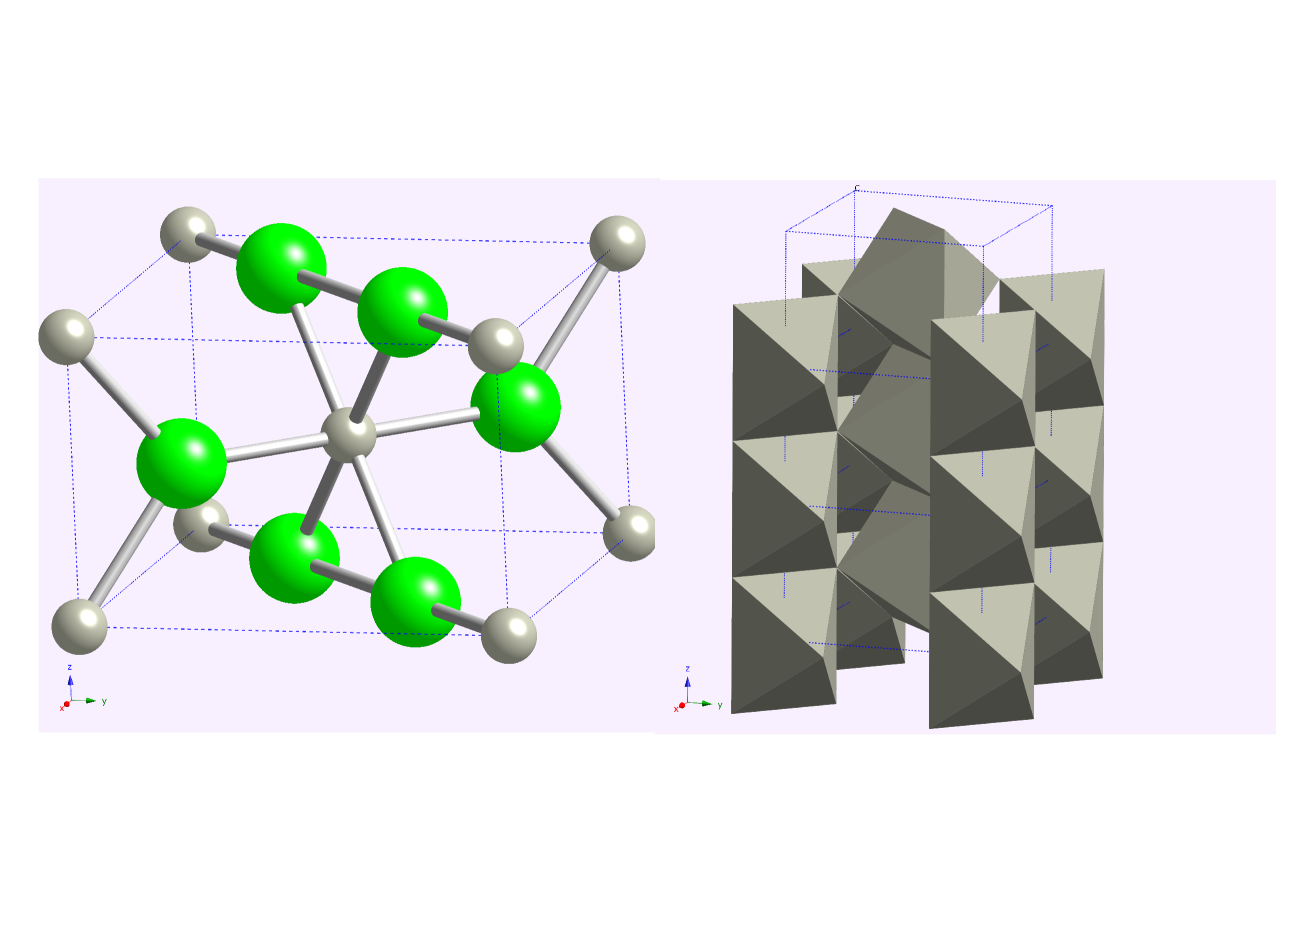
Figure 1 shows schematically the rutile-type crystal strucure of ZnF2 that crystallizes with the space group or . The unit cell is tetragonal with lattice parameter , Å at K and it contains two formula units . The two Zn2+ ions are located at positions and whereas four F- ions are located at , , , with the positional parameter . The Zn2+ ions are surrounded by six F- ions to form slightly distorted octahedra. The octahedra are edge linked along the -axis and corner-linked along crystallographic directions.
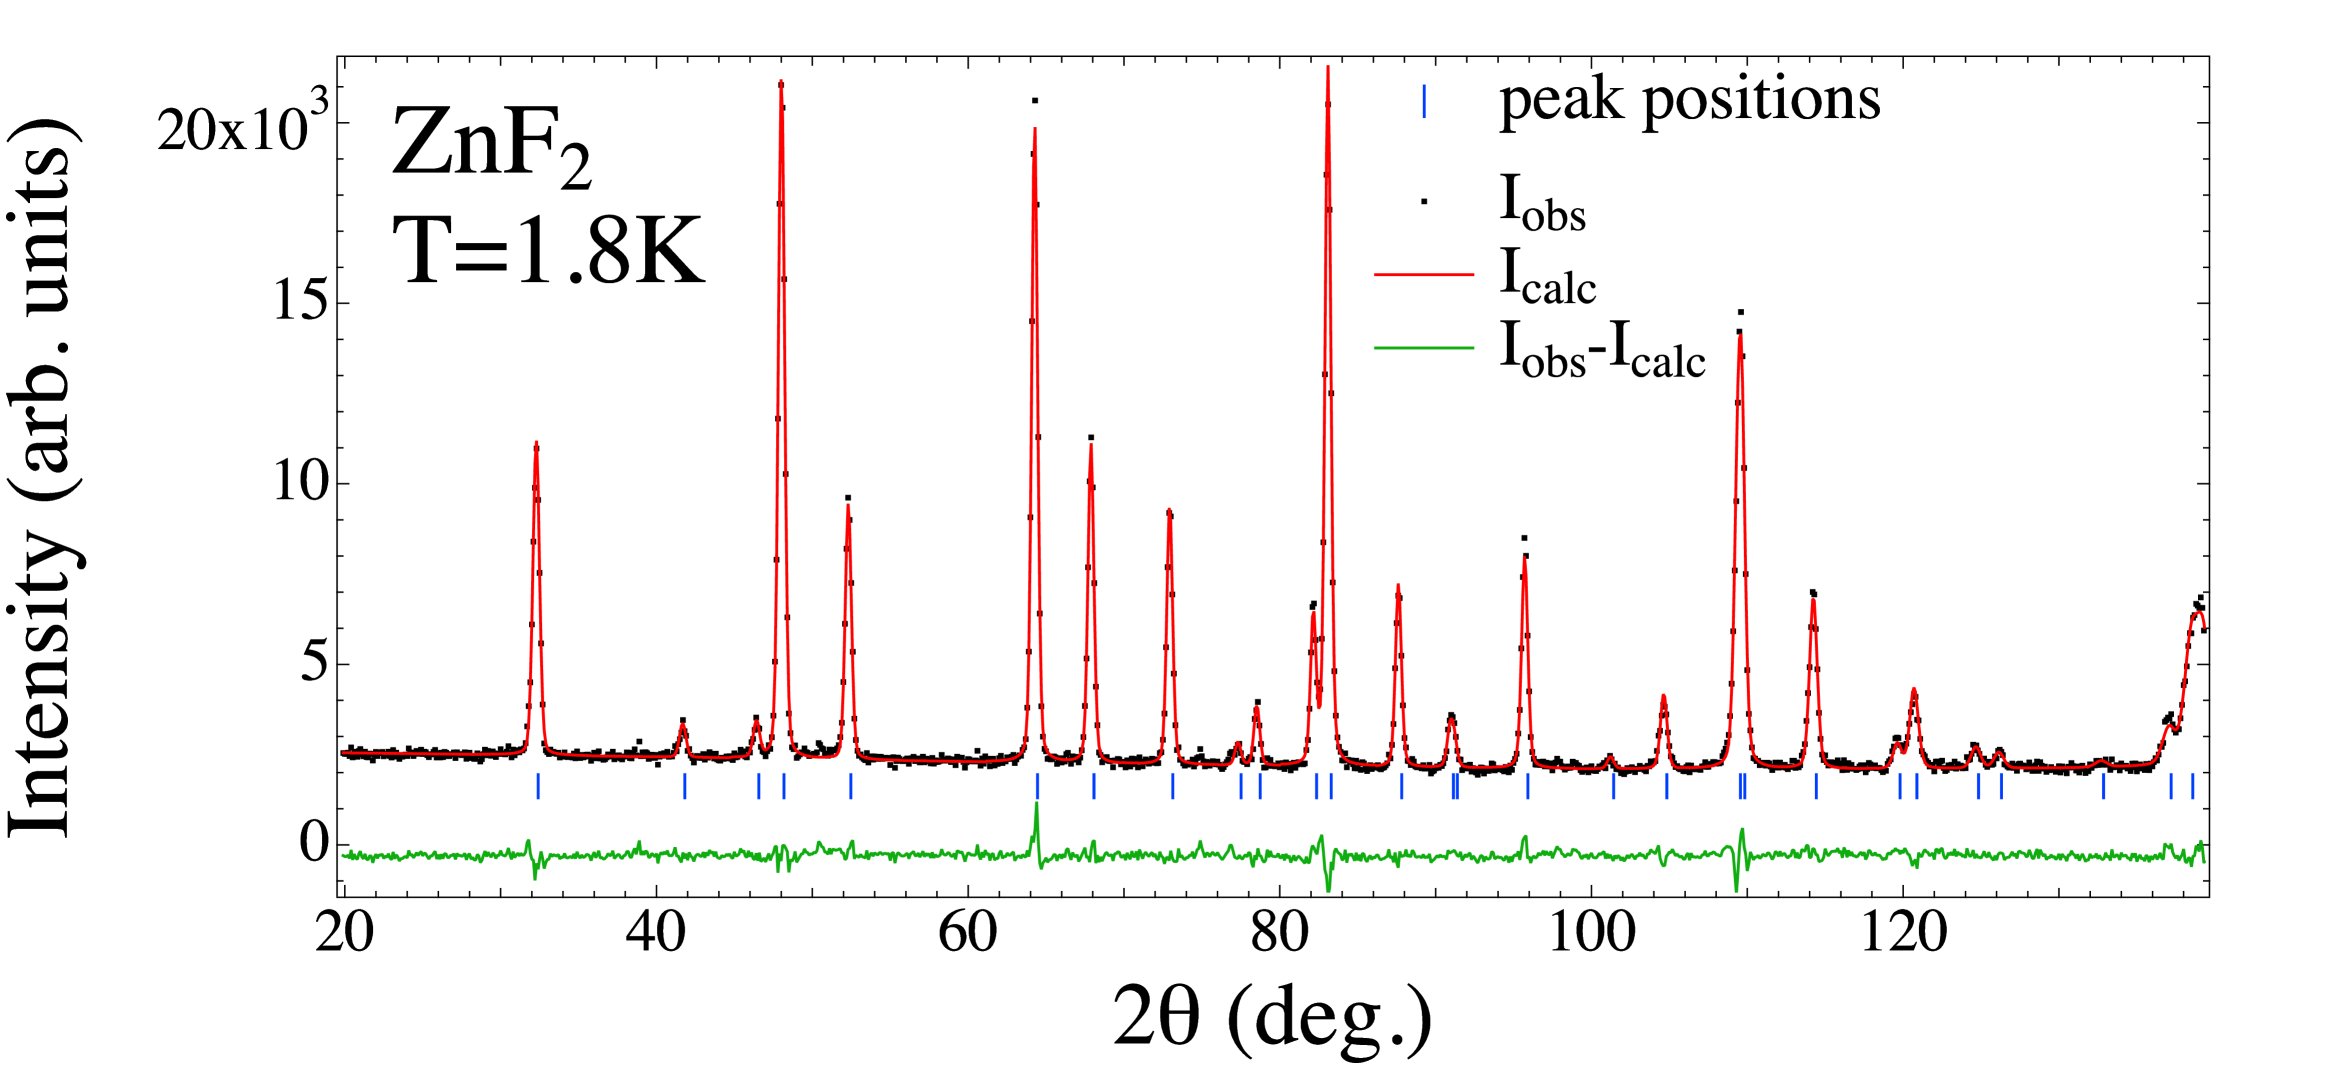
Neutron diffraction experiments were done on ZnF2 on the high intensity powder diffractometer D20 of the Institute Laue-Langevin in Grenoble. The reflection from a Ge monochromator at a high take-off angle of gave neutron wavelength of 1.868 Å. Approximately 5 g ZnF2 powder samples was placed inside an mm diameter vanadium can, which was fixed to the sample stick of a standard 4He cryostat. We have measured the diffraction intensities from ZnF2 as a temperature in the range K. The Rietveld refinementrietveld69 of the diffraction data was done by the Fullprof programrodriguez10 . The refinement results from ZnF2 at T = 1.8 K is shown in Fig. 2. The agreement factors R (not corrected for background) for pattern of this refinement were and . The corresponding conventional Rietveld R-factors were and . The goodness of the fit as given by was .
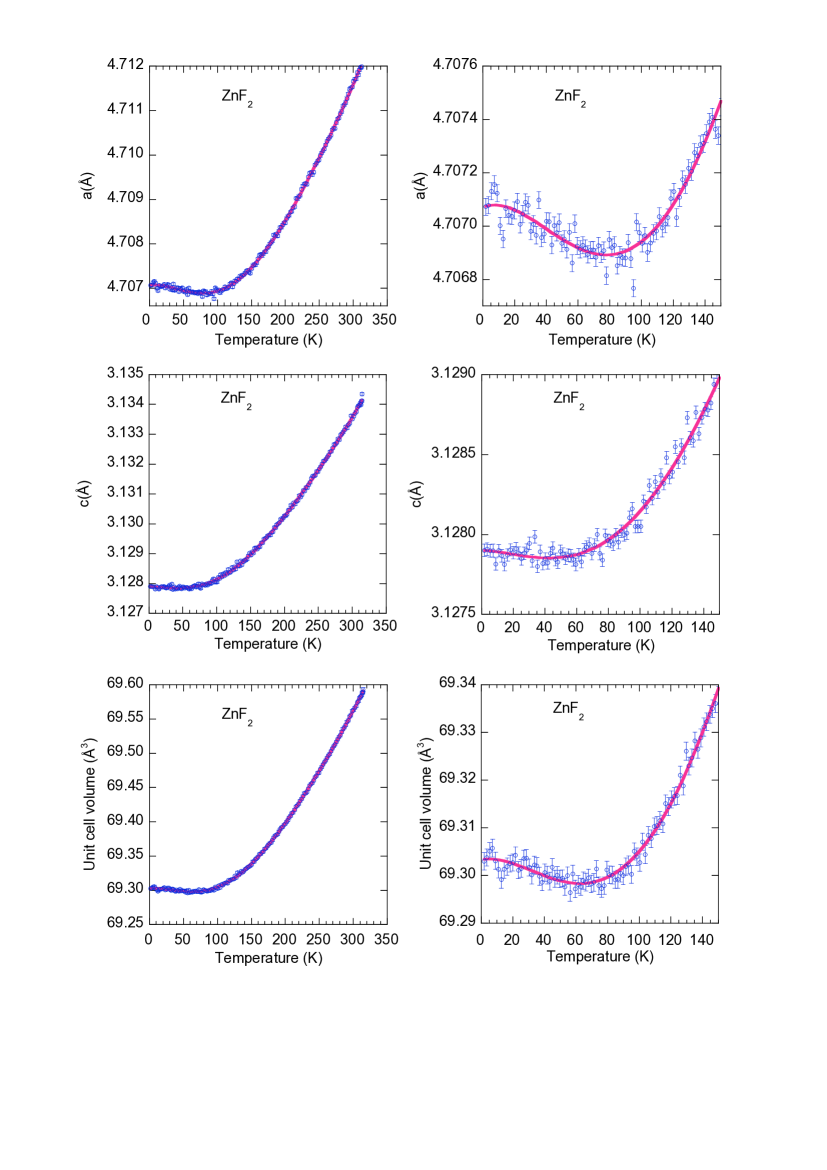
Fig. 3 shows the temperature variation of the lattice parameters , , and the unit cell volume of ZnF2 on the left panels. The red curves in these figures represent the lattice parameters and the unit cell volume obtained by fitting the data by fifth degree polynomials. Attempts to fit the data by Debye or Einstein functions in Grüneisen approximation failed for and because of the negative thermal expansion at low temperaure. Fifth degree polynomial function fit the low temperature successfuly. On the right panels only the low temperature data are shown. The lattice parameter and the unit cell volume exhibit minima at about 75 K.
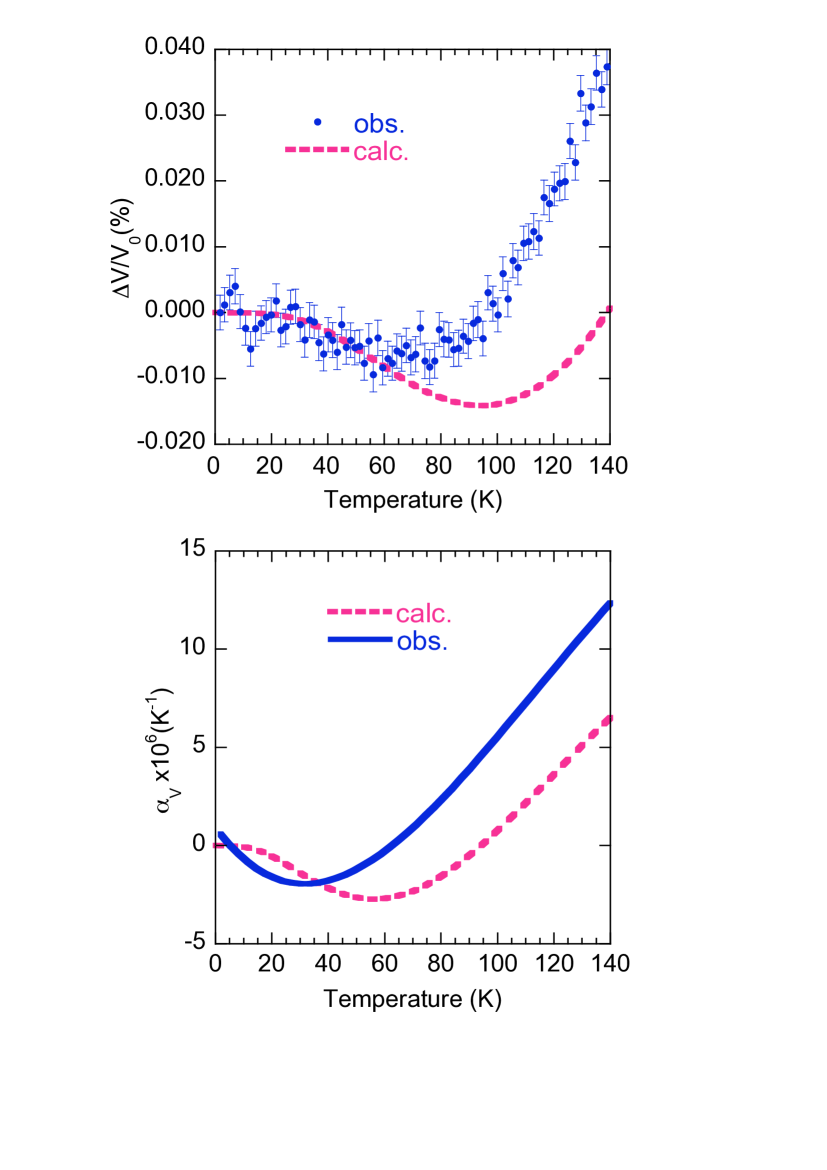
The upper panel of Fig. 4 shows the experimental normalized volume change given by
| (1) |
where is the unit cell volume at temperature and is the volume at along with the values calculated within the density functional theory framework (DFT). The lower panel of Fig. 4 shows the experimental and calculated volume thermal expansion coefficients in the low temperature range given by
| (2) |
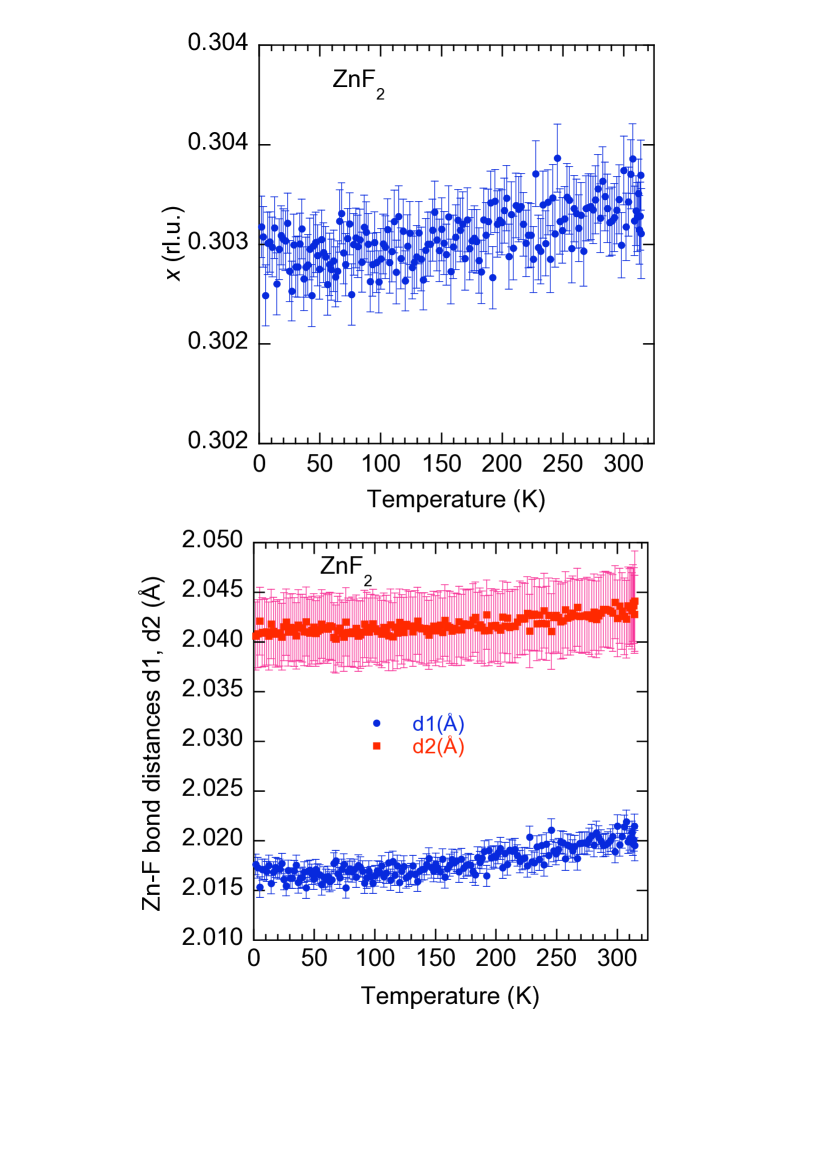
In order to check whether there exists any indication of incipient ferroelectric phase transition rimai77 ; boccara68 ; steiner94 ; vassiliou86 in ZnF2 at low temperature we refined the neutron powder diffraction data by the Rietveld method and determined the positional parameter and the two Zn-F bond distances and as a function of temperature. Fig. 5 shows these quantities. The absence of any anomalies suggest that apart from the negative thermal expansion (NTE) no further structural changes take place in ZnF2 low temperature.
We have done calculations to check whether we can reproduce NTE in ZnF2 using first-principles DFT. Since DFT is a K approach, the finite temperature dependence is introduced within the framework of phonons by applying the so-called quasiharmonic approximation. The anharmonic effects are included uniquely via the volume dependence of the phonon frequencies. For a set of volumes around the equilibrium one, the procedure consists of evaluating the total Helmhotz free energy given by
| (3) |
where Eel(V) and F are the total ground-state temperature-free energy at constant volume as obtained directly from DFT and the phonon free energy extracted from subsequent lattice dynamical calculations for each volume, respectively. The free energy can be then used to evaluate thermodynamics of the material under study.
The starting geometry for the calculations was the experimentally refined ZnF2 structure rimai77 . Relaxed geometries, total energies, phonon frequencies and volume-dependent phonon free energies were obtained using similar computational procedure described previously compproc1 ; compproc2 ; compproc3 .
The underlying mechanism of NTE in ZnF2 seems to be very similar to that for tetrahedral semiconductors like Si, Ge, ZnS etc. with diamond and zincblende structures gibbons58 ; sparks67 ; biernacki89 ; barrera05 . It is the excitations at low temperatures of the low-energy phonon modes with negative Grüneisen parameters that are responsible for NTE in ZnF2. These modes are likely connected with the rigid-mode vibrations of ZnF6 octahedra and their linkage along the a axis shown in the right panel of Fig. 1.
In conclusion we have done neutron diffraction study of the temperature dependence of the crystal structure of the simple non-magnetic or diamagnetic transition metal difluoride ZnF2 with rutile structure and have discovered negative thermal expansion (NTE) at low temperature. Our first principle calculations reproduces qualitatively this experimental result.
References
- (1) T.A. Mary, J.S.O. Evans, T. Vogt and A.W. Sleight, Science 272, 90 (1996).
- (2) J.S.O. Evans, T.A. Mary, T. Vogt, M.A. Subramanian and A.W. Sleight, Chem. Mater. 8, 2809 (1996).
- (3) A.W. Sleight, Ann. Rev. Mater. Sci. 28, 29 (1998).
- (4) J.S.O. Evans, J. Chem. Soc. Dalton Trans. 3317 (1999).
- (5) D.F. Gibbons, Phys. Rev. 112, 136 (1958).
- (6) P.W. Sparks, and C.A. Swenson, Phys. Rev. 163, 163 (1967).
- (7) S.Biernacki, and M. Scheffler, Phys. Rev. Lett. 63, 290 (1989).
- (8) G.D. Barrera, J.A.O. Bruno, T.H.K. Barron and N.L. Allan, J. Phys.: Condens. Matter 17, R217 (2005).
- (9) D.S. Rimai, Phys. Rev. B 16, 4069 (1977).
- (10) N. Boccara, Ann. Phys. (N.Y.) 47, 40 (1968).
- (11) M. Steiner, W. Potzel, M. Köfferline, H. Karzel, W. Schiessl, G.M. Kalvius, D.W. Mitchell, N. Sahoo, H.H. Klauss, T.P. Das, R.S. Feigelson and G. Schmidt, Phys. Rev. B 50, 13355 (1994).
- (12) J.K. Vassiliou, J. Appl. Phys. 59, 1125 (1986).
- (13) H.M. Rietveld, J. Appl. Cryst. 2, 65 (1969).
- (14) J. Rodriguez-Carvajal, FULLPROF, a Rietveld and pattern matching and analysis program version 2010, LLB, CEA-CNRS, France [http://www.ill.eu/sites/fullprof/]
- (15) M. Zbiri, H. Mutka, M. R. Johnson, H. Schober and C. Payen, Phys. Rev. B 81, 104414 (2010).
- (16) The exchange-correlation contribution has been described presently by the local density approximation (LDA) based on the Ceperly-Alder parametrization by Perdew and Zunger pz .
- (17) In order to determine accurately all the force constants, the supercell approach was used for lattice dynamics calculations. A tetragonal supercell (, , ) was constructed from the relaxed geometry containing 24 formula-units (72 atoms). Total energies and Hellmann-Feynman forces were calculated for 8 structures resulting from individual displacements of the symmetry inequivalent atoms in the supercell, along with the inequivalent cartesian directions (x, y and z).
- (18) J.P. Perdew and A. Zunger, Phys. Rev. B B23, 5048 (1982).