Present address: ]SUPA, School of Physics and Astronomy, Centre for Science at Extreme Conditions, The University of Edinburgh, United Kingdom.
Present address: ]KFKI Research Institute for Particle and Nuclear Physics, PO Box 49, H-1525 Budapest, Hungary.
Plasmons in Sodium under Pressure: Increasing Departure from Nearly-Free-Electron Behavior
Abstract
We have measured plasmon energies in Na under high pressure up to 43 GPa using inelastic x-ray scattering (IXS). The momentum-resolved results show clear deviations, growing with increasing pressure, from the predictions for a nearly-free electron metal. Plasmon energy calculations based on first-principles electronic band structures and a quasi-classical plasmon model allow us to identify a pressure-induced increase in the electron-ion interaction and associated changes in the electronic band structure as the origin of these deviations, rather than effects of exchange and correlation. Additional IXS results obtained for K and Rb are addressed briefly.
pacs:
71.45.Gm, 62.50.-p, 78.70.Ck, 71.20.-bSodium, at ambient conditions, is one of the best manifestations of a “simple” or nearly-free-electron (NFE) metal WS34 . It is characterized by a single -type valence electron, weak interaction between the conduction electrons and the atomic cores (electron-ion interaction), and conduction band states of orbital character. Na crystallizes in the high-symmetry body-centered cubic (bcc) structure at pressures up to 65 GPa, where it transforms to face-centered cubic (fcc) HLS02 . The properties of Na change fundamentally under pressure in the megabar pressure range, where a series of phase transitions into lower-symmetry crystal structures has been predicted NA01+CN01 and observed HSLC02 ; GLMG08 ; LGMG09 , accompanied by marked changes in its optical properties HSLC02 ; LGMG09 ; LGSC09 and culminating in the formation of a non-metallic, visually transparent phase at 200 GPa MEOX09 . A central question is how the transformation from a simple metal to a semiconductor progresses, not only in Na, but also in other metals such as Li, which was reported to become semiconducting above 70 GPa MS09 . As for Na, does it remain NFE-like in its bcc and fcc phases up to 100 GPa LGSC09 so that the non-NFE behavior starts only with the transitions into the lower-symmetry phases above 105 GPa, or are there significant precursors at lower pressure?
To provide an answer, we measured and calculated the pressure dependence of Na plasmon energies. Plasmon excitations provide information on the collective electronic excitations in the form of longitudinal charge density waves at finite wavevector, and they determine the optical response of a metal, specifically the plasma reflection edge. Plasmons have been studied for many years by electron energy loss spectroscopy (EELS) at zero pressure (see for example FSF89 ; SFF89 and references therein), but this technique is not suitable for samples enclosed in high-pressure cells. Mao et al. MKH01 have demonstrated the possibility of measuring plasmon excitations in Na under pressure using inelastic x-ray scattering (IXS), and they found their experimental results up to 2.7 GPa to be in agreement with theoretical predictions.
We report here detailed IXS results on the plasmon energy dispersion in Na under pressure up to 43 GPa, corresponding to a 2.6-fold increase in density. Our results evidence a significant departure from the predictions for a NFE metal. In order to explain this discrepancy between theory and experiment, we also present plasmon energy calculations based on first-principles electronic band structures and a quasi-classical plasmon model after Paasch and Grigoryan (PG model) PG99 . These calculations reconcile experiment and theory and allow us to identify changes in the electron-ion interaction as the dominant effect, rather than changes in the electron-electron interactions. Some experimental results are also reported for K and Rb.
The theoretical description of plasmons in simple metals is well established. The most commonly used approach starts from the free-electron (FE) gas and uses the Random Phase Approximation (RPA) Pin64 . The plasmon energy dispersion is then given by with the plasma frequency and the dispersion coefficient , where is the plasmon momentum, the electron mass, the electron density, a dielectric constant describing the polarizability of the ionic cores ( for the free-electron gas), and is the Fermi energy. This relatively simple model works reasonably well for simple metals such as Na and Al at ambient conditions FSF89 ; SFF89 , but experimental dispersion coefficients tend to be lower than the theoretical values, which has been attributed to electron exchange and correlation effects SFF89 . Both the plasma frequency and the dispersion coefficient depend on the electron density and can thus be tuned by the application of pressure; both are expected to increase with increasing pressure. The stability of bcc sodium over a large pressure range of 0–65 GPa permits to generate an up to threefold increase in (electron) density without a structural transition.
IXS experiments were performed on beamline ID16 at the ESRF, Grenoble. Silicon crystal monochromators were used to monochromatize the incident beam and to analyze the scattered radiation. The incident x-ray beam with a photon energy of 9.877 keV was focussed onto the polycrystalline sample in a high-pressure cell with a spot diameter of 100–200 m, depending on the sample size. IXS spectra of the samples at room temperature were recorded in energy-scanning mode with an overall spectral resolution of 0.6 eV and a momentum resolution of 0.4 nm-1. In most of the experiments, the samples were pressurized in diamond anvil cells (DACs). Rhenium and stainless steel gaskets were used with initial thicknesses of 50–100 m and hole diameters of 150–200 m. The loading of distilled Na, K, and Rb into the pressure cells was carried out in an argon atmosphere. Because of the softness of these metals no pressure transmitting medium was added. Pressures were determined with the ruby method ruby:method or by measuring an x-ray powder diffraction of the sample and using its known equation of state HLS02 . In the experiments using a DAC, the incoming x-ray beam passed through one diamond anvil onto the sample, and the scattered radiation was collected through the opposing anvil (thickness 1.5 mm). Despite the small sample scattering volume and the relatively low diamond transmittance of 30% for 10-keV x-rays, high-quality spectra could be collected in 2 hours. The experiments on Na at 1 and 7 GPa were performed using a high-pressure cell equipped with sintered-diamond anvils and a beryllium gasket. Here, the x-rays passed through the Be gasket.
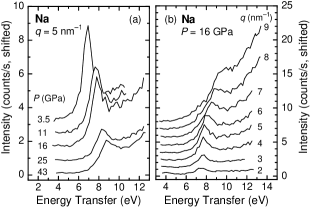
Figure 1 shows IXS spectra of polycrystalline Na under pressure. A single excitation peak is observed, which is attributed to the bulk plasmon in Na, based on the predictions for a NFE metal with the electron density of Na and also by comparison with previous EELS results FSF89 . The rising background in the spectra of Fig. 1, in particular at large , is due to plasmon and interband excitations in the diamond anvil through which the scattered radiation is detected WKAF00 .
Plasmon energies and linewidths were determined by fitting the spectra with a Gaussian peak for the plasmon line and a polynomial background. As all experiments were performed on polycrystalline samples, the reported plasmon energies are directional averages. The Na plasmon energies increase with increasing pressure as illustrated in Fig. 2 for nm-1. This is in qualitative agreement with the NFE picture, where the plasmon energies scale with the electron density.
Figure 2 also shows results for K and Rb. These two metals clearly do not follow the expectations for NFE metals. Moreover, their plasmon linewidths increased and their plasmon intensities decreased rapidly with increasing pressure. These effects are attributed to the pressure-driven – hybridization of conduction band states, as is also evident from the optical response of K and Rb under pressure TTS82 ; TS83 (see also KE99 ). We will therefore focus on Na that could be studied over the largest pressure range and which, at ambient conditions, is one of the best manifestations of a nearly-free-electron metal.
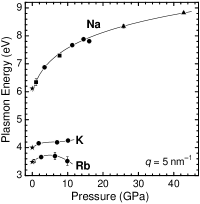
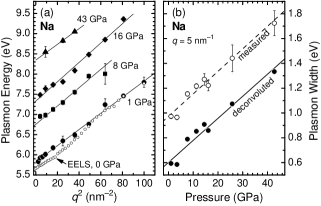
Figure 3(a) shows the measured plasmon dispersion relations of Na at several pressures. The plasmon energies are plotted versus because of the anticipated parabolic dispersion relation, see the relation given above. At the lowest pressure, 1 GPa, the Na plasmon dispersion measured here is indeed very close to parabolic. Results of an ambient-pressure EELS study FSF89 are included in Fig. 3(a) for comparison. In the low- region, the IXS and EELS data are reasonably consistent, but the EELS results exhibit some deviation from a parabolic dispersion. The offset, at low , between the IXS and EELS data is largely due to the pressure applied in the IXS experiment. The 1-GPa plasmon dispersion measured by IXS is described best by eV and . As noted before FSF89 , the experimental dispersion parameter is lower than the FE/RPA value of . Towards higher pressures, the measured plasmon dispersion remains approximately parabolic, deviations being most notable at 16 GPa.
Figure 3(b) shows that also the plasmon linewidth is strongly pressure dependent. This effect is tentatively attributed to a reduction of the plasmon lifetime due to decays involving electron-hole excitations. A detailed study by, e.g., time-dependent density functional theory could be a subject for future studies. For the remainder of this paper we focus on the plasmon energies, assuming that self-energy effects on the plasmon frequency can be neglected.
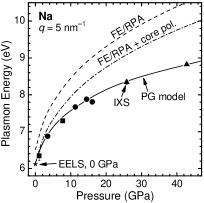
The IXS results on the plasmon energies of Na as a function of momentum and pressure allow us to test the validity of the FE/RPA description of Na and to assess the relative importance of band structure effects, core polarizability, and exchange-correlation. Using as given above and the experimental equation of state of Na HLS02 , the pressure dependence of the nm-1 plasmon was calculated within the FE/RPA framework as shown in Fig. 4. This FE/RPA estimate is significantly higher in energy than the experimental values, and the deviation increases with increasing pressure. Inclusion of the core polarization (, Ref. NP82 ) leads to a good agreement with the experiment at low pressure, but a major deviation between theory and experiment remains at high pressure.
The important observation here is the striking increase in the deviation between theory and experiment with increasing pressure. In previous work on other metals, deviations from the FE/RPA predictions were discussed in relation to exchange and correlation effects FSF89 ; SGBB91 , and a number of extensions of the RPA were proposed in this spirit (see SGBB91 ; FSF89 ; VS72 and references therein). Their main effect is to reduce the plasmon dispersion coefficient , and their inclusion can improve the agreement between theory and experiment. However, exchange-correlation effects decrease with increasing electron density, and they can thus be excluded as the origin of the deviation between the ‘FE/RPA + core polarization’ results and the experimental data in Fig. 4. More recent theoretical studies have emphasized the importance of band-structure effects on the plasmon properties, regarding both the energy dispersion PG99 and the plasmon linewidth KE99 . The present IXS results offer an opportunity to test these proposals.
The PG plasmon model PG99 adopted here is an extension of the FE/RPA approach. This classical model is not expected to describe the plasmon properties as accurately as, e.g., time-dependent density functional theory (DFT) KE99 , but it allows us better to understand the underlying physics. The electronic structure of the metal is described here by a single isotropic conduction band with a quartic dispersion, . The term accounts for deviations from the parabolic band shape of the free-electron gas. The plasma frequency and the plasmon dispersion coefficient can then be determined from , and the Fermi energy as described in detail in PG99 .
Electronic structure calculations of Na were performed in the framework of first-principles DFT, using the full-potential L/APW+lo method SNS00 ; MBSS01 and the Generalized Gradient Approximation PBE96 as implemented in the WIEN2K code soft:Wien2k . The electronic band structure of bcc Na was calculated for a series of volumes corresponding to the pressure range of 0–50 GPa misc:CompDetails . The coefficients and were determined for three directions in the Brillouin zone, i.e. along , , and , and then averaged SupplMat . The only adjustable parameter in the calculation of the plasma frequency and the dispersion coefficient is the static dielectric constant that accounts for the polarizability of the ionic cores. A value of as determined for Na in a DFT-based study NP82 was adopted here, and a possible density dependence was neglected.
| experiment | FE/RPA | PG model | ||||
| (GPa) | (eV) | (eV) | (eV) | |||
Figure 4 shows the results of the PG model with input from our band structure calculations for the nm-1 plasmon in Na SupplMat . The computed results are in excellent agreement with the IXS data. To trace the source of the difference between the FE/RPA results and those of the PG model, Table 1 summarizes the plasma frequency and the dispersion coefficient for the two models at selected pressures. At 1 GPa, the results of the NFE/RPA and the PG model are very similar, and the calculated plasma frequency agrees well with the experiment. As noted before FSF89 , the calculated values of are 20–30% larger than in the experiment, and this is probably due to exchange-correlation effects not included here. The effect of the non-parabolic contribution () is to reduce both and . In Na, this effect is very small near ambient pressure, confirming the analysis by Paasch and Grigoryan PG99 . With increasing pressure, however, increases and leads to substantial corrections SupplMat . At 40 GPa, it reduces the plasma frequency by 8% and the dispersion coefficient by 35% compared to NFE/RPA. Table 1 also shows that decreases with increasing pressure in the PG model, in contrast to the free-electron behavior. We would like to emphasize that it is the non-parabolic contribution that causes the renormalization of the plasmon energies, even though the corrections to the band energies are less than 3% of the band width SupplMat .
As for the physical origin of these corrections, the band structure calculations show that pressure causes the band gaps at the N, P, and H points of the Brillouin zone to grow relative to the width of the conduction band SupplMat . This evidences a strengthening of the interaction between the valence electrons and the ionic cores (electron-ion interaction). In other words, Na becomes increasingly less free-electron like under compression. The quartic correction () corresponds to a lowering of the conduction band energies near the Brillouin zone boundary in comparison to the free-electron case, and this distortion of the band structure SupplMat leads to a reduction of the Fermi velocity, , which is the key physical quantity that determines the plasmon dispersion.
In summary, we have performed inelastic x-ray scattering experiments to determine the effect of pressure on the plasmon excitations in the ‘simple metal’ sodium. While Na is considered one of the best manifestations of a nearly-free-electron metal at ambient conditions, our results evidence substantial and increasing deviations from the behavior of a NFE metal at high pressure up to 43 GPa. This can be seen as an early precursor of the fundamental changes in the electronic structure of Na at megabar pressures. The deviation from NFE behavior can in part be attributed to the polarizability of the ionic cores, but to a larger extent it is caused by pressure-induced changes in the electronic band structure. Plasmon energies determined on the basis of electronic band structure calculations and the quasi-classical PG model are in excellent agreement with the IXS results. They show that the electron-ion interaction in Na increases with pressure and leads to the renormalization of the plasmon energies via a modification of the electronic band structure. As for the heavy alkali metals under pressure, band structure effects can be expected to be even more important due to the pressure-driven hybridization of the valence orbitals with states, as discussed before PG99 . We observed a weak pressure dependence of the plasmon frequencies of K and Rb combined with fast broadening of their plasmon resonances under pressure. These results may aid the interpretation of plasmon dispersions of the heavy alkali metals at ambient pressure. As for bulk Li metal, the quite detailed predictions on the collective electronic response under pressure RSBE08 ; ERRS10 still await a related experimental investigation.
We thank F. Kögel (MPI-FKF, Stuttgart) for providing the distilled metals used in this study. G. V. was supported by the Hungarian Scientific Research Fund (contract No. K72597).
References
- (1) E. Wigner and F. Seitz, Phys. Rev. 46, 509 (1934).
- (2) M. Hanfland, I. Loa, and K. Syassen, Phys. Rev. B 65, 184109 (2002).
- (3) J. B. Neaton and N. W. Ashcroft, Phys. Rev. Lett. 86, 2830 (2001); N. E. Christensen and D. L. Novikov, Solid State Commun. 119, 477 (2001).
- (4) M. Hanfland et al., Sodium at megabar pressures, Poster at 2002 High Pressure Gordon Conference.
- (5) E. Gregoryanz et al., Science 320, 1054 (2008).
- (6) L. F. Lundegaard et al., Phys. Rev. B 79, 064105 (2009).
- (7) A. Lazicki et al., Proc. Nat. Acad. Sci. USA 106, 6525 (2009).
- (8) Y. Ma et al., Nature 458, 182 (2009).
- (9) T. Matsuoka and K. Shimizu, Nature 458, 186 (2009).
- (10) A. vom Felde, J. Sprösser-Prou, and J. Fink, Phys. Rev. B 40, 10181 (1989).
- (11) J. Sprösser-Prou, A. vom Felde, and J. Fink, Phys. Rev. B 40, 5799 (1989).
- (12) H.-K. Mao, C. Kao, and R. J. Hemley, J. Phys.: Condens. Matter 13, 7847 (2001).
- (13) G. Paasch and V. G. Grigoryan, Ukr. J. Phys. 44, 1480 (1999).
- (14) D. Pines, Elementary excitations in solids (W.A. Benjamin, New York, 1964).
- (15) G. J. Piermarini, S. Block, J. D. Barnett, and R. A. Forman, J. Appl. Phys. 46, 2774 (1975); H. K. Mao, J. Xu, and P. M. Bell, J. Geophys. Res. 91, 4673 (1986).
- (16) S. Waidmann et al., Phys. Rev. B 61, 10149 (2000).
- (17) H. Tups, K. Takemura, and K. Syassen, Phys. Rev. Lett. 49, 1776 (1982).
- (18) K. Takemura and K. Syassen, Phys. Rev. B 28, 1193 (1983).
- (19) W. Ku and A. G. Eguiluz, Phys. Rev. Lett. 82, 2350 (1999).
- (20) R. Nieminen and M. Puska, Physica Scripta 25, 952 (1982).
- (21) L. Serra et al., Phys. Rev. B 44, 1492 (1991).
- (22) P. Vashishta and K. S. Singwi, Phys. Rev. B 6, 875 (1972).
- (23) E. Sjösted, L. Nordström, and D. J. Singh, Solid State Commun. 114, 15 (2000).
- (24) G. K. H. Madsen et al., Phys. Rev. B 64, 195134 (2001).
- (25) J. P. Perdew, K. Burke, and M. Ernzerhof, Phys. Rev. Lett. 77, 3865 (1996).
- (26) P. Blaha et al., WIEN2k, An Augmented Plane Wave + Local Orbitals Program for Calculating Crystal Properties (K. Schwarz, Techn. Universität Wien, Austria, 2001).
- (27) Computational details: sphere size a.u.; plane-wave cutoff defined by = 8.0; Brillouin zone sampled on a tetrahedral mesh with -points (190 in the IBZ).
- (28) See EPAPS Document No. ***** for additional details. For more information on EPAPS, see http://www.aip.org/pubservs/epaps.html.
- (29) A. Rodriguez-Prieto, V. M. Silkin, A. Bergara, and P. M. Echenique, New J. Phys. 10, 053035 (2008).
- (30) I. Errea et al., Phys. Rev. B 81, 205105 (2010).