Cosmic Train Wreck by Massive Black Holes:
Discovery of a kpc-Scale Triple Active Galactic
Nucleus11affiliation: This paper includes data gathered with the
Apache Point Observatory 3.5-meter telescope, which is owned
and operated by the Astrophysical Research Consortium.
Abstract
Hierarchical galaxy mergers will lead to the formation of binary and, in the case of a subsequent merger before a binary coalesce, triple supermassive black holes (SMBHs), given that most massive galaxies harbor SMBHs. A triple of SMBHs becomes visible as a triple active galactic nucleus (AGN) when the BHs accrete large amounts of gas at the same time. Here we report the discovery of a kpc-scale triple AGN, SDSS J1027+1749 at , from our systematic search for hierarchical mergers of AGNs. The galaxy contains three emission-line nuclei, two of which are offset by 450 and 110 km s-1 in velocity and by 2.4 and 3.0 kpc in projected separation from the central nucleus. All three nuclei are classified as obscured AGNs based on optical diagnostic emission line ratios, with black hole mass estimates from stellar velocity dispersions measured in the associated stellar components. Based on dynamical friction timescale estimates, the three stellar components in SDSS J1027+1749 will merge in Myr, and their associated SMBHs may evolve into a gravitationally interacting triple system in Myr. Our result sets a lower limit of for the fraction of kpc-scale triples in optically selected AGNs at .
Subject headings:
black hole physics — galaxies: active — galaxies: interactions — galaxies: nuclei — galaxies: stellar content1. Introduction
Galaxies are thought to be built up hierarchically via mergers (Toomre & Toomre, 1972). Because most massive galaxies are believed to harbor a central supermassive black hole (SMBH; Kormendy & Richstone, 1995), galaxy mergers will result in the formation of binary SMBHs through dynamical friction (Begelman et al., 1980; Milosavljević & Merritt, 2001; Yu, 2002). When a binary does not coalesce before a subsequent merger with a third galaxy, a system of three gravitationally interacting SMBHs is expected to form (e.g., Valtonen, 1996). Triple SMBHs may hold important clues to our general understanding of massive galaxy formation. For example, numerical simulations suggest that triple SMBHs scour out cores in stellar bulges with mass deficits one or two times of the total mass of the BHs and sizes larger than those formed around binary SMBHs. This process may be responsible for the large cores observed in some massive elliptical galaxies such as M87 (Hoffman & Loeb, 2007). Triple SMBHs also provide a unique astrophysical laboratory to study the chaotic dynamics of three-body interactions in General Relativity (e.g., Blaes et al., 2002; Merritt, 2006). Numerical simulations of the dynamics of triples suggest that their encounter may lead to a merger of all three BHs, formation of a highly eccentric binary, or ejection of three free BHs (Iwasawa et al., 2006; Lousto & Zlochower, 2008). Triple SMBHs exhibit phases of very high eccentricity in the inner binary, producing intense bursts of gravitational radiation which will be within the sensitivity range of forthcoming pulsar timing arrays and the Laser Interferometer Space Antenna (e.g., Amaro-Seoane et al., 2010).
Despite their significant scientific merit and intense theoretical interest, direct observational evidence for gravitationally interacting triple SMBHs is still lacking, however, because their typical separation (less than a few parsecs) is too small to be resolved at cosmological distances. In this Letter, we report the probable discovery of a kpc-scale triple of SMBHs, at a separation large enough that the components can be easily resolved using current facilities, yet small enough for the system to be dynamically interesting. Using a simple stellar dynamical friction argument, we estimate that the system will form a bound SMBH triple in Myr. A triple of SMBHs becomes visible as a triple active galactic nucleus (AGN) when the BHs accrete large amounts of gas at the same time – a process which is thought to be common in gas-rich mergers (e.g., Hernquist, 1989). While kpc-scale triple AGNs are supposed to be present in recurrent galaxy mergers, only one candidate is known111There is one probable physical triple quasar known, QQ at (Djorgovski et al., 2007), but the projected separations between the quasar components are much larger, –50 kpc.. It is a triplet of emission-line nuclei (with two offset nuclei at 5.1 and 8.4 kpc in projection from the primary nucleus) in the minor merger NGC 3341 at serendipitously discovered by Barth et al. (2008).
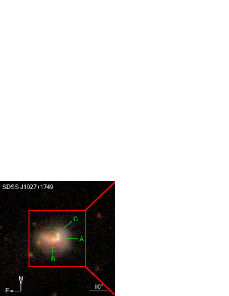
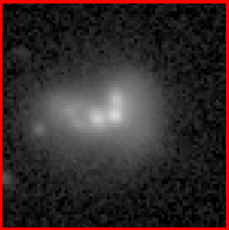
To quantify the frequency of kpc-scale binary and triple systems of SMBHs, we are conducting a systematic search for hierarchical mergers of AGNs in the Seventh Data Release (DR7; Abazajian et al., 2009) of the Sloan Digital Sky Survey (SDSS; York et al., 2000). We have selected a sample of 1286 AGN pairs with projected separations kpc and line-of-sight velocity offsets km s-1 (Liu et al., 2011b). Ninety-two AGN pairs in the sample have kpc and . Seven of these 92 pairs have a third galaxy or nuclei with kpc from both of the first two nuclei and -band magnitude differences mag. Because of its proximity with the first two nuclei, none of the third nuclei has an SDSS spectrum due to the finite size of SDSS fibers222The first two nuclei both have an SDSS spectrum because they were observed on overlapping spectroscopic plates.. To determine whether the third nucleus is also active and physically close to the first two nuclei, we are conducting spatially resolved spectroscopy for these kpc-scale triple AGN (hereafter, triple AGN, for short) candidates. Here, we report our initial results on the discovery of a triple AGN in a hierarchical merging system, SDSS J1027+1749. Shown in Figure 1, the galaxy contains three nuclei as seen in its SDSS image, with B and C at projected separations of 3.0 and 2.4 kpc from A. The nuclei A and B have SDSS spectra. We have conducted optical slit spectroscopy for all three nuclei. We describe our observations and data analysis in §2, and present physical measurements of the three nuclei in §3. We discuss implications of our results and conclude in §4. A CDM cosmology with , , and is assumed throughout.
2. Observations and Data Analysis
We obtained slit spectra for SDSS J1027+1749 on the nights of 2011 March 2 and 6 UT using the Dual Imaging Spectrograph (DIS) on the Apache Point Observatory 3.5 m telescope. The sky was mostly non-photometric, with seeing ranging between and with a median around . DIS has a 46′ FOV with a pixel size of . We adopted a slit with the B1200+R1200 gratings centered at 510 and 700 nm. The spectral coverage was 450–560 (640–760) nm with an instrumental resolution of (30) km s-1 and a dispersion of 0.62 (0.58) Å pixel-1 in the blue (red). We oriented the slit with PA , 133∘, and 172∘ to go through the nuclei A and B, B and C, and A and C respectively, as labeled on the SDSS image shown in Figure 1. The total effective exposure time was 10800, 8100, and 8100 s for A, B, and C, respectively. Standard stars G191B2B and HZ44 were observed for spectrophotometric calibration. We reduced the DIS data following standard IRAF333IRAF is distributed by the National Optical Astronomy Observatory, which is operated by the Association of Universities for Research in Astronomy, Inc., under cooperative agreement with the National Science Foundation. procedures (Tody, 1986). We extracted one-dimensional spectra using diameter apertures for the nuclei A, B, and C respectively. We applied a telluric correction from standard stars on the extracted one-dimensional spectra. The median signal-to-noise ratio (S/N) achieved was 50–80 pixel-1.
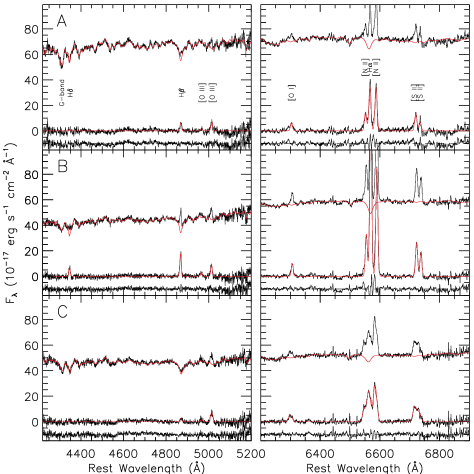
Figure 2 shows the resulting rest-frame one-dimensional spectra and our best-fit models for the stellar continuum and the continuum-subtracted emission lines, respectively. We measure redshift by fitting the continuum with galaxy templates produced by population synthesis models of Bruzual & Charlot (2003) using the procedure described in detail in Liu et al. (2009). The templates have been convolved with the stellar velocity dispersions measured over the spectral region of 4130–4600 Å containing the G band 4304 Å using the direct fitting algorithm of Greene & Ho (2006) and Ho et al. (2009) following the procedure described in Liu et al. (2009). After subtracting the stellar continuum, we fit the emission lines simultaneously with Gaussian models constrained to have the same redshift and width.
3. Results
| log | log | log | |||||||||
|---|---|---|---|---|---|---|---|---|---|---|---|
| ID | SDSS Designation | (mag) | (mag) | (mag) | (mag) | (kpc) | () | () | (km s-1) | () | |
| (1) | (2) | (3) | (4) | (5) | (6) | (7) | (8) | (9) | (10) | (11) | (12) |
| A | J102700.40+174900.8 | 0.0668 | 16.73 | 2.48 | 1.1 | ||||||
| B | J102700.55+174900.2 | 0.0664 | 17.00 | 2.46 | 1.6 | ||||||
| C | J102700.38+174902.6 | 0.0652 | 17.03 | 2.51 | 2.4 |
Note. — Col. 1: ID of the three nuclei as labeled on Figure 1; Col. 2: SDSS names with J2000 coordinates given in the form of “hhmmss.ss+ddmmss.s”; Col. 3: redshift measured from stellar continuum fitting; Col. 4: SDSS -band fiber magnitude; Col. 5: SDSS -band fiber absolute magnitude; Col. 6: Col. 5 after correction for internal dust extinction estimated using the Balmer decrement method; Col. 7: SDSS color from fiber magnitudes; Col. 8: effective radius from aperture photometry; Col. 9: stellar mass estimates from population synthesis modeling of the optical stellar continuum; Col. 10: Col. 9 after correction for internal dust extinction; Col. 11: stellar velocity dispersion from model fits of the stellar continuum over the G-band Å region (Figure 2). The quoted errors throughout this table are statistical uncertainties; Col. 12: black hole mass estimates assuming the – relation of Tremaine et al. (2002) observed in local inactive galaxies.
| log | log | EWHα | log | ||||||||
|---|---|---|---|---|---|---|---|---|---|---|---|
| ID | () | () | (km s-1) | /H | /H | /H | /H | H/H | (Å) | (cm-3) | (mag) |
| (1) | (2) | (3) | (4) | (5) | (6) | (7) | (8) | (9) | (10) | (11) | (12) |
| A | |||||||||||
| B | 0.3 | ||||||||||
| C | 1.9 |
Note. — Col. 1: same as Col. 1 in Table 1; Col. 2: [O III] 5007 luminosity from Gaussian fits to the emission lines; Col. 3: Col. 2 after correction for internal dust extinction estimated using the Balmer decrement method as listed in Col. 12; Col. 4: gas velocity dispersion from Gaussian fits of the continuum-subtracted emission lines (Figure 2). The quoted 1 errors throughout this table are statistical uncertainties; Cols. 5–9: intensity ratios from Gaussian fits of the emission lines; Col. 10: rest-frame H equivalent width; Col. 11: electron density estimated using the emission-line intensity ratio [S II] 6717/[S II] 6731. Col. 12: color excess estimated from the emission-line intensity ratio H/H (Col. 9) using the Balmer decrement method, assuming the intrinsic case B values of 2.87 for K (Osterbrock, 1989) and the extinction curve of Cardelli et al. (1989) with .
Tables 1 and 2 list our measurements of the host and emission-line properties of the three nuclei of SDSS J1027+1749, respectively. The redshifts measured from stellar continuum fitting show that the components B and C are offset from A by and km s-1 in velocity. Their stellar velocity dispersions are 200–300 km s-1, typical of massive galaxies at of similar luminosities and sizes (Bernardi et al., 2003). To securely separate the three components, we applied aperture photometry for them individually with diameter (corresponding to 3.8 kpc) apertures using their SDSS images. They all fall in the red sequence on the , color–magnitude diagram (Baldry et al., 2004). We have also performed surface brightness profile fitting using the galfit package (Peng et al., 2010), using stars within the field to model the point-spread function (PSF). Assuming a five-component model for the entire galaxy (four Sérsic profiles for the three nuclei and the surrounding diffuse component, and an exponential disk for the tidal feature), we estimate their -band Sérsic indices as 1.4, 4.1, and 1.2 for A, B, and C, respectively. While the fit seems reasonable with a reduced of 1.2, the results are highly uncertain given the limited resolution (-band PSF FWHM ) of the SDSS images and systematic uncertainties from model degeneracy. Hubble Space Telescope (HST) and/or ground-based imaging assisted with adaptive optics will help better determine their structural properties. We estimate stellar mass based on population synthesis modeling of the optical stellar continuum. The stellar mass ratio of the triple system is before extinction correction and is after. We estimate internal dust extinction from the emission-line intensity ratio H/H using the Balmer decrement method (Osterbrock, 1989) assuming the intrinsic case B values of 2.87 for K (Osterbrock, 1989) and the extinction curve of Cardelli et al. (1989) with . However, the estimates are highly uncertain due to the systematic uncertainty in the dust geometry. The three stellar components are blended in Two Micron All Sky Survey (2MASS; Skrutskie et al., 2006). Higher resolution IR imaging is needed to better constrain their individual stellar masses.
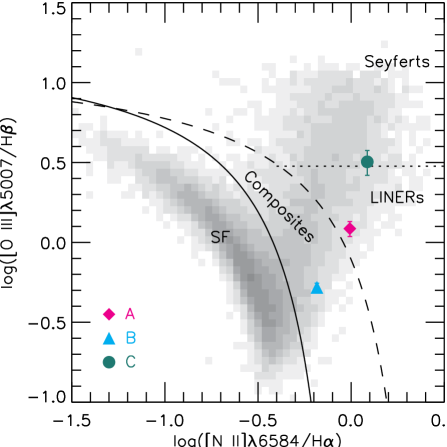
Figure 2 shows that all the three nuclei emit narrow lines with gas velocity dispersions of 200–300 km s-1 (Table 2), consistent with of their associated stellar components. Their emission line intensity ratios (Table 2) are all characteristics of AGNs or AGN-H II composites. The masses of the AGNs are estimated to be (Table 1) from of their associated stellar components444This still holds after correcting for the fact that is likely overestimated by dex using measured in AGN mergers separated by a few kpc (Liu et al., 2011a).. Figure 3 shows the BPT diagram (Baldwin et al., 1981; Veilleux & Osterbrock, 1987) for the three nuclei. Based on [N II] 6584/H and [O III] 5007/H, A is classified as a low-ionization narrow emission region (LINER), B is a composite, and C is a Seyfert (or a LINER within uncertainties). A (C) is consistently classified as a LINER (Seyfert) based on diagnostic ratios [S II] 6717,6731/H or [O I] 6300/H and [O III] 5007/H according to the criteria of Kewley et al. (2006). While LINERs and composites may be due to stellar or shock heating rather than AGN excitation (e.g., Lutz et al., 1999), X-ray observations show that % of them do harbor AGNs (e.g., Ho, 2008). Because the intrinsic AGN luminosities of the three nuclei are obscured in the optical, we estimate the intrinsic hard X-ray luminosity using the [O III] 5007 luminosity (corrected for internal extinction; Table 2) as a surrogate555Measurements of for optically selected obscured AGNs range from a few to a few hundred (e.g., Heckman et al., 2005; Panessa et al., 2006). Here, we adopt the mean calibration of Panessa et al. (2006), ., finding , , and for A, B, and C, respectively. The non-detection of the system in the ROSAT All-Sky Survey (Voges et al., 1999) is consistent with these estimates. The intrinsic [O III] 5007 luminosities and H equivalent widths (Table 2) are typical of obscured AGNs (e.g., Kauffmann et al., 2003; Ho, 2008). The component B has a strong post-starburst component, as indicated by the strong Balmer absorption in our slit spectrum. This is also seen in its SDSS fiber spectrum which covers the higher order Balmer series and the Balmer break. B is also detected in the FIRST 1.4 GHz survey with an integrated flux density of mJy (Becker et al., 1995). The galaxy is contained in the IRAS faint source catalog (Moshir et al., 1992) with a positional match centered on B, IRAS 10242+1804, with an IR (1–1000 m) luminosity of estimated based on its flux densities at 60 and 100 m from IRAS using the formulae of Helou et al. (1988).
4. Discussion
Based on dynamical friction timescale estimates666Assuming singular isothermal spheres for the density profiles and circular orbits, the dynamical friction timescale for a satellite galaxy with velocity dispersion inspiraling from radius in a host galaxy with velocity dispersion can be estimated as Gyr, where is the Coulomb logarithm (Binney & Tremaine, 1987). for equal mass mergers (Dubinski et al., 1999). We assume A as the host, and B and C as satellites, since A is at the apparent center of the galaxy. Assuming C as the host instead, which has the largest , yields similar estimates for , Myr for A and C, and Myr for B and C, respectively., the stellar components B and C will merge with A in and Myr, respectively, corrected for projection assuming random orientation for . The three SMBHs will inspiral with their individual stellar bulges at first, but will then decay to the center of the merged galaxy under dynamical friction with the stellar background in –200 Myr777Assuming a singular isothermal sphere for the density distribution of the host galaxy, the dynamical friction timescale of a BH of mass on a circular orbit of radius can be estimated as Gyr, where for typical values (Binney & Tremaine, 1987). We estimate that and Myr for the SMBHs in B and C, to reach the center of the merger products of B and C with A, respectively., given their mass estimates (Table 1). However, the actual evolution involving three comparable stellar components and the associated gas is likely more complicated. High resolution kinematics observations (e.g., Amram et al., 2007) combined with tailored numerical modeling (e.g., Renaud et al., 2010) are needed to unravel the merger history and future of this triple system. Regardless of the actual sequence of the mergers, the SMBHs may form a gravitationally interacting triple system, if the orbit of the third SMBH decays rapidly before the first two SMBHs merge.
The fraction of kpc-scale pairs of AGNs is corrected for SDSS spectroscopic incompleteness based on the number of AGN pairs with kpc found in our parent AGN sample (Liu et al. 2011b; see also Liu et al. 2010 and Shen et al. 2011 for a similar estimate of from a complementary approach to identify kpc-scale AGN pairs, based on the selection of AGNs with double-peaked narrow emission lines). This is a lower limit due to the limited imaging resolution of SDSS. Out of the seven kpc-scale triple AGN candidates, we have obtained slit spectra for five systems, including SDSS J1027+1749. The nature of the other four systems seems less clear, due to alternative scenarios involving star clusters or tidal knots, the results of which will be presented in a future paper. Our result suggests that the frequency of kpc-scale triples in optically selected AGNs at is . If we assume that AGNs in successive mergers are independent events with short duty cycles, the expected frequency of kpc-scale triple AGNs based on the observed frequency of doubles would be . Our observed frequency of triples implies a higher probability than this, which may suggest that AGNs in mergers are somewhat correlated, although better statistics is needed to draw any firm conclusion.
While our slit spectra of the three nuclei suggest that they all host AGNs, optical identification alone is inconclusive. Alternatively, there could be only two or even just one active SMBH, ionizing all the three gas components in the merging system. To discriminate between these scenarios, arguments based on the ionization parameter and effective size of the narrow-line region are not very useful (e.g., Liu et al., 2010; Shen et al., 2011), because the separation between the nuclei are not much larger than the individual size of the gas-emitting regions, and the electron density measurements are highly uncertain (Table 2). Chandra X-ray observations could help pin down the triple AGN nature of the system.
References
- Abazajian et al. (2009) Abazajian, K. N., et al. 2009, ApJS, 182, 543
- Amaro-Seoane et al. (2010) Amaro-Seoane, P., Sesana, A., Hoffman, L., Benacquista, M., Eichhorn, C., Makino, J., & Spurzem, R. 2010, MNRAS, 402, 2308
- Amram et al. (2007) Amram, P., Mendes de Oliveira, C., Plana, H., Balkowski, C., & Hernandez, O. 2007, A&A, 471, 753
- Baldry et al. (2004) Baldry, I. K., Glazebrook, K., Brinkmann, J., Ivezić, Ž., Lupton, R. H., Nichol, R. C., & Szalay, A. S. 2004, ApJ, 600, 681
- Baldwin et al. (1981) Baldwin, J. A., Phillips, M. M., & Terlevich, R. 1981, PASP, 93, 5
- Barth et al. (2008) Barth, A. J., Bentz, M. C., Greene, J. E., & Ho, L. C. 2008, ApJ, 683, L119
- Becker et al. (1995) Becker, R. H., White, R. L., & Helfand, D. J. 1995, ApJ, 450, 559
- Begelman et al. (1980) Begelman, M. C., Blandford, R. D., & Rees, M. J. 1980, Nature, 287, 307
- Bernardi et al. (2003) Bernardi, M., et al. 2003, AJ, 125, 1866
- Binney & Tremaine (1987) Binney, J., & Tremaine, S. 1987, Galactic dynamics, ed. Binney, J. & Tremaine, S.
- Blaes et al. (2002) Blaes, O., Lee, M. H., & Socrates, A. 2002, ApJ, 578, 775
- Bruzual & Charlot (2003) Bruzual, G., & Charlot, S. 2003, MNRAS, 344, 1000
- Cardelli et al. (1989) Cardelli, J. A., Clayton, G. C., & Mathis, J. S. 1989, ApJ, 345, 245
- Djorgovski et al. (2007) Djorgovski, S. G., Courbin, F., Meylan, G., Sluse, D., Thompson, D., Mahabal, A., & Glikman, E. 2007, ApJ, 662, L1
- Dubinski et al. (1999) Dubinski, J., Mihos, J. C., & Hernquist, L. 1999, ApJ, 526, 607
- Greene & Ho (2006) Greene, J. E., & Ho, L. C. 2006, ApJ, 641, 117
- Heckman et al. (2005) Heckman, T. M., Ptak, A., Hornschemeier, A., & Kauffmann, G. 2005, ApJ, 634, 161
- Helou et al. (1988) Helou, G., Khan, I. R., Malek, L., & Boehmer, L. 1988, ApJS, 68, 151
- Hernquist (1989) Hernquist, L. 1989, Nature, 340, 687
- Ho (2008) Ho, L. C. 2008, ARA&A, 46, 475
- Ho et al. (1997) Ho, L. C., Filippenko, A. V., & Sargent, W. L. W. 1997, ApJS, 112, 315
- Ho et al. (2009) Ho, L. C., Greene, J. E., Filippenko, A. V., & Sargent, W. L. W. 2009, ApJS, 183, 1
- Hoffman & Loeb (2007) Hoffman, L., & Loeb, A. 2007, MNRAS, 377, 957
- Iwasawa et al. (2006) Iwasawa, M., Funato, Y., & Makino, J. 2006, ApJ, 651, 1059
- Kauffmann et al. (2003) Kauffmann, G., et al. 2003, MNRAS, 346, 1055
- Kewley et al. (2006) Kewley, L. J., Groves, B., Kauffmann, G., & Heckman, T. 2006, MNRAS, 372, 961
- Kormendy & Richstone (1995) Kormendy, J., & Richstone, D. 1995, ARA&A, 33, 581
- Liu et al. (2010) Liu, X., Greene, J. E., Shen, Y., & Strauss, M. A. 2010, ApJ, 715, L30
- Liu et al. (2011a) Liu, X., Shen, Y., & Strauss, M. A. 2011a, arXiv:1104.0951
- Liu et al. (2011b) Liu, X., Shen, Y., Strauss, M. A., & Hao, L. 2011b, arXiv:1104.0950
- Liu et al. (2009) Liu, X., Zakamska, N. L., Greene, J. E., Strauss, M. A., Krolik, J. H., & Heckman, T. M. 2009, ApJ, 702, 1098
- Lousto & Zlochower (2008) Lousto, C. O., & Zlochower, Y. 2008, Phys. Rev. D, 77, 024034
- Lutz et al. (1999) Lutz, D., Veilleux, S., & Genzel, R. 1999, ApJ, 517, L13
- Merritt (2006) Merritt, D. 2006, Reports on Progress in Physics, 69, 2513
- Milosavljević & Merritt (2001) Milosavljević, M., & Merritt, D. 2001, ApJ, 563, 34
- Moshir et al. (1992) Moshir, M., Kopman, G., & Conrow, T. A. O. 1992, IRAS Faint Source Survey, Explanatory supplement version 2, ed. Moshir, M., Kopman, G., & Conrow, T. A. O.
- Osterbrock (1989) Osterbrock, D. E. 1989, Astrophysics of gaseous nebulae and active galactic nuclei, ed. Osterbrock, D. E.
- Panessa et al. (2006) Panessa, F., Bassani, L., Cappi, M., Dadina, M., Barcons, X., Carrera, F. J., Ho, L. C., & Iwasawa, K. 2006, A&A, 455, 173
- Peng et al. (2010) Peng, C. Y., Ho, L. C., Impey, C. D., & Rix, H. 2010, AJ, 139, 2097
- Renaud et al. (2010) Renaud, F., Appleton, P. N., & Xu, C. K. 2010, ApJ, 724, 80
- Shen et al. (2011) Shen, Y., Liu, X., Greene, J. E., & Strauss, M. A. 2011, ApJ, 735, 48
- Skrutskie et al. (2006) Skrutskie, M. F., et al. 2006, AJ, 131, 1163
- Tody (1986) Tody, D. 1986, in Society of Photo-Optical Instrumentation Engineers (SPIE) Conference Series, ed. D. L. Crawford, Vol. 627, 733
- Toomre & Toomre (1972) Toomre, A., & Toomre, J. 1972, ApJ, 178, 623
- Tremaine et al. (2002) Tremaine, S., et al. 2002, ApJ, 574, 740
- Valtonen (1996) Valtonen, M. J. 1996, MNRAS, 278, 186
- Veilleux & Osterbrock (1987) Veilleux, S., & Osterbrock, D. E. 1987, ApJS, 63, 295
- Voges et al. (1999) Voges, W., et al. 1999, A&A, 349, 389
- York et al. (2000) York, D. G., et al. 2000, AJ, 120, 1579
- Yu (2002) Yu, Q. 2002, MNRAS, 331, 935