Quantified H i Morphology III: Merger Visibility Times from H i in Galaxy Simulations
Abstract
Major mergers of disk galaxies are thought to be a substantial driver in galaxy evolution. To trace the fraction and the rate galaxies are in mergers over cosmic times, several observational techniques, including morphological selection criteria, have been developed over the last decade. We apply this morphological selection of mergers to 21 cm radio emission line (H i) column density images of spiral galaxies in nearby surveys. In this paper, we investigate how long a 1:1 merger is visible in H i from N-body simulations.
We evaluate the merger visibility times for selection criteria based on four parameters: Concentration, Asymmetry, and the Gini parameter of second order moment of the flux distribution (). Of three selection criteria used in the literature, one based on Concentration and works well for the H i perspective with a merger time scale of 0.4 Gyr. Of the three selection criteria defined in our previous paper, the performs well and cleanly selects mergers for 0.69 Gyr. The other two criteria (A- and C-), select isolated disks as well, but perform best for face-on, gas-rich disks ( Gyr). The different visibility scales can be combined with the selected fractions of galaxies in any large H i survey to obtain merger rates in the nearby Universe. All-sky surveys such as WALLABY with ASKAP and the Medium Deep Survey with the APETIF instrument on Westerbork are set to revolutionize our perspective on neutral hydrogen and will provide an accurate measure of the merger fraction and rate of the present epoch.
keywords:
1 Introduction
The merger rate of galaxies over cosmic times is one of the big outstanding questions in the evolution of galaxies. Two recent major observational efforts seek to address the rate of galaxy mergers, one using close galaxy pairs (e.g., Patton et al., 1997; Le Fèvre et al., 2000), and one using quantified morphology (e.g., Conselice, 2003; Lotz et al., 2004). Both give a fraction of the population at a given redshift that is merging () which then can be converted to a merger rate as soon as one knows how long a merger is identifiable as either a galaxy pair or morphologically disturbed galaxy. Hence, both methods need a timescale for which mergers are identified as such. In this series of papers, we focus on the morphological approach, specifically the morphology of galaxies in the 21 cm emission line (H i). Despite the generally lower resolution of the H i maps compared to optical images, we argue that the morphological signature of a merger event can be equally or better observed because (a) the H i disk extends well beyond the stellar disk (i.e., offers the same number of resolution elements as the optical disk), and (b) the atomic gas is disturbed well before the stellar disk. Therefore, H i morphology looks promising as an alternate tracer of mergers, provided representative enough volumes are surveyed.
A popular measure of the merger signal in galaxy morphology uses the Concentration-Asymmetry-Smoothness parameters (CAS, Conselice, 2003), but additional parameters such as Gini (G) and (Lotz et al., 2004) are used extensively as well. The merger signal is usually found in the restframe ultraviolet or B-band, calibrated by galaxies in the local Universe. The timescale on which a merger is identifiable is found from CAS or G and measurements of N-body simulations of mergers (Conselice, 2006; Lotz et al., 2008, 2010a, 2010b) or alternatively from the decline in identified mergers between two nearby redshift bins, assuming only passive evolution in merger rate (Conselice, 2009). Both approaches give consistent estimates of the merger time-scale of about a Gyr or less, allowing for estimates of the typical number of mergers a massive galaxy undergoes during its lifetime (Conselice, 2006, 2009; Lotz et al., 2008). A limitation is that morphological identification of mergers is most effective for gas-rich galaxies (Lotz et al., 2010a) and varies with the mass ratio of the merging galaxies (e.g., Lotz et al., 2010b).
All previous work on quantified galaxy morphology as a merger tracer ha focused on rest-frame ultraviolet or the blue side of optical. The benefits are clear for this technique as the higher redshift galaxies can be observed with the Hubble Space Telescope at these wavelengths at comparable spatial resolution to the local reference samples observed by GALEX or the Sloan Digital Sky Survey (SDSS). Star formation triggered by the merger increases surface brightness, easing their identification at higher redshift.
However, in the coming decade, a new window on gas-rich mergers will be opening up with the commissioning of new radio telescopes and instruments: the South African Karoo Array Telescope (MeerKAT; Jonas, 2007; Booth et al., 2009; de Blok et al., 2009), the Australian SKA Pathfinder (ASKAP; Johnston, 2007; Johnston et al., 2007, 2008a, 2008b, 2009), the Extended Very Large Array (EVLA; Napier, 2006) and the APERture Tile In Focus instrument (APERTIF; Verheijen et al., 2008; Oosterloo et al., 2009) on the Westerbork Synthesis Radio Telescope (WSRT). Ultimately, this investment in radio observatories will culminate in the Square Kilometer Array (SKA; Carilli & Rawlings, 2004). These observatories will extend the 21 cm line observations of galaxies to high redshift and low column densities. Specifically, the effective all-sky survey of the nearby Universe with ASKAP (the WALLABY project, Koribalski et al. in preparation) and the Medium Deep Survey with WSRT/APERTIF spans an ideal volume for a local merger fraction and rate measurement. The H i disk’s morphology can be an alternative tracer of the merger fraction and consequently merger rate. There is already ample anecdotal evidence for the sensitivity of H i morphology to interaction (e.g., “The H i Rogue Galaxy Gallery”, Hibbard et al., 2001, http://www.nrao.edu/astrores/HIrogues/), and more quantified relations between density and H i morphology exist (e.g., Bouchard et al., 2009).
In this series of papers, we explore how well the parameterized H i morphology trace mergers in two local H i surveys: the H i Nearby Galaxy Survey (THINGS, Walter et al., 2008a) and the Westerbork H i Spiral Project (WHISP, van der Hulst et al., 2001; van der Hulst, 2002). We have found that the H i column density maps – while at typically lower spatial resolution than the optical wavelengths– are just as sensitive if not more so to the effects of a merger, especially when expressed in the morphological qualifiers customarily used in optical or UV classification (Holwerda et al., 2009, 2011b). For the first time, it may be possible to select ongoing merging galaxies from their H i morphology without any need for a human observer. This will greatly simplify the classification of galaxies and mergers in the upcoming all-sky H i surveys.
In a subset of the WHISP sample we showed that there is a simple cut in morphological parameter space that divides the merging disks from the general non-merging population (Holwerda et al., 2011c). The question remains, however, how long a merger is identifiable in this new window before we can convert an observed merger fractions in WHISP to a merger rate (our fifth paper, Holwerda et al., 2011a). In this paper, we explore the merger visibility timescale using N-body simulations of disks with cold gas disks, both evolving passively and undergoing a violent 1:1 merger with a similar disk. The organisation of this paper is as follows: section 2 discusses the morphological parameters we use briefly, section 3 describes the simulations we used, how the H i map was generated, and the limitations of these simulations and the H i perspective. Section 4 is a discussion of our results from the N-body simulation, and section 5 our conclusions.
2 Morphology
In this series of papers we use the CAS system (Concentration-Asymmetry-Smoothness) from Bershady et al. (2000); Conselice et al. (2000); Conselice (2003), the Gini/ system from Lotz et al. (2004) and our own parameter , the Gini parameter of the second order moment (Holwerda et al., 2011c). Concentration is defined as:
| (1) |
where is the radius which includes that percentage of the intensity of the object. In an image with pixels with intensities at pixel position and is the value of the pixel in the rotated image, Asymmetry is:
| (2) |
and Smoothness is defined as:
| (3) |
where is the same pixel in the image after smoothing.
The Gini parameter is an economic indicator of equality, i.e., G=1; all the flux in one pixel, G=0; equal values for all pixels in the object. We use the implementation from Lotz et al. (2004):
| (4) |
where is the intensity of pixel in an flux-ordered list of the pixels in the object, and the mean pixel intensity.
They also introduced the parameter:
| (5) |
where . The center of the object is at (,). and pixel is the pixel marking the top 20% point in the flux-ordered pixel-list.
Instead of the intensity of the pixel () one can use the second order moment of the pixel () in equation 4. This is our parameter:
| (6) |
which is an indication of the spread of pixel values with distance to the galaxy centre. The combination of these parameters quantify the morphology of H i column density maps. We refer the reader for a broader discussion of these parameters in the previous papers of this series (Holwerda et al., 2011b, c).
As input these parameters need an estimate of the centre of the object and a definition of the area over which they need to be computed. The centres of the objects are a given, in the case of the simulations as the centre of the dark matter halo. In the case of surveys as the centre of the light distribution. To define the extent of the H i disk , we use a threshold of cm-2. This defines the area over which the morphological parameters are computed. This threshold is the stated observational limit of the WHISP survey (van der Hulst et al., 2001; van der Hulst, 2002), and it is in between the two H i column density thresholds we used in Holwerda et al. (2009, 2011b) for the extent of the the stellar and gas disks in the THINGS survey (Walter et al., 2008b).
Starting with the snapshots of the H i in simulations, we explore in this paper the evolution of the above morphological parameters over time, both during a violent merger as well as the passive evolution in a few isolated disks. We determine how long a merging disk spends in the morphological parameter space that hosts mergers as a function of viewing angle and physical disk characteristics. We found this space both from literature definitions for optical morphology and empirically in the WHISP sample for H i morphology (Holwerda et al., 2011c). Visibility time scales can then be used to convert an observed fraction of merging galaxies into a merger rate –the number of galaxies merging in a given volume per Gyr– as applied to the whole WHISP sample in the companion paper Holwerda et al. (2011a). One caveat that we need to point out from the outset, is that our merger simulations are for 1:1 merger of massive spiral disks and the WHISP sample consists of a mix of galaxy masses (see Appendix B in the online version of the paper). Future suites of merger simulations should include a wider mass range and gas fraction.
3 Simulations of Merging and Isolated Spiral Disks
Our primary set of simulations is a suite of equal mass mergers from Cox et al. (2006a), from which an atomic hydrogen component was estimated by one of us (T.J. Cox) assuming thermal equilibrium. H i maps for a control sample of isolated spiral disks, passively evolving for 2.5 Gyr, were constructed in the same manner.
To gauge the importance of different implementations of a Milky Way size disk in a merger simulation, we also use a single merger simulation and isolated disk simulation from Weniger et al. (2009), also converted to an H i column density map. The code, assumed physics and timescales are different for the Weniger simulations (see §4.3).
All the merger simulations are for equal mass mergers of two large spiral galaxies. The suite from Cox et al. and the single simulation from Weniger et al. are for spiral galaxies of similar scale and mass (see Tables 1 and 2).
3.1 Simulations from Cox et al. 2006
The merger simulations suite from Cox et al. (2006a) use the N-body/SPH code GADGET (Springel et al., 2001; Springel & Hernquist, 2002). It conserves entropy and features additional routines that track the radiative cooling of gas and star formation (Volker Springel, private communication to T.J. Cox in 2001). In addition, Cox et al. (2006a) implemented several new features themselves: stellar feedback, metallicity-dependent cooling and the ability of each gas particle to spawn multiple new stellar particles.
The simulations are for the isolated disks as well as the major mergers with variations in disk properties and viewing angles (Table 3). All these simulations run for 2.5 Gyr in steps of 100 Myr. Images are surface brightness values in with a pixelscale of 150 pc. The high resolution of these simulations enabled us to construct H i maps with sampling much finer than any current survey (See Table B.1 (in the online appendix), and closer to the resolution typical for optical images. The nominal disks in these simulations are spirals with a gas disk (unless noted differently), which, in the case of mergers, interacts with an identical disk.
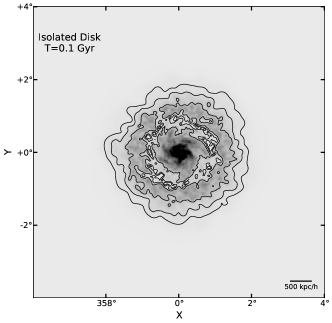
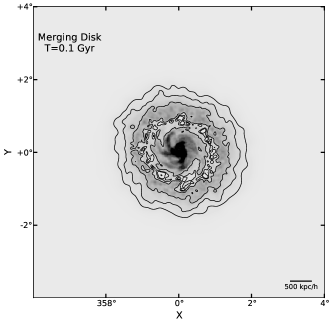
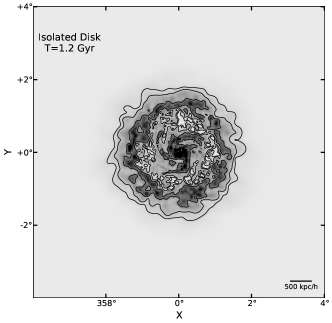
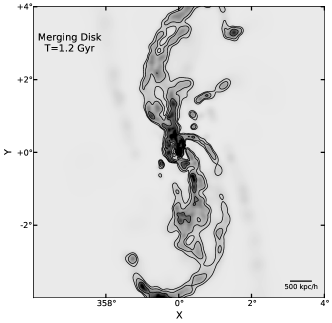
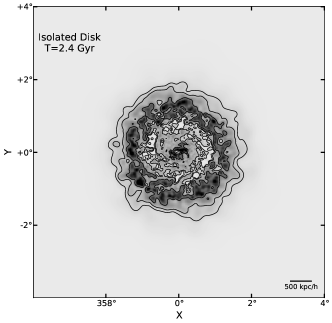
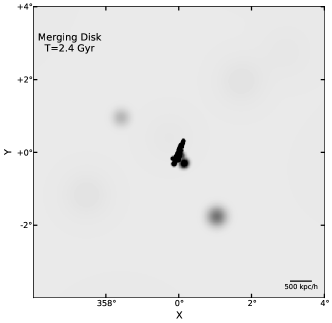
Significant disk properties that are varied are mass (high-m and low-m), and the treatment of the feedback from star-formation on the interstellar matter (ism2). We consider three orientations: face-on, at a 45∘ angle (orientation2) and edge-on (edge-on). Examples of the face-on disks, isolated and merger, are shown in Figure 1 and Appendix A (online version). For more details on these simulations, we refer the reader to Cox et al. (2006a) and Cox et al. (2006b).
| Cox et al 2006 | Weniger et al 2009 | |||
|---|---|---|---|---|
| Component | Mass fraction | Nr of particles | Mass fraction | Nr. of particles |
| Bulge-stars | 0.012 | 10 000 | 0.069 | 10 000 |
| Disk-stars | 0.048 | 30 000 | 0.118 | 75 098 |
| Clouds | 0.016 | 36 347 | ||
| Gas-particles | 0.065 | 30 000 | 0.008 | 9017 |
| DM-particles | 0.8 75 | 100 000 | 0.789 | 100 000 |
| Total Mass | 8.12 | 170 000 | 2.46 | 230462 |
| Cox et al 2006 | Weniger et al 2009 | |
|---|---|---|
| Component | (kpc) | (kpc) |
| Disk | ||
| - scalelength, | 4.0 | 4.0 |
| - scaleheight, | 1.0 | 0.4 |
| Gas scalelength | 16.5 | |
| Bulge scalelength, | 0.45 |
| isolated | |
|---|---|
| face-on | reference, total disk mass |
| edge-on | same but edge-on perspective |
| high-mass | face-on perspective on |
| low-mass | face-on perspective on |
| mergers | |
| face-on | |
| run 1 | face-on perspective on two |
| disks collision | |
| run 2 | same with slightly different collision orbit. |
| orientation | |
| 45∘ | same at a 45∘ camera angle |
| edge-on | same for edge-on camera |
| disk mass | |
| high-mass | face-on perspective on two |
| low-mass | face-on perspective on two |
| different ISM | different ISM feedback treatment, |
| see Cox et al. (2006a) | |
| high-mass | with disks. |
| low-mass | with disks. |
3.2 The single merger simulation from Weniger et al (2009)
As a consistency check, we apply our morphological code to the single merger simulation from Weniger et al. (2009), as well as a single isolated disk simulation. Following Harfst et al. (2006), they constructed the initial galaxies by firstly generating a disk/bulge/halo - system using the method of Kuijken & Dubinski (1995). In their next step, one fifth of the stellar disk particles were transformed into molecular clouds and finally the diffuse ISM was added as an initially slowly rotating homogeneous sphere, which will collapse in the first 200 Myr forming a warm disk. The collision-less model of Kuijken & Dubinski (1995) realises an equilibrium configuration but in this case, the equilibrium is affected by adding the ISM. Therefore, Weniger et al. (2009) first follow the system s evolution, until a quasi-equilibrium is established. The numerical integration is done by means of a TREE-SPH code combined with the sticky particle method (Theis & Hensler, 1993). Gravitational forces are determined by the DEHNEN-Tree (Dehnen, 2002). The cold gas () in this simulation was converted to the H i map, assuming that the fraction of the cold gas which is observable as H i, depends on the thermal pressure. The HI map was smoothed by a gaussian with a FWHM of 1 kpc. The centre of the interacting disk is taken to be the centre of the bulge stars distribution. Time steps are 10 and 50 Myr for the isolated disk and merger simulation, respectively. For more details we refer the reader to Harfst et al. (2006) and Weniger et al. (2009).
3.3 Limitations
The suite of simulations of isolated and merging disks form Cox et al. (2006a) as well as the implementation check from Weniger et al. (2009) are limited in their scope of disk (and merger) properties, i.e., only a large, gas-rich spiral disk colliding with its twin or evolving passively. There are only three different disk masses and camera angles, and no change in merger impact parameter of incident angle (see Table 3). We limited our scope to this suite as we could easily obtain H i maps for these simulations and still be consistent in treatment of physics and particle resolution across the sample (with the Weniger implementation as the exception). Our second reason was that simulations of isolated disks with identical physics and resolution evolving for a similar amount of time were available.
Future simulations of the evolution of H i morphology should include more minor mergers, a greater range in disk mass, a range in gas fraction, different impact parameters and incident angles of the mergers, as well as more camera angles. The suite of simulations presented in Lotz et al. (2010a, b) explore parameter space more, generating optical morphology measures. A similar effort will be needed in H i before volume-limited all-sky surveys in H i are completed to complement the initial effort presented in this paper.
3.4 Shaping the H i Morpholgy
The morphology of the H i disk is influenced by many different processes, only one of which is gravitational interaction with a neighbouring galaxy. The morphology is also determined by the level of star-formation (triggered or not by the interaction), which consumes gas, and the stellar winds and supernovae feedback that create the typical ”effervescent” look of H i maps. An additional effect from star-formation (or an active AGN) can be that much of the gas in a galaxy is heated or ionized, and thus no longer visible in the H i map. Depending on the temperature and dust fraction of the ISM, much of the higher density parts of the spiral gas disk will be in the form of molecular hydrogen, also removing it from the H i map. Ram-pressure effects experience during travel through the intergalactic medium of a cluster may also contribute significantly to the appearance of the H i disk.
The simulations treat ISM feedback from star-formation comprehensively but for now, we set aside the effects of an AGN switching on or the interaction happening in a dense cluster medium. In a further paper in this series (Holwerda et al., 2011d), we do explore the how much ram-pressure and H i stripping of galaxies change these parameters using the VLA Imaging of Virgo spirals in Atomic gas (VIVA, Chung et al., 2009). We find that stripped H i disks are easily identified with low values of Concentration. The effect of moderate ram-pressure on a sample of H i disks will, however, be more difficult to quantify. The phenomena of H i lopsidedness, which may be related to ram-pressure stripping seems to have only a moderate effect on these parameters (see Holwerda et al., 2011c).
Therefore, we compare morphological evolution of H i disks with the same physics (feedback, ISM heating, etc.), in identical disks, and only change one critical aspect: in some simulations these disks merge with a similar disks, in others, they evolve passively.
4 H i Morphology of Major Mergers
We have run four isolated disks and eight merger simulations over a time of 2.5 Gyr (Cox et al., 2006a) and a single simulation of a major merger and one isolated face-on disk that ran for 3 Gyr (Weniger et al., 2009). The resulting tables of morphological parameters over time can be found in Appendix B (online version) for both isolated and merging disks. The default perspective is face-on, with variation in disk mass and treatment of the ISM (Table 3).
4.1 Merging and Isolated Disks
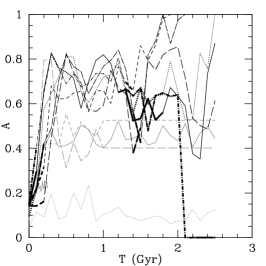
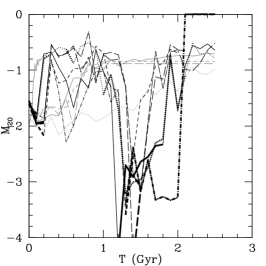
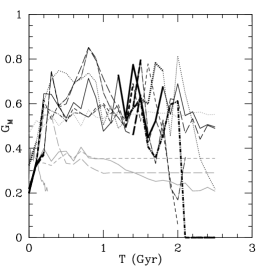
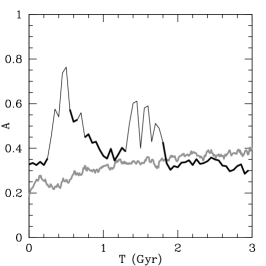
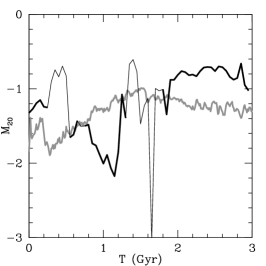
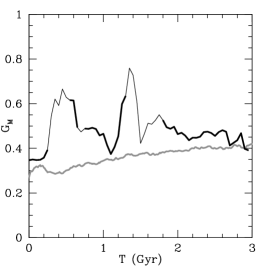
Figure 2 shows the progression over time of three parameters for both the merger scenarios (black lines) as well as the isolated disks (gray lines) for the H i disks. We note how these three parameters already separate isolated disks and the merging ones as well as identify the times the galaxies are interacting the strongest.
All three parameters show a clear parameter space where the galaxy disk is almost certainly merging (, , and A 0.5) and a part where it is unlikely to be merging. In the case of and , the merging disks return to the isolated disk’s value periodically. Their values spike at the time of close passage of the merging companion. Variation of the disk mass (low-m and high-m simulations) do not change the overall morphological signature appreciably.
4.2 Edge-on Disks
Edge-on galaxies are morphologically the least disturbed perspective on a merger. Figure 3 shows the isolated disk and merging disk in cold gas, just from the edge-on perspective (dotted lines in Figure 2). The merger is still morphologically selected by our selection criterion (see §4.4), albeit not very often. However, in the case of the edge-on perspective, any signature in the dynamical profile of the galaxy will be the strongest, i.e., there will be a clear deviation of the typical “double-horned” profile of the H i line. Thus, our morphological approach and a kinematic approach to selecting interacting spirals in large H i survey are very complementary.
4.3 Comparison to Weniger et al
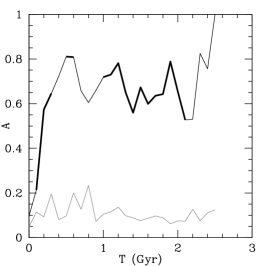
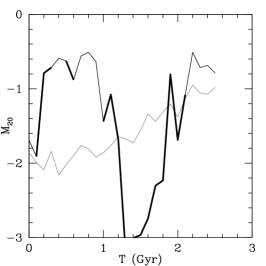
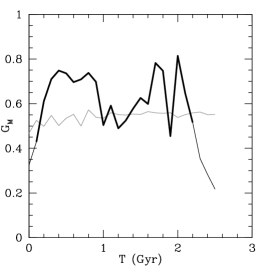
Figure 4 shows the values of Asymmetry, and of the H i maps for a merging and an isolated galaxy from the simulation from Weniger et al. (2009). Asymmetry shows a steady rise with time for the isolated disk and clear spikes during the major encounters. displays a very similar evolution as the plot in Figure 2 with some notable evolution by the isolated disk. spikes at the close encounters, very similar to Asymmetry.
The morphological selection criteria (see next section), perform well on the Weniger et al. simulation, selecting the merging galaxy for part of the time and mostly not selecting the isolated galaxy’s H i disk. The times, in billions of years, the Weniger et al merger are selected by the various morphological criteria are listed at the bottom of Table 4. The general similar behavior of the Weniger et al. simulation to the suite from Cox et al. is an indication of the robustness of the morphological selection.
4.4 Merger Selection Criteria
The goal of this paper is to obtain a typical time scale that mergers are visible as disturbed H i morphologies. The visibility time depends on the selection criteria, observed wavelength and orientation of the merger. We can now explore how the visibility times for each visibility criterion relate to the different physical properties of each merger run, e.g., gas mass, viewing angle, etc.
Originally these parameters were envisaged to classify the morphologies of galaxies and hence a single parameter criterion will not necessarily work. Interacting spiral disks are a subset of the parameter-space occupied by late-types. Conselice (2003) and Lotz et al. (2004) introduced several different criteria for the selection of merging systems in their respective parameter systems. For optical data, Conselice (2003) define the following criterion:
| (7) |
with some authors requiring A S as well. In general, highly asymmetric galaxies are candidate merging systems (Figure 2).
Lotz et al. (2004) added two different criteria using Gini and :
| (8) |
and
| (9) |
The latter being a refinement of the Conselice et al criterion in equation 7.
These criteria were developed for optical morphologies, typically observed Johnson-B or sdss-g. Typical optical spatial resolution (”) is a factor of a few higher than the typical spatial resolution of the H i maps (6-12”, depending on the survey). Therefore, in the third paper in this series (Holwerda et al., 2011c), we defined several possible criteria specifically for the H i perspective using the CAS-G/- space of the WHISP survey H imap sample. We defined the Gini parameter of the second order moment, and a criterion that selected most interacting galaxies:
| (10) |
a criterion that seems to be corroborrated by Figure 2.
Earlier in this series, we speculated that a combination of Asymmetry and could well be used to select interaction in H i morphology in (Holwerda et al., 2011b). In Holwerda et al. (2011c), we defined this criterion as:
| (11) |
Finally, we also defined one based on Concentration and , following the example of the Lotz et al. (2004) criteria (eq. 8 and 9):
| (12) |
In (Holwerda et al., 2011b), we found that this last criterion selected to both the correct fraction of interacting galaxies as well as agree most often with the previous visual identifications in the case of individual WHISP galaxies.
We can now explore the timescales of each of these criteria, both those from the literature as well as those we determined in the WHISP sample subset. The most reliable merger selection criterion would be the one that selects the right fraction of galaxies out of a given sample for a long timescale, with little contamination from isolated galaxies. Preferably, viewing angle or physical disk characteristics (e.g., gas mass) do not influence the timescale overly much. A long selection time scale would subsequently ensure the more accurate estimate of the merger rate from a given volume of galaxies.
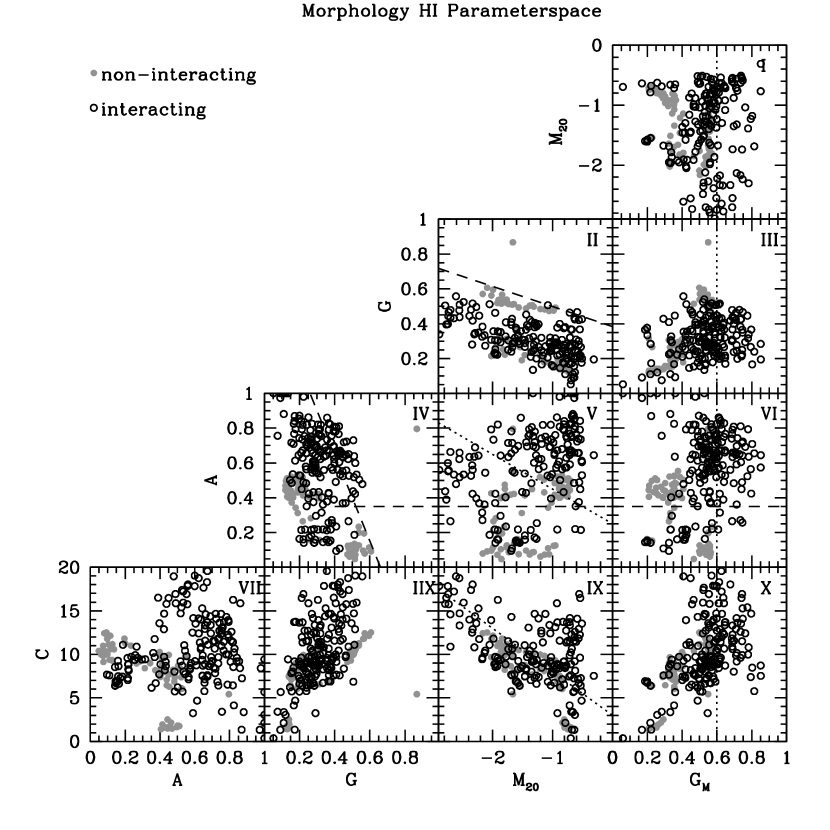
Figure 5 shows the relations between the morphological parameters for the H i gas disks in the Cox et al. simulations, similar to Figure 4 in Holwerda et al. (2011c), from which we determined the selection criteria for H i morphologies (eq. 10-12). The literature and our merger selection criteria are marked with dashed and dotted lines respectively. The times an H i disk is selected by the various selection criteria are listed in Table 4.
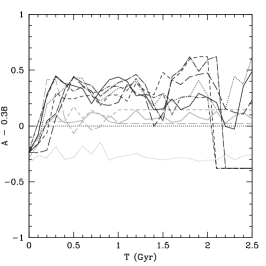
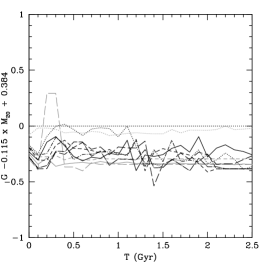
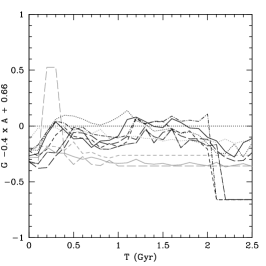
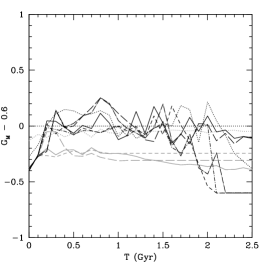
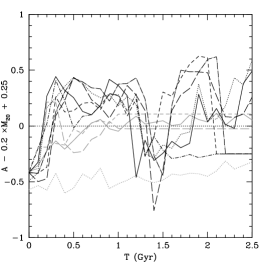
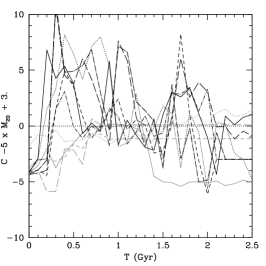
Figure 6 shows the six criteria (eq. 7–12) as a function of time for all our simulations, both isolated and merging disks. If the y-axis values are positive, the merger would have been selected by this criterion. Immediately, it is apparent, that the three criteria that we defined in Holwerda et al. (2011c) perform very well, separating merging galaxies from isolated disks. It also is clear that selection happens most often in the fist 1.5 Gyr of the merger simulations and that some of the criteria could be adjusted for the native resolution of these simulations.
The selection by Asymmetry alone (eq. 7 or similar) does not translate well to H i. Asymmetry alone selects isolated and merging galaxy almost equal times (Figure 6, top left panel, Table 4). This validates what we found for this criterion in the WHISP sample and our suspicion in Holwerda et al. (2011b) that H i Asymmetry is influenced by other factors than merging. From Figure 6, one could conclude that a more strickt Asymmetry criterion would work better but this is only valid for the resolution of our simulations. The Gini- criterion (eq. 8) would need to be modified for the H i perspective and performs poorly in the separation of mergers from isolated disks in its current definition (Figure 6, top middle panel). The Gini-Asymmetry criterion (eq. 9, Figure 6 top right panel) performs much better, very rarely selecting the isolated disk and selecting mergers on average for 0.44 Gyr out of the 2.5 Gyr the simulations ran.
However, these simulations ran on the maximum spatial resolution (150 pc sampling). The selection criteria perform a little poorer for lower resolution (Appendix B in the electronic edition). For example, the – selection criterion (eq. 9), still performs well for the WHISP survey observational parameters (Table LABEL:t:WHISP) but with a typical selection time scale of 0.15 Gyr. These merger visibility times are close to the ones typically quoted for these selection criteria applied to optical images of stellar disks (e.g., Lotz et al., 2010a, b).
Of the literature criteria, only the G-A one appears to translate directly from optical to H i morphology. Our selection criteria (eq. 10–12) were based on a WHISP subsample of H i column density maps for which we had visual estimates of interaction. Our criterion (eq. 10) cleanly select mergers for 0.69 Gyr of the 2.5 Gyr runtime (Figure 6, bottom left panel). The selection becomes diluted, however, when the simulations are smoothed to the WHISP resolution (Table B.3 online appendix) or worse (e.g., VIVA, Table B.4 online appendix). The – selection criterion (eq. 11) appeared to work extremely well in the WHISP data. Yet, in the simulations, it selects isolated disks more often, on average, than merging ones (Figure 6, bottom middle panel). One can conceivable still use criteria like this one, provided the selected galaxy fraction is corrected for the contamination by isolated disks. Or the criterion is adjusted to the resolution of the data. The Concentration- criterion (eq. 12) performs better, selecting mergers for 1.19 Gyr versus isolated disks for 0.69 Gyr, but would also need a substantial correction for the isolated disk contaminations (Figure 6, bottom right panel). We note that the main reason isolated disks are selected by this criterion are the low gas-mass and edge-on disk simulation and this criterion performs much better for the low inclination disks. Contamination increases again when the simulations are degraded to WHISP resolution (Table B.3 in the online appendix).
In Holwerda et al. (2011c), we found that the Concentration- criterion flagged not only the correct fraction of galaxies as merging but also agreed in many cases with the visual classifications on which galaxies were interacting. Here we find that the merger visibility time scale is in a similar range or even a little better than the selection criteria from the literature for optical images of disks (typically 1 Gyr). Thus, depending on the volume surveyed and the spatial resolution of the survey, an H i survey of disks can provide an estimate of the merger rate at least as accurate as any optical one using these parameters.
Lotz et al. (2010a) note that gas-rich mergers tend to be selected more often in the optical morphological selections, because gas rich mergers trigger more star-formation, which leaves brighter tidal features in the disks before full merger. A similar selection biases is pertinent for H i morphology: more gas-rich disks will stand out in 21 cm. observations. Lowering or increasing the gas-mass of the disks, does influence the selection times, as does a different treatment of the ISM physics ( or the Weniger simulation), increasing the variance in merger visibility times.
The perspective or camera angle on the merger does influence the selection time for all the different criteria. Oddly, the edge-on perspective appears to occasionally raise the time a merger gets selected by some of the morphological parameter criteria. However, this can be expected to be the poorest viewing angle, regardless whether or not the morphology is determined in H i or optical.
The changes in perspective, gas disk mass and ISM treatment for different simulations give an indication of the spread in merger visibility times in Table 4, which is substantial. Therefore, we can determine an accurate merger fraction for a sample of galaxies associated with a known volume, yet the merger rate will still be subject to some uncertainty due to the range in possible merger visibility times. With these average values in Table 4 in hand, morphologically selected fraction of an H i survey can now be converted to a merger rate with reasonable accuracy (Holwerda et al., 2011a).
| Criterion | 1 | 2 | 3 | 4 | 5 | 6 | 7 | 8 |
| isolated | ||||||||
| face-on | 2.2 | 0 | 0 | 0 | 0.8 | 0.2 | 0 | 0.1 |
| high-mass | 2.4 | 0 | 0 | 0 | 0.6 | 0 | 0 | 0 |
| low-mass | 2 | 0.1 | 0.1 | 0 | 2.2 | 1.7 | 0 | 1.7 |
| edge-on | 0 | 0 | 0 | 0 | 2.5 | 0.9 | 0 | 0.9 |
| mean | 1.63 | 0 | 0 | 0 | 1.53 | 0.68 | 0 | 0.65 |
| rms | 1.01 | 0.007 | 0 | 0 | 0.70 | 0.48 | 0 | 0.51 |
| mergers | ||||||||
| face-on run 1 | 1.2 | 0 | 0.4 | 0.6 | 1.9 | 0.5 | 0.4 | 0.1 |
| face-on run 2 | 2.1 | 0 | 0.5 | 0.9 | 0.9 | 1.5 | 0.3 | 0.4 |
| 45∘ | 1.3 | 0 | 0.5 | 0.6 | 1.9 | 1.1 | 0.4 | 0.6 |
| edge-on | 2.3 | 0 | 1 | 1.2 | 0.7 | 1.3 | 0.2 | 0.2 |
| high-m | 1.7 | 0 | 0.3 | 0.4 | 0.9 | 1 | 0.1 | 0 |
| low-m | 2.1 | 0 | 0 | 0.9 | 0.4 | 1.4 | 0 | 0 |
| ism2 high-m | 1.9 | 0 | 1 | 0.1 | 1.5 | 0.9 | 0.1 | 0.5 |
| ism2 low-m | 1.9 | 0 | 0 | 0.7 | 0.8 | 1.1 | 0 | 0 |
| mean | 1.9 | 0 | 0.44 | 0.69 | 1.01 | 1.19 | 0.16 | 0.24 |
| rms | 0.4 | 0 | 0.12 | 0.21 | 0.33 | 0.20 | 0.02 | 0.05 |
| Weniger | ||||||||
| iso | 0.01 | 0 | 0.01 | 0 | 3 | 0 | 0 | 0 |
| mm | 1.15 | 0.50 | 1.10 | 0.40 | 2.30 | 0.65 | 0.10 | 0.15 |
5 Conclusions
In this paper we obtained an understanding of the morphology of H i disks during a major merger. Observationally, we have already found that the morphological parameters, currently in use to classify galaxies and identify mergers in optical and UV wavelengths can be applied very productively to H i maps. Applying these to the cold gas and H i maps based on N-body simulations, we conclude the following:
- 1.
- 2.
- 3.
-
4.
Disk gas mass, orientation or the treatment of ISM physics do not substantially change the separation in parameter space of merging and isolated disks in these three parameters (Figure 2).
-
3.
Even the edge-on perspective on a merger produces a morphological signature in the H i column density maps (Figure 3), yet this remains the poorest viewing angle, often confusing merging and isolated disks.
-
4
Of the merger criteria from the literature, the one based on the Gini and Asymmetry performs well for the H i perspective, selecting mergers for 0.4 Gyr out of a runtime of 2.5 Gyr.
- 5
-
6
The criteria we found to perform the best on the WHISP sample, , has a visibility time of 1 Gyr. but with some contamination by isolated disks, mostly low gas-mass and edge-on ones.
In the future, more detailed and comprehensive suites of simulated H i disks will become available, which will allow for determinations of merger time scales for both dynamical and morphological signatures in H i observations. Such simulations will become necessary when the large volume surveys on the SKA precursors commence. Notably, the all-sky H i survey, that will result from the WALLABY project with the ASKAP radio telescope and the Northern H i survey with the APERTIF instrument on WSRT combined, will produce hundreds of thousands of H i data cubes, at similar resolutions as WHISP. Automated merger classification of this surveys will be the only feasible way to delineate samples, as well as determine a more accurate merger rate in the local Universe from an H i perspective. Hopefully, this observational effort will be accompanied by an expanded suite of merger simulations to obtain a more accurate mean selection rate and possibly a spread due to difference in ISM, orientation and disk masses. Following the reasoning of Lotz et al. (2010a, b), we will need to determine merger visibility time scales for the gas-rich and unequal mergers for which these upcoming surveys will be especially sensitive.
Another possible future use of H i morphological parameters is to combine them with at other wavelengths, e.g., optical. The different times at which the disk becomes disturbed –earlier in H i, followed by optical– could be used to estimate in what phase any given merger is in.
Acknowledgments
We acknowledge support from the National Research Foundation of South Africa. The work of B.W. Holwerda and W.J.G. de Blok is based upon research supported by the South African Research Chairs Initiative of the Department of Science and Technology and the National Research Foundation. A. Bouchard acknowledges the financial support from the South African Square Kilometer Array Project. J. Weniger is supported by the University of Vienna in the frame of the Inititivkolleg (IK) ’The Cosmic Matter Circuit’ I033-N and would like to thank Christian Theis and Stephan Harfst for fruitful discussions.
References
- Bershady et al. (2000) Bershady M. A., Jangren A., Conselice C. J., 2000, AJ, 119, 2645
- Booth et al. (2009) Booth R. S., de Blok W. J. G., Jonas J. L., Fanaroff B., 2009, ArXiv e-prints/0910.2935
- Bouchard et al. (2009) Bouchard A., Da Costa G. S., Jerjen H., 2009, AJ, 137, 3038
- Carilli & Rawlings (2004) Carilli C. L., Rawlings S., 2004, New Astronomy Review, 48, 979
- Chung et al. (2009) Chung A., van Gorkom J. H., Kenney J. D. P., Crowl H., Vollmer B., 2009, ArXiv e-prints
- Conselice (2003) Conselice C. J., 2003, ApJS, 147, 1
- Conselice (2006) —, 2006, ApJ, 638, 686
- Conselice (2009) —, 2009, MNRAS, 399, L16
- Conselice et al. (2000) Conselice C. J., Bershady M. A., Jangren A., 2000, ApJ, 529, 886
- Cox et al. (2006a) Cox T. J., Dutta S. N., Di Matteo T., Hernquist L., Hopkins P. F., Robertson B., Springel V., 2006a, ApJ, 650, 791
- Cox et al. (2006b) Cox T. J., Jonsson P., Primack J. R., Somerville R. S., 2006b, MNRAS, 373, 1013
- de Blok et al. (2009) de Blok W. J. G., Jonas J., Fanaroff B., Holwerda B. W., Bouchard A., Blyth S., van der Heyden K., Prizkal N., 2009, in Conference Proceedings of the ”Panoramic Radio Astronomy: Wide-field 1-2 GHz research on galaxy evolution”, June 02 - 05, 2009 Groningen, the Netherlands
- Dehnen (2002) Dehnen W., 2002, Journal of Computational Physics, 179, 27
- Harfst et al. (2006) Harfst S., Theis C., Hensler G., 2006, A&A, 449, 509
- Hibbard et al. (2001) Hibbard J. E., van Gorkom J. H., Rupen M. P., Schiminovich D., 2001, in Astronomical Society of the Pacific Conference Series, Vol. 240, Gas and Galaxy Evolution, Hibbard J. E., Rupen M., van Gorkom J. H., eds., pp. 657–+
- Holwerda et al. (2009) Holwerda B. W., de Blok W. J. G., Bouchard A., Blyth S., van der Heyden K., Prizkal N., 2009, in Conference Proceedings of the ”Panoramic Radio Astronomy: Wide-field 1-2 GHz research on galaxy evolution”, June 02 - 05, 2009 Groningen, the Netherlands
- Holwerda et al. (2011a) Holwerda B. W., Pirzkal N., de Blok W. J. G., Blyth S.-L., Bouchard A., van der Heyden K. J., 2011a, MNRAS, 4, submitted
- Holwerda et al. (2011b) Holwerda B. W., Pirzkal N., de Blok W. J. G., Blyth S.-L., Bouchard A., van der Heyden K. J., Elson E. C., 2011b, MNRAS, 1, accepted
- Holwerda et al. (2011c) —, 2011c, MNRAS, 2, accepted
- Holwerda et al. (2011d) —, 2011d, MNRAS, 3, submitted
- Johnston (2007) Johnston S., 2007, in From Planets to Dark Energy: the Modern Radio Universe. October 1-5 2007, The University of Manchester, UK. Published online at SISSA, Proceedings of Science, p.6
- Johnston et al. (2007) Johnston S., Bailes M., Bartel N., Baugh C., Bietenholz M., Blake C., Braun R., Brown J., Chatterjee S., Darling J., Deller A., Dodson R., Edwards P. G., Ekers R., Ellingsen S., Feain I., Gaensler B. M., Haverkorn M., Hobbs G., Hopkins A., Jackson C., James C., Joncas G., Kaspi V., Kilborn V., Koribalski B., Kothes R., Landecker T. L., Lenc E., Lovell J., Macquart J.-P., Manchester R., Matthews D., McClure-Griffiths N. M., Norris R., Pen U.-L., Phillips C., Power C., Protheroe R., Sadler E., Schmidt B., Stairs I., Staveley-Smith L., Stil J., Taylor R., Tingay S., Tzioumis A., Walker M., Wall J., Wolleben M., 2007, Publications of the Astronomical Society of Australia, 24, 174
- Johnston et al. (2009) Johnston S., Feain I. J., Gupta N., 2009, in Astronomical Society of the Pacific Conference Series, Vol. 407, Astronomical Society of the Pacific Conference Series, D. J. Saikia, D. A. Green, Y. Gupta, & T. Venturi, ed., pp. 446–+
- Johnston et al. (2008a) Johnston S., Taylor R., Bailes M., Bartel N., Baugh C., Bietenholz M., Blake C., Braun R., Brown J., Chatterjee S., Darling J., Deller A., Dodson R., Edwards P., Ekers R., Ellingsen S., Feain I., Gaensler B., Haverkorn M., Hobbs G., Hopkins A., Jackson C., James C., Joncas G., Kaspi V., Kilborn V., Koribalski B., Kothes R., Landecker T., Lenc A., Lovell J., Macquart J.-P., Manchester R., Matthews D., McClure-Griffiths N., Norris R., Pen U.-L., Phillips C., Power C., Protheroe R., Sadler E., Schmidt B., Stairs I., Staveley-Smith L., Stil J., Tingay S., Tzioumis A., Walker M., Wall J., Wolleben M., 2008a, Experimental Astronomy, 22, 151
- Johnston et al. (2008b) —, 2008b, Experimental Astronomy, 22, 151
- Jonas (2007) Jonas J., 2007, in From Planets to Dark Energy: the Modern Radio Universe. October 1-5 2007, The University of Manchester, UK. Published online at SISSA, Proceedings of Science, p.7
- Kuijken & Dubinski (1995) Kuijken K., Dubinski J., 1995, MNRAS, 277, 1341
- Le Fèvre et al. (2000) Le Fèvre O., Abraham R., Lilly S. J., Ellis R. S., Brinchmann J., Schade D., Tresse L., Colless M., Crampton D., Glazebrook K., Hammer F., Broadhurst T., 2000, MNRAS, 311, 565
- Lotz et al. (2008) Lotz J. M., Jonsson P., Cox T. J., Primack J. R., 2008, ArXiv e-prints, 805
- Lotz et al. (2010a) —, 2010a, MNRAS, 404, 590
- Lotz et al. (2010b) —, 2010b, MNRAS, 404, 575
- Lotz et al. (2004) Lotz J. M., Primack J., Madau P., 2004, AJ, 128, 163
- Napier (2006) Napier P. J., 2006, in Astronomical Society of the Pacific Conference Series, Vol. 356, Revealing the Molecular Universe: One Antenna is Never Enough, D. C. Backer, J. M. Moran, & J. L. Turner, ed., pp. 65–+
- Oosterloo et al. (2009) Oosterloo T., Verheijen M., van Cappellen W., Bakker L., Heald G., Ivashina M., 2009, ArXiv e-prints
- Patton et al. (1997) Patton D. R., Pritchet C. J., Yee H. K. C., Ellingson E., Carlberg R. G., 1997, ApJ, 475, 29
- Springel & Hernquist (2002) Springel V., Hernquist L., 2002, MNRAS, 333, 649
- Springel et al. (2001) Springel V., Yoshida N., White S. D. M., 2001, New Astronomy, 6, 79
- Theis & Hensler (1993) Theis C., Hensler G., 1993, A&A, 280, 85
- van der Hulst (2002) van der Hulst J. M., 2002, in Astronomical Society of the Pacific Conference Series, Vol. 276, Seeing Through the Dust: The Detection of HI and the Exploration of the ISM in Galaxies, Taylor A. R., Landecker T. L., Willis A. G., eds., pp. 84–+
- van der Hulst et al. (2001) van der Hulst J. M., van Albada T. S., Sancisi R., 2001, in Astronomical Society of the Pacific Conference Series, Vol. 240, Gas and Galaxy Evolution, Hibbard J. E., Rupen M., van Gorkom J. H., eds., pp. 451–+
- Verheijen et al. (2008) Verheijen M. A. W., Oosterloo T. A., van Cappellen W. A., Bakker L., Ivashina M. V., van der Hulst J. M., 2008, in American Institute of Physics Conference Series, Vol. 1035, The Evolution of Galaxies Through the Neutral Hydrogen Window, R. Minchin & E. Momjian, ed., pp. 265–271
- Walter et al. (2008a) Walter F., Brinks E., de Blok W. J. G., Bigiel F., Kennicutt R. C., Thornley M. D., Leroy A., 2008a, AJ, 136, 2563
- Walter et al. (2008b) —, 2008b, AJ, 136, 2563
- Weniger et al. (2009) Weniger J., Theis C., Harfst S., 2009, ArXiv e-prints