Morphologically-Identified Merging Galaxies in the SWIRE Fields
Abstract
We investigate the evolutional and environmental effects on star formation efficiency for more than 400 merging galaxies. The 400 merging systems, with photometric redshifts smaller than 0.7, are obtained from a catalog of 15000 morphologically identified merging galaxies derived from observations of the Canada-France-Hawaii Telescope. We also obtained the IR data of the merging galaxies from the Spitzer Wide-area InfraRed Extragalactic Survey (SWIRE). The redshift differences between the member galaxies of these merging pairs show a large distribution with . We divide our merging pairs into two sub-samples with and for further analyses. We find a statistically significant anti-correlation between the specific star formation rate (SSFR) and the separation of the merging galaxies for both sub-samples. Our analyses also show that although most of the merging systems do have enhanced star formation activity, only very rare ones display extremely high SFRs. Additionally, the SSFR of the merging galaxies also decreases when the magnitude difference between two member galaxies becomes large. However, we find that for the merging pairs with large luminosity contrast, the fainter components show higher SSFR than the brighter ones. Finally, there is a higher fraction of gas-poor mergers in galaxy clusters, and the SSFR of gas-rich mergers is reduced in cluster environments.
1 Introduction
Galaxy interaction and merging play an essential role in galaxy formation and evolution. Numerical simulations showed that merging processes might transform blue late-type galaxies into red early-type galaxies (Tissera et al., 2002). It was also predicted that tidal interactions between galaxy pairs could transform spiral and irregular galaxies into S0 and elliptical galaxies (Toomre & Toomre, 1972; Mihos & Hernquist, 1996; Barnes & Hernquist et al., 1996). Some observations showed that ellipticals formed through the merger of spirals (e.g., the Antennae; Schweizer, 1982; Hibbard & van Gorkom, 1996). Non-axisymmetric gravitational potential arising during the galaxy interactions might produce tidal torques that can induce strong gas inflows, which might trigger an intense burst of star formation. Galaxy mergers are therefore well known to be responsible for triggering enhanced star formation activity (e.g., Kennicutt, 1998; Barton et al., 2000; Lambas et al., 2003).
An interesting issue of merging galaxies is how the triggered star formation activity is related to the internal physical parameters of the galaxy mergers, such as pair separations and mass ratios. It has been reported that star formation rate (SFR) is anti-correlated with the pair projected separation and radial velocity (e.g., Barton et al., 2000; Lambas et al., 2003). Since SFR scales with galaxy mass, it is better to use the specific star formation rate (SSFR), defined as the SFR divided by the stellar mass, to denote star formation activity of galaxy (e.g., Nikolic et al., 2004). Nikolic et al. (2004) discovered that the SSFR also shows an anti-correlation with the projected separation. In addition, the induced star formation activity is also related to the mass ratio of the galaxy pair; the pairs with commensurate luminosities trigger stronger star formation activity than those with large luminosity contrast (Lambas et al., 2003; Woods et al., 2006). In the minor mergers, Lambas et al. (2003) found that brighter members show a higher probability to have tidally enhanced star formation than the fainter ones, but Woods & Geller (2007) reported that the fainter galaxies show higher SSFRs than the brighter ones.
Besides the internal parameters, the triggered star formation activity might also be affected by environments. Alonso et al. (2004) found that the pairs in clusters required a smaller separation than those in the fields to show obvious enhanced star formation activity by studying 2-degree field (2dF) pairs. They also pointed out that the pairs in dense environments showed lower enhanced star formation activity than those in the fields. Nevertheless, it is difficult to determine whether this SFR inhibition is true or mainly results from the effect of the morphology-density relation (Dressler, 1980) since ellipticals, which are dominant in clusters, have much smaller star formation activity than spirals.
Early studies based on UV/optical observations were susceptible to dust extinction (e.g., Barton et al., 2000; Lambas et al., 2003; Nikolic et al., 2004; Alonso et al., 2004; Woods et al., 2006; Woods & Geller, 2007). During the merging process the gas inflows induced by tidal torques of galaxy interaction are converted into new stars with large amounts of dust, which is heated by the young stars and radiates energy at mid-infrared (MIR) to far-infrared (FIR) wavelengths; this indicates that infrared (IR) is an ideal tool to study mergers.
Furthermore, previous studies on the relevant topics were all based on merging galaxies selected using the inter-galaxy separations. Such methods would tend to select interacting galaxies at relatively early stages of the merging processes. To statistically study the influence of the merging process and environments, we need a large un-biased merging galaxy sample based on consistent searching criteria. In this study, we select a sample of morphologically-identified merging galaxies (Hwang & Chang, 2009), which are not prone to specific merging stages, and we combine the infrared and optical data to investigate the properties of these merging galaxies.
This paper is organized as follows. Section 2 introduces our data and data processing. In Section 3, we discuss the photometric redshifts of the galaxy pairs and estimate the star formation rates. In Section 4, we study the distribution of SSFR in the merging galaxies. The relationships of the SSFR with the projected separation and the mass ratio of the galaxy pairs are analyzed in Section 5. In Section 6 we discuss the environmental effects on the SSFR of the mergers. Finally, Section 7 summarizes our main findings. Where needed, we assume a standard CDM cosmology with = 0.3, = 0.7, and = 70 km s-1 Mpc-1 throughout this study.
2 Data and Data Reduction
2.1 Sample of Merging Galaxies
The merging galaxies in this study are obtained from a catalog of interacting and merging galaxies derived from the Red Sequence Cluster Survey 2 (RCS2) of Canada-France-Hawaii Telescope observations (Hwang & Chang, 2009). This catalog is the largest catalog of galaxy-merging systems assembled to date and includes more than 15,000 interacting and merging galaxies via morphological classification. Possible candidates were first selected by an automatic morphological-pattern-recognition package and subsequently inspected by human eyes to assure their credibility in the final catalog. These sources constitute a reliable and uniform sample of merging galaxies for further study. In addition, the RCS2 data used to develop this catalog covers extensive and separate areas up to 422 deg2, providing a great opportunity to conduct multi-waveband researches combined with other large surveys, such as the Spitzer Wide-area Infrared Extragalactic Legacy Survey (SWIRE; Lonsdale et al., 2003, 2004) and the Sloan Digital Sky Survey (SDSS; York et al., 2000).
The SWIRE is the largest extragalactic Spitzer Legacy Science programs, imaging 49 deg2 at the wavelengths of Infrared Array Camera (IRAC) 3.6, 4.5, 5.6, 8 m and Multiband Imaging Photometer (MIPS) 24, 70, 160 m. The SWIRE project has mapped seven high-latitude fields; the RCS2 regions are overlapped with 3 of these 7 fields—ELAIS N1, ELAIS N2, and Lockman Hole. These 3 SWIRE fields are listed in Table 1. We note that these fields have also been specifically selected to be far away from the ecliptic to avoid possible contaminations from wandering asteroids as well. Within these 3 fields there are 540 merging systems identified in the catalog of Hwang & Chang (2009).
2.2 Optical Data from SDSS
In order to have accurate photometric information for these morphologically identified merging galaxies, we also obtain the optical data from the SDSS survey. The SDSS is a combined imaging and spectroscopic survey of 104 deg2 in the north Galactic cap and a smaller region in the south. The SDSS imaging gathers data in five broad bands, , ranging from 3000 to 10,000 Å. We use the imaging data in the seventh SDSS data release (DR7) in this study.
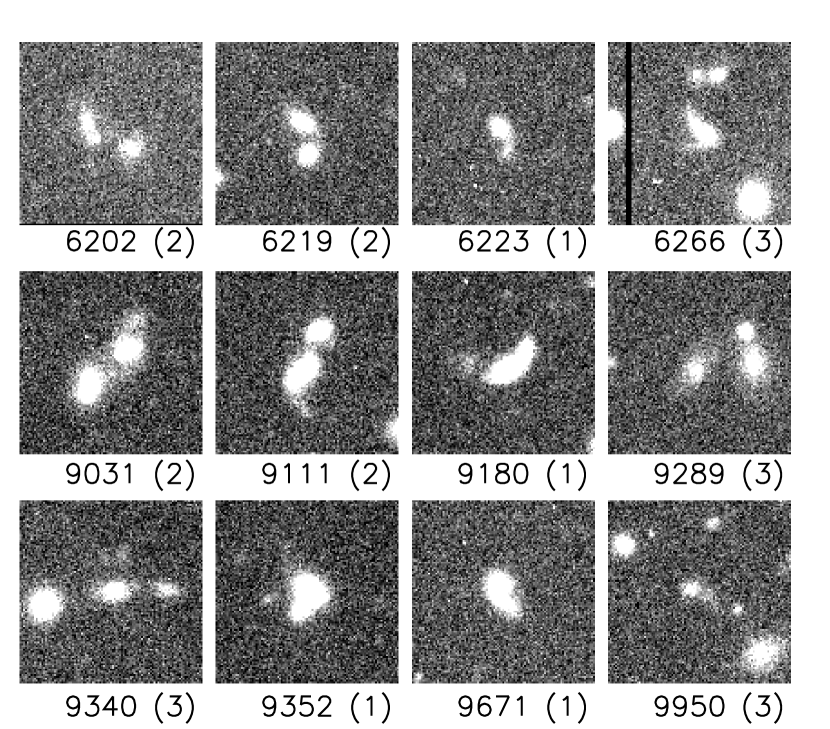
We first retrieve a list of galaxies within an angular distance of 10 from the 540 merging systems. We visually examine each image of the 540 merging systems to identify their SDSS counterparts. It turns out that a small part of the merging systems are identified as foreground stars by SDSS. We find 60 merging systems composed of at least one component identified as stars by SDSS; we reject these sources from our sample. We then classify the remaining 480 merging systems, totaling to 723 galaxies, into 3 groups according to the number of their members: merger (MG; 1), close pair (CP; 2), and close multiple (CM; more than three). The final sample consists of 253 MGs, 213 CPs, and 14 CMs. In the following analyses, we only focus on the MGs and CPs to study the relations between the SSFR and some physical parameters, such as pair separation, pair magnitude difference, and the environments. The CMs are ignored in these analyses because they are complicated and too difficult to quantify the effects of the physical parameters. Some examples of these merging systems are shown in Figure 1.
The SDSS database contains various measured magnitudes for each detected source; we select model magnitudes for our targets. We also acquire the photometric redshifts for our galaxies because of their lack of spectroscopic observations. Notwithstanding the accuracy of the photometric redshifts is not as good as that of spectroscopic redshifts, the former still provides sufficient information for extragalactic and cosmological researches, especially in the statistical study of the evolutionary properties for faint objects.
2.3 IR Data from SWIRE
We search the IR counterparts of the merging galaxies in the SWIRE fields to study their properties of star formation activity. We mainly utilize the SWIRE data at 3.6 and 24 m. The 3.6 m luminosity can be used as a tracer of the stellar component since the NIR emission is dominated by older stellar populations and less susceptible to recently formed massive stars (e.g., Wu et al., 2005; Davoodi et al., 2006; Li et al., 2007; Hancock et al., 2007; Rowan-Robinson et al., 2008). On the other hand, the MIR emission can be used to estimate the total IR luminosity for a variety of galaxies (Chary & Elbaz, 2001; Elbaz et al., 2002; Papovich & Bell, 2002; Takeuchi et al., 2005). We use the 24 m flux to derive the total IR luminosities and thus the SFRs of the merging galaxies.
2.3.1 IR Counterparts from SWIRE Catalogs
We obtain the IR data for bright sources from the SWIRE catalogs. We first check the SWIRE flag—extended source flag—for each source in SWIRE catalogs to exclude “definitely point-like” objects. The processed SWIRE catalogs are subsequently cross-correlated with our 723 merging galaxies; the IR counterparts are determined by identifying the closest SWIRE sources within an angular distance of 5 from each merging galaxy. We find 482 and 152 galaxies with IR counterparts at 3.6 and 24 m respectively. The SWIRE catalogs provide several kinds of flux measurements; for our objects, we select the Kron flux (Kron, 1980), which is especially preferable for extended sources.
2.3.2 IR Counterparts from SWIRE Images
The SWIRE catalogs only contain sources with sufficient fluxes. For example, the threshold for the detection at 3.6 m required SNR , which is equivalent to 10 Jy for almost all of the survey area. To retrieve faint sources which were not included in the SWIRE catalogs, we extract the fluxes within apertures of 1.9 (1.6 FWHM) and 5.25 (1.9 FWHM) centered at the position of each merging galaxy in the IRAC-3.6 m and MIPS-24 m images separately. These images are downloaded from the NASA/IPAC Infrared Science Archive and have been post-processed and co-added. They are the same ones used to make the SWIRE catalogs. We obtain the IR fluxes of the merging galaxies if the corresponding extracted objects have an SNR greater than 3 sigma. Combining the faint sources and the objects from the SWIRE catalogs, we find 600 and 621 out of 723 merging galaxies with IR counterparts at 3.6 and at 24 m respectively. There are fewer galaxies with IR counterparts at 3.6 than at 24 m because some of the galaxies are out of the IRAC imaging fields.
Since we can not detect very faint sources at high redshifts, we might have some biases in selecting the merging pairs. For examples, if we divide our sample into major merging pairs with and minor merging pairs with , we might tend to detect the minor mergers at relatively low redshifts becasue we can have more detectable low-luminosity sources at lower redshifts. Nevertheless, the redshift distributions of the major and minor mergers are not distinct; the mean redshift for the major mergers is and that for the minor mergers is . This indicates that this flux-limited bias is negligible.
3 Sample Characteristics
3.1 Photometric Redshifts of Close Pairs
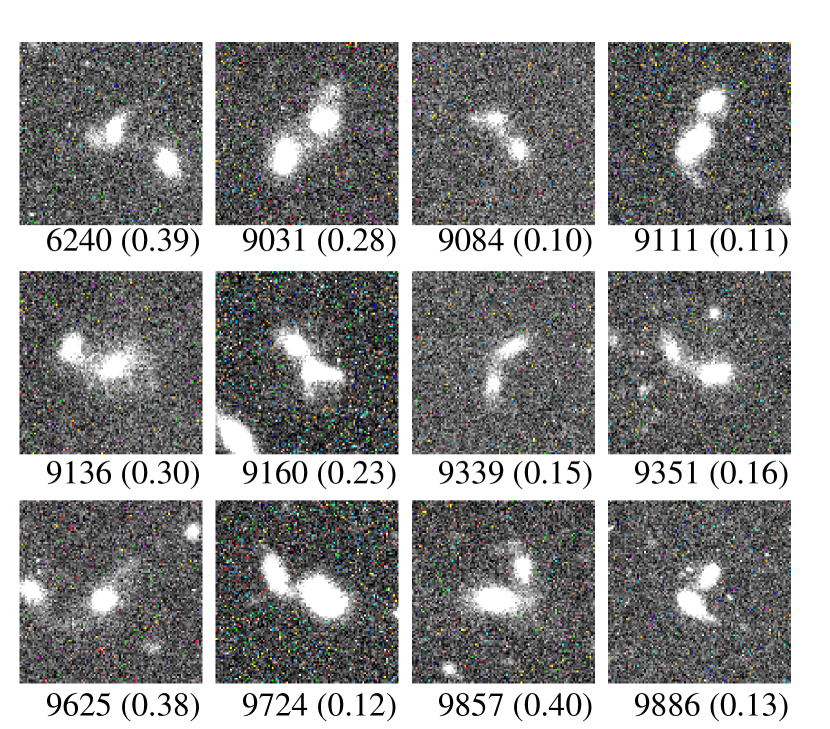
The redshift distribution of our sample is shown in Figure 2. The farthest merging galaxies could reach out to redshifts as far as ; the observed 24 m flux for this largest redshift corresponds to the rest-frame 14.1 m flux, still within the MIR range. Figure 3 shows the distribution of the redshift difference, , between two member galaxies for each CP. At first glance, this wide distribution might imply that our sample is contaminated by spurious galaxy pairs; i.e., some pair galaxies might not be really close in physical space. However, we note that our sample is selected through morphological identification; most CPs exhibit clear features of merging galaxies, such as “tail” and “bridge”. Some examples of the CPs with are shown in Figure 4. As can be seen, these CPs do show the features of merging galaxies in spite of their large redshift difference. We thus conclude that the redshift differences for most of these CPs are not caused by projection.
The discrepancy of photometric redshifts in some of the CPs is not surprising. Enhanced star formation in the interacting galaxies may affect their color caused by strong line emission and dust absorption in the star forming region. This would influence their photometric redshift estimates derived by fitting observational data with synthetic templates. We have considered different criteria in obtaining a better redshift estimate between two interacting galaxies, such as selecting the photometric redshift from the brighter galaxy or selecting the smaller redshift. We find that our derived results are all statistically consistent in spite of the selecting criteria used; one of the main reasons is that the redshift effects are substantially canceled out when we consider the SSFRs derived from the ratios of luminosities (fluxes) of different wavebands. For simplicity, we assume the smaller photometric redshift between two member galaxies as the true redshift for those CPs with in presenting our results.
3.2 Estimating Total IR Luminosity and Stellar Mass
Emission of MIR is an ideal tracer of the total IR luminosity. Previous studies have developed libraries of luminosity- or color-dependent galaxy templates to calculate the total IR luminosity from 24 m flux densities (Dale et al., 2001; Chary & Elbaz, 2001; Dale & Helou, 2002; Lagache et al., 2003). We derive the total IR luminosities from the 24 m flux densities adopting the templates from Chary & Elbaz (2001); these templates consist of a combination of 105 spectral energy distributions (SEDs) from normal to starburst galaxies.
We employ the SDSS -band ( = 9097 Å) luminosity as the stellar mass indicator. The 3.6 m flux density was usually used as an estimate for the stellar mass (e.g., Wu et al., 2005; Davoodi et al., 2006; Li et al., 2007; Hancock et al., 2007; Rowan-Robinson et al., 2008). As found by Charlot (1996) and Madau et al. (1998), the mass-to-NIR ratio, independent of either galaxy color or Hubble type, is less susceptible to the star formation history and the same for all types of galaxies. Nonetheless, there are 123 sources in our sample without information at 3.6 m due to detection limit or to the lack of IRAC observations. On the other hand, it has also been reported that -band luminosity can be used as an un-biased estimate of the stellar mass (Nikolic et al., 2004). To check the credibility of using the SDSS -band as the stellar mass indicator in our sample, we plot the 3.6 m versus the SDSS -band luminosity for the 600 sources with both 3.6 m and -band detections in Figure 5. The 3.6 m and the SDSS -band luminosities are calibrated to the rest frame using the templates from Chary & Elbaz (2001). As can be seen, the 3.6 m luminosity is proportional to the SDSS -band luminosity. The -band luminosity provides a reliable estimate of stellar mass. We have hence obtained an estimate of the stellar mass based on the SDSS -band luminosity for every galaxy in our sample.
Throughout this study, we use to represent the SSFR. The SFR scales with the galaxy mass and might fail to reflect the star formation efficiency; in contrast, the SSFR, which has taken into account the effect of stellar mass, is a more suitable estimate of star formation activity in galaxies. The ratio has been employed to represent the SSFR in previous studies (e.g., Lin et al., 2007). They used rest-frame (B-V) colors and absolute -band magnitude to derive stellar mass. We note that the -band magnitude is susceptible to dust extinction and requires careful calibration as done by Lin et al. (2007). In this paper, we use rest-frame SDSS -band luminosity to represent the stellar mass because the SDSS -band luminosity is proportional to the rest-frame IRAC 3.6 luminosity (Figure 5), which is less susceptible to star formation history and dust extinction and is a better mass tracer. For each CP, we use to represent the total SSFR by summing the total IR luminosity of both galaxies over the total -band luminosity of both members. We note that the distance influence on the SSFR is small because the division of by will have eliminated most of the distance effects. Thus, the uncertainties in the photometric redshift estimates are not as vital as might have been expected.
4 SSFR Distribution of Galaxy Pairs
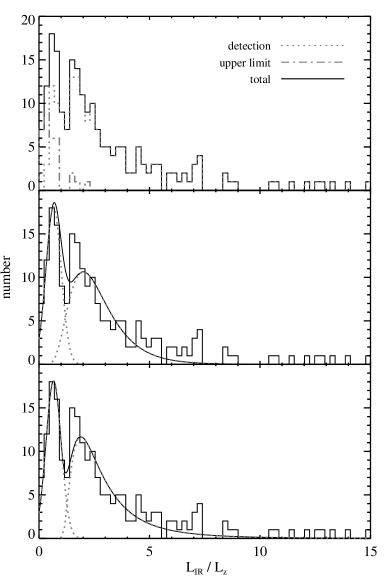
We first explore characteristic features of the SSFR distribution of the CPs. Upper panel of Figure 6 shows the SSFR distribution of 213 CPs. This distribution shows a significant dip at , which looks like a boundary of two different distributions. To understand the origin of this boundary, we adopt the SED templates from Polletta et al. (2007) to generate the values for various types of galaxies. Table 2 summarizes the values of for a variety of galaxies ranging from ellipticals to ultra-luminous infrared galaxies (ULIRGs). As can be seen in Table 2, while the galaxies with below unity are normal ones, the galaxies with larger than unity all exhibit enhanced star formation activity. This indicates that the bimodal distribution of Figure 6 actually symbolizes the galaxies with and without enhanced star formation activity. Some galaxies of the CPs are influenced by tidal interactions and manifest enhanced star formation activity whereas others still remain unaffected.
We try to find suitable distribution functions to describe the SSFR distribution. First, the CPs on the left side looks like a normal distribution, which seems to be reasonable for normal galaxies. The probability density function (p.d.f.) of a normal distribution is
| (1) |
where and are the mean and standard deviation of the variable . On the other hand, we might expect the distribution of galaxies with enhanced star formation activities to be lognormal; that is, only very few sources have extremely star formation activities. The right hand side of the SSFR distribution shows a concentration of the values at 1.5–2 and a long tail toward the upper end, also corresponding with the characteristics of a lognormal distribution. The p.d.f. of a lognormal distribution is
| (2) |
where and are the mean and standard deviation of the variable’s natural logarithm. The lognormal distribution is closely related to normal distribution. If is distributed lognormally with parameters and , is distributed normally with the mean and standard deviation . We adopt a normal function to fit the left part and a lognormal distribution function to fit the right part of the SSFR distribution. Table 3 lists the derived parameters, and the results are plotted in the middle panel of Figure 6.
The lognormal fits are somehow unsatisfactory. This is due to the fact that at the low end there are always galaxies with “normal” star formation efficiency, and on the high end, there are more galaxies than model predicted. In order to correct these shortcomings, we construct a modified lognormal p.d.f. :
| (3) |
We note that such modification is purely from mathematical reasoning. The derived parameters are also listed in Table 3, and the fitting results are plotted in Figure 6 (lower panel). The data are better fitted with a mixture of the normal and the modified lognormal distribution functions. We note that the modified lognormal distribution is still very close to the standard lognormal distribution. We conclude that the SSFRs of the CPs that remain unaffected by tidal interactions are normally distributed, but the SSFRs of those with enhanced star formation will approximately follow a lognormal distribution.
5 Dependence of SSFR on Physical Parameters
5.1 Projected Separation
We explore effects of the projected separation of the merging galaxies on the SSFR. We ignore the CPs without 24 m detection; the total remained CPs in this analysis is 181. Figure 7 shows the dependence of on the projected separation; the circle and plus signs represent the CPs with and respectively, and the triangle represents the MGs. In Figure 7, the shows a generally declining envelop as a function of . To test the statistical significance of this relation, we compute their correlation coefficients and probabilities. The linear correlation coefficient for the overall sample is , with the probability of the correlation , indicating and are significantly anti-correlated. The sample with shows a correlation of with , and the sample with shows a correlation of with . To reduce the effect of outliers in the correlation test, we also apply the Spearman rank method, which is more robust than the linear correlation. A Spearman rank correlation test also confirms the anti-correlation between the SSFR and the projected separation; we obtain and for the overall sample, and for the sample with , and and for the sample with . All these tests show that the anti-correlation between the SSFR and the observed projected separation of merging galaxies is statistically significant.
Our results qualitatively agree with previous studies. It was reported that SSFR is anti-correlated with pair projected separation for the merging galaxies of local universe (Nikolic et al., 2004). Lin et al. (2007) also found a declining envelop of as a function of projected separation for pairs at higher redshift (z 0.1–1.1); however, no statistical analysis was provided and is difficult to evaluate and to compare with their results quantitatively.
In our sample, the CPs with similar projected separations spread a wide range of the values. We note that CPs with similar projected separations might in fact have very diverse real separations; this could cause large scattering in the values. CPs with similar physical separations but undergoing different merging stages would also contribute to the scatter of SSFR because some CPs may just start to approach, while others might have experienced merging processes more than once and had drained most of the gas in the early processes. Likewise, the same fact might explain why the values of MGs also scatter over a wide range. It was also noted that the SSFR is related to the galaxy types or intrinsic properties of the merging galaxies (Lambas et al., 2003; Nikolic et al., 2004) and the luminosity contrast (or mass contrast) between member galaxies. Given all these uncertainties, our results still show a significant anti-correlation between the SSFR and the observed projected separation of merging pairs; this demonstrates that the internal separations between merging galaxies must have strong influence on the SSFRs.
5.2 Mass Ratio
We investigate the dependence of the SSFR on the mass ratio of our CPs. We use the -band magnitude difference between the pair galaxies, , to represent their mass ratio. We divide our sample into major merging pairs with and minor merging pairs with . The number of the major merging pairs is 134, including 38 CPs with 0.05 and 96 CPs with ; the 47 minor merging pairs contain 11 with and 36 with . The distribution of the -band magnitude differences for the CPs is shown in Figure 8.
We first examine the relation between and to test the influence of the luminosity contrast for the major and minor merging pairs. Figure 9 shows versus of these two types of merging pairs. We find a significant anti-correlation between the and for the major merging pairs with and using the Spearman rank test. We further divide the major merging pairs into two subgroups with and separately. The statistical significance of the anti-correlations of these two subgroup are and for the major merging pairs with and and for the ones with respectively. In other words, the correlation between and becomes weaker for the major merging pairs with ; this might be caused by the errors of the true distance determination for some sources in this sample.
In contrast, the minor merging pairs display no correlations between and . The Spearman test show and for the minor merging pairs. There are no anti-correlations for both subgroups with and either. This is consistent with the results of Woods et al. (2006) and implies that the intrinsic properties of the minor merging galaxies might be dominant factors in determining the SSFR of the minor merging galaxies.
We next study the relation between the SSFR and the magnitude difference in these merging galaxies pairs. Figure 10 shows the relation between and for our sources. The results of the Spearman rank test exhibit a clear anti-correlation between the and with and for the overall sample; the correlations are slightly weaker with and for the pairs of 0.05 and and for the pairs of . This anti-correlation between the and is also consistent with the result of Woods et al. (2006).
We also compare the SSFRs of the faint galaxies and the bright galaxies in the minor merging pairs. To estimate the stellar mass of galaxies, we apply the relation between the -band and 3.6 luminosities of our sample as shown in Figure 5,
| (4) |
and the relation found by Li et al. (2007),
| (5) |
We note that equation (4) also holds in different redshift ranges, indicating that its redshift dependence is small.
Dwarf galaxies are excluded in calculating the SSFRs since the dwarves might have depleted their gas and their SSFRs are not affected by tidal interaction anymore. We exclude dwarf galaxies with , which corresponds to galaxies about one order magnitude fainter than the characteristic luminosity of field galaxies (Blanton et al., 2005).
We calculate the individual SSFRs of the faint galaxies and the bright galaxies in the minor merging pairs. As shown in Figure 11, all the faint galaxies have higher SSFRs than the bright galaxies. Their average SSFRs are listed in Table 4; the average SSFRs of the major merging galaxies are also listed as a comparison. Although the major merging pairs have higher SSFRs than the minor pairs, the average SSFR of the faint galaxies in the minor merging pairs is much higher than that of the major merging pairs. This is due to the fact that the SSFRs of the bright galaxies in minor merging pairs are much lower than those of the major merging pairs; the very low SSFRs and the high mass of the bright galaxies compensate the high SSFRs of the faint galaxies in the minor merging pairs. As a result, the major merging pairs have higher SSFRs than the minor ones on average. Our results indicate that the SSFR of faint galaxies are more susceptible to the effects of tidal interaction.
This result is in agreement with that of Woods & Geller (2007) but are inconsistent with that of Lambas et al. (2003). Lambas et al. (2003) found that in the minor merging pairs, the effects on star formation activities are more important in the brighter galaxies. We note that their faint galaxy sample including sources down to , which might contain many dwarf galaxies. These dwarf galaxies might have depleted most of their gas and could not trigger any new star formation even with very strong tidal interaction. This shows that the intrinsic properties of galaxies have to be taken into account when we consider the effect of tidal interaction in a merging pair.
5.3 Estimation of Superposition
The redshift differences between the member galaxies of our merging pairs show a large distribution with . It is difficult to directly quantify the contamination because our sources have been specifically selected via morphological pattern recognition. This selection criterion has largely removed superposed false pairs. Nonetheless, we might evaluate the effects of overlapping pairs on our results from some correlation tests. We note that the internal separations between merging galaxies have a strong correlation with the SSFRs (e.g., Nikolic et al., 2004), so the correlation results could reflect the reliability of our sample. We divide the pairs with into three subgroups according to their redshift differences and calculate the Spearman rank correlation test on the SSFR and the separation for each subgroup, as listed in Table 5.
We find that there are no correlations between and for CPs with but a significant one for CPs with ( and ). In Figure 3, we find a small bump around and the distribution becomes flat for . From the correlation tests, we speculate that the bump around to 0.2 might be caused by superposition, whereas most of the sources with are actually true pairs with wrong redshift determination. This unusual result is caused by the fact that there are only a few high-redshift sources and thus the probability of superposition involving one member at high redshifts is low. It turns out that there are very few overlapping pairs with true large . From the bump of Figure 3, we estimate that there are about fifty contaminating sources by comparing the distribution of large sources.
6 ENVIRONMENTAL EFFECTS ON SSFR
6.1 Environmental Distribution of Wet/Dry/Mixed Merging Pairs
Environments also have strong influence on the merging galaxies. To study the environmental effects on galaxy evolution, we compare the distribution of merging galaxy types in the fields with that in the clusters. The cluster regions for comparison are selected from the maxBCG cluster catalog (Koester et al., 2007), which covers similar regions of our sample galaxies and is the largest sample of observed galaxy clusters available by far. The criteria of assigning a CP in a cluster are (1) the redshift difference between the CP and its host cluster is smaller than 0.05, and (2) the projected separation between the CP and the center of the cluster is smaller than 1000 kpc.
We classify the types of galaxies according to their SSFRs. A galaxy is classified as a red (or dry) galaxy if and a blue (or wet) one if . Since some galaxies have no 24 m detection with 3 upper limit, the galaxies with the upper limit lower than 0.5 are also classified as red galaxies. There are about 16 sources, which have the upper limits larger than 0.5 and are difficult to classify. We could either assign these uncertain sources as blue galaxies or red galaxies. In the former case, we would have the upper limit for the total number of the blue galaxies and in the latter case the upper limit for the red ones. The results from the former and latter classifications are represented as class 1 and class 2 in Table 7 separately.
As can be seen in Table 7, the dry-to-wet ratio in the cluster is higher than that in the field. The dry-to-wet ratio of class 1 serves as a lower limit of the ratio because those galaxies with the upper limit higher than 0.5 might actually be red galaxies. On the other hand, the dry-to-wet ratio in class 2 is the upper limit one as we classify all galaxies with the upper limit into red galaxies. Hence, the dry-to-wet ratio in the clusters is around 0.25–0.75 and the ratio in the field is around 0.03–0.09. In addition, only about 3% of all the wet merging galaxies are located in clusters, but about 24–29% of dry merging pairs and 18–21% of mixed merging pairs are in clusters. Dry mergers show a higher tendency to populate the clusters than other types of mergers; this tendency might be related to the morphology-density relation in which early-type galaxies preferentially populate high density environments while late-type galaxies are likely to inhabit low density environments (Dressler, 1980).
6.2 Inhibition of Star Formation Activity in the Cluster
The influence of cluster environment on the SSFRs of galaxies is obvious for our merger sources (MGs). These interacting sources have merged together and the individual galaxies can not be identified. We find that the average SSFR of the MGs in the fields (156 sources) is , and the average SSFR of those in the clusters (9 sources) is . We note that, however, we could not exclude the effects of the morphology-density relation (Dressler, 1980) on the different SSFRs of these MGs since we do not know the galaxy types of the progenitors of these mergers.
In order not to confuse the environmental effects with intrinsic pair properties, we further select only the wet major merging pairs both in the clusters and in the fields to explore whether their SSFRs are different. We use as the dividing point to separate the wet galaxies from the dry ones. The result is shown in Table 8.
We find that the SSFRs of the galaxy pairs are reduced in the clusters. The average SSFR of the wet major merging galaxies in the clusters is 2.28 and that in the fields is 4.36. We note that the average separation of the pairs in the clusters is 13.29 kpc, similar to that of pairs in the field, 13.14 kpc; this suggests that the separation effect is not important. Besides, since we consider only wet major merging galaxies, the different SSFRs can not be associated with the morphology-density relation as in Alonso et al. (2004).
Furthermore, we find an anti-correlation between the SSFR and among the MGs in the fields (Figure 12). The Spearman rank test shows a highly significant result with and , indicating that in the fields the enhanced star formation activity of the more massive MGs is weaker than that of the less massive ones. Nonetheless, there is no correlation for the MGs in the clusters with . This implies that the star formation activity and/or merging history are very different for the MGs in the fields and those in the clusters.
Our results demonstrate that the environments of clusters do inhibit the star formation activity among galaxy pairs. This inhibition might be due to (1) ram pressure stripping of cold interstellar medium of galaxies falling into the cluster through the intracluster medium (e.g., Gunn & Gott, 1972; Nulsen et al., 1982; Fujita et al., 1999; Abadi et al., 1999); and/or (2) strangulation, which means that the diffuse gas in galaxy halos is stripped by the gravitational potential of the cluster, cutting off the supply of cold gas (e.g., Larson et al., 1980; Bekki et al., 2002). On the other hand, for the MGs in the fields, the mass of the MGs is anti-correlated with the SSFR. This might be due to the fact that the more massive MGs have undergone more merging processes than the less massive ones and have exhausted more gas and dust in the early precesses.
7 CONCLUSION
We assemble a sample of more than 400 merging systems to study their features of star formation efficiency. Our sample is drawn from a catalog of 15000 morphologically identified merging galaxies. We identify their IR counterparts in the SWIRE data and their optical counterparts in the SDSS database. Statistical analyses are performed to explore the SSFR distribution, the relations between the SSFR and the pair separation and magnitude difference, and the environmental effects on the SSFR. We summarize our main results in the following:
1. The SSFR distribution of the merging galaxies follows a bimodal distribution. The SSFRs of the galaxy pairs that remain unaffected by tidal interactions have a normal distribution; on the other hand, the SSFRs of the pairs with enhanced star formation activity approximately follow a lognormal distribution. In other words, although most merging systems do show enhanced star formation activity, merging systems with extremely high star formation rates are rare.
2. There is an anti-correlation between the SSFR and the projected separation of the merging galaxies. The SSFR of the pairs also declines when the magnitude difference between two member galaxies increases. The pairs with comparable luminosities produce stronger star formation activity in total than those with large luminosity contrast; however, in a minor merging pair, the fainter component show significantly higher SSFR than the brighter one.
3. We find a higher ratio of dry to wet mergers in galaxy clusters than that in the field. Dry mergers show a higher tendency to populate the clusters than other types of mergers. In addition, the SSFRs of wet major mergers are also inhibited in the clusters.
References
- Abadi et al. (1999) Abadi, M. G., Moore, B., & Bower, R. G. 1999, MNRAS, 308, 947
- Alonso et al. (2004) Alonso M. S., et al. 2004, MNRAS, 352, 1081
- Barnes & Hernquist et al. (1996) Barnes, J., & Hernquist, L., et al. 1996, ApJ, 471, 115
- Barton et al. (2000) Barton, E. J., et al. 2000, ApJ, 530, 660
- Bekki et al. (2002) Bekki, K., Couch, W. J., & Shioya, Y. 2002, ApJ, 577, 651
- Blanton et al. (2005) Blanton, M. R., et al. 2005, ApJ, 631, 208
- Charlot (1996) Charlot, S. 1996, in The Universe at Hight-z, Large-Scale Structure and the Cosmic Microwave Background, ed. E. Martinez-Gonzalez & J. L. Sanz (Berlin: Springer), 53
- Chary & Elbaz (2001) Chary, R., & Elbaz, D. 2001, ApJ, 556, 562
- Davoodi et al. (2006) Davoodi, P., et al. 2006, MNRAS, 371, 1113
- Dale et al. (2001) Dale, D. A., et al. 2001, ApJ, 549, 215
- Dale & Helou (2002) Dale, D. A., & Helou, G. 2002, ApJ, 576, 159
- de Ravel et al. (2009) de Ravel, L., et al. 2009, A&A, 498, 379
- Dressler (1980) Dressler, A. 1980, ApJ, 236, 351
- Elbaz et al. (2002) Elbaz, D., et al. 2002, A&A, 384, 848
- Fujita et al. (1999) Fujita, Y., & Nagashima, M. 1999, ApJ, 516, 619
- Gunn & Gott (1972) Gunn, J. E., & Gott, J. R. I. 1972, ApJ, 176, 1
- Hancock et al. (2007) Hancock, M., et al. 2007, AJ, 133, 676
- Hibbard & van Gorkom (1996) Hibbard, J. E., & van Gorkom, J. H. 1996, AJ, 111, 655
- Hwang & Chang (2009) Hwang, C. Y., & Chang, M. Y. 2009, ApJS, 181, 233
- Kennicutt (1998) Kennicutt, R. C., Jr. 1998, ApJ, 498, 541
- Koester et al. (2007) Koester, B. P., et al. 2007, ApJ, 660, 239
- Kron (1980) Kron, R. G. 1980, ApJS, 43, 305
- Lagache et al. (2003) Lagache, G., Dole, H., & Puget, J.-L. 2003, MNRAS, 338, 555
- Lambas et al. (2003) Lambas, D. G., et al. 2003, MNRAS, 346, 1189
- Larson et al. (1980) Larson, R. B., Tinsley, B. M., & Caldwell, C. N. 1980, ApJ, 237, 692
- Li et al. (2007) Li, H.-N., Wu, H., Cao, C., & Zhu, Y.-N. 2007, AJ, 134, 1315
- Lin et al. (2007) Lin, L., et al. 2007, ApJ, 660, L51
- Lin et al. (2008) Lin, L., et al. 2008, ApJ, 681, 232
- Lonsdale et al. (2003) Lonsdale, C. J., et al. 2003, PASP, 115, 897
- Lonsdale et al. (2004) Lonsdale, C. J., et al. 2004, ApJS, 154, 54
- Madau et al. (1998) Madau, P., Pozzetti, L., & Dickinson, M. 1998, ApJ, 498, 106
- Mihos & Hernquist (1996) Mihos, J. C., & Hernquist, L. 1996, ApJ, 464, 641
- Nikolic et al. (2004) Nikolic, B., Cullen, H., & Alexander, P. 2004, MNRAS, 355, 874
- Nulsen et al. (1982) Nulsen, P. E. J. 1982, MNRAS, 198, 1007
- Papovich & Bell (2002) Papovich, C., & Bell, E. F. 2002, ApJ, 579, L1
- Polletta et al. (2007) Polletta, M., et al. 2007, ApJ, 663, 81
- Rowan-Robinson et al. (2008) Rowan-Robinson, M., et al. 2008, MNRAS, 386, 697
- Schweizer (1982) Schweizer, F. 1982, ApJ, 252, 455
- Takeuchi et al. (2005) Takeuchi, T. T., et al. 2005, A&A, 432, 423
- Tissera et al. (2002) Tissera, P. B., et al. 2002, MNRAS, 333, 327
- Toomre & Toomre (1972) Toomre, A. & Toomre, J. 1972, ApJ, 178, 623
- Woods et al. (2006) Woods, D. F., et al. 2006, AJ, 132, 197
- Woods & Geller (2007) Woods, D. F. & Geller, M. J. 2007, AJ, 134, 527
- Wu et al. (2005) Wu, H., et al. 2005, ApJ, 632, L79
- York et al. (2000) York, D. G., et al. 2000, AJ, 120, 1579
| Field | Center Coordinate (J2000) | Area (deg2) | |
|---|---|---|---|
| R.A. | Decl. | ||
| ELAIS N1 | 9.00 | ||
| ELAIS N2 | 4.45 | ||
| Lockman Hole | 14.32 | ||
| Galaxy type | |
|---|---|
| E | 0.11-0.13 |
| S0 | 0.17 |
| Sa | 0.25 |
| Sb | 0.42 |
| Sc | 0.56 |
| Sd | 1.03 |
| Sdm | 1.08 |
| NGC6090 (SB) | 17.25 |
| M82 (SB) | 20.62 |
| Arp220 (ULIRG) | 29.57 |
| p.d.f. | ||
|---|---|---|
| normal | 0.65 | 0.34 |
| lognormal | 0.70 | 0.43 |
| normal | 0.65 | 0.34 |
| modified lognormal | 1.14 |
Note. — Here and are the fitting parameters for the SSFR distribution of galaxy pairs in the forms of the normal and lognormal distribution functions. For the normal function, and are the mean and standard deviation of the SSFR. For the lognormal function, and are the mean and standard deviation of the natural logarithm of the SSFR.
| CP | member | mean SSFR |
|---|---|---|
| minor-faint | 11.7 2.1 | |
| minor-bright | 2.0 0.1 | |
| major | 4.4 0.1 | |
| minor-faint | 11.4 0.8 | |
| minor-bright | 1.9 0.1 | |
| major | 3.8 0.1 |
| CP | N | ||
|---|---|---|---|
| -0.33 | 0.98 | 49 | |
| -0.17 | 0.95 | 132 | |
| -0.14 | 0.50 | 24 | |
| -0.04 | 0.22 | 57 | |
| -0.24 | 0.98 | 51 |
Note. — The parameters and are the correlation coefficient and the probability of the correlation for Spearman rank correlation test. The parameter N represents the number of CPs inside each bin of .
| Environment | Wet merger | Dry merger | Mix merger | Dry-to-wet ratio | |
|---|---|---|---|---|---|
| cluster | 4 | 1 | 5 | 0.25 | |
| class 1 | field | 143 | 4 | 21 | 0.03 |
| fraction in cluster | 0.030.01 | 0.290.16 | 0.210.08 | ||
| cluster | 4 | 3 | 3 | 0.75 | |
| class 2 | field | 139 | 12 | 17 | 0.09 |
| fraction in cluster | 0.030.02 | 0.240.10 | 0.180.08 |
Note. — In class 1, the galaxies with the upper limit lower and higher than 0.5 are classified into red galaxies and blue galaxies respectively. In class 2, all galaxies without 24 m detection are classified into red galaxies.
| number | mean SSFR | mean separation (kpc) | |
|---|---|---|---|
| cluster | 4 | 2.280.42 | 13.290.74 |
| field | 109 | 4.360.04 | 13.140.07 |