Internal Motions in Starless Dense Cores
Abstract
This paper discusses the statistics of internal motions in starless dense cores and the relation of these motions to core density and evolution. Four spectral lines from three molecular species are analyzed from single-pointing and mapped observations of several tens of starless cores. Blue asymmetric profiles are dominant, indicating that inward motions are prevalent in sufficiently dense starless cores. These blue profiles are found to be more abundant, and their asymmetry is bluer, at core positions with stronger line emission or higher column density. Thirty three starless cores are classified into four types according to the blueshift and red shift of the lines in their molecular line maps. Among these cores, contracting motions dominate: 19 are classified as contracting, 3 as oscillating, 3 as expanding, and 8 as static. Contracting cores have inward motions all over the core with predominance of those motions near the region of peak density. Cores with the bluest asymmetry tend to have greater column density than other cores and all five cores with peak column density are found to be contracting. This suggests that starless cores are likely to have contracting motions if they are sufficiently condensed. Our classification of the starless cores may indicate a sequence of core evolution in the sense that column density increases from static to contracting cores: the static cores in the earliest stage, the expanding and/or the oscillating cores in the next, and the contracting cores in the latest stage.
1 Introduction
“Starless” dense () cores are the cores which have no embedded protostars or no associated T-Tauri stars (Lee & Myers 1999). Such cores have no internal outflows and are well separated from external triggering effects such as outflows and winds from other stars, or supernova explosions. Therefore they are the best laboratory to explore initial conditions of isolated star formation (e.g., Ward-Thompson 2002). Internal motions in starless cores can indicate contraction, a sign of physical progress toward star formation. Ambipolar diffusion or dissipation of turbulence may drive such motions (e.g.,Ciolek & Mouschovias 1995; Nakano 1998; Myers & Lazarian 1998). However, it is not conclusive yet which mechanisms bring the collapse of the cores to eventually form a protostar in the cores.
The presence of contracting or expanding motions along the line of sight has been inferred from spectroscopic observations of optically thick and thin molecular lines. The “spectral infall asymmetry” is a combination of a pair of spectral line shapes. A double-peaked shape with a blue peak brighter than a red peak occurs in a thick line, while a single Gaussian-like shape occurs in a thin line. This combination is often used to trace “inward” motions of gaseous material in starless cores (Leung & Brown 1977; Zhou 1995; Myers et al. 1996). Since the infall asymmetry in starless core was first reported in L1544 (Tafalla et al. 1998), it has been observed in numerous starless dense cores using thin (such as 1-0) and thick (such as CS 2-1, CS 3-2, and HCN 1-0) molecular lines, finding that inward motions are a dominant feature in starless cores (Lee et al. 1999, 2004, Sohn et al. 2007).
Mapping observations of starless cores also indicated that the infall asymmetry is spatially extended comparable to the size of the cores (Tafalla et al. 1998; Lee et al. 2001; hereafter LMT01). The most extensive mapping survey of starless cores to study a pattern of inward motions was given by LMT01. Out of 53 starless cores observed in both of 1-0 and CS 2-1 lines, 19 infall candidates were selected according to the spectral shapes of CS 2-1 lines, and the velocity shift of their brighter component from the velocity of the systemic component traced by the optically thin line. This survey showed that extended inward motions are a frequently occurring feature in starless cores, and are probably a necessary process in the condensation of a star-forming dense core.
On the other hand, mapping studies have also indicated that gaseous motions could be more complex in some cores than “all inward”. Some starless cores showed overabundance of red asymmetric profiles (e.g., L429-1 and CB246 from LMT01 and FeSt1-457 from Aguti et al. 2007). Just as the blue asymmetric profiles indicate inward motions, the cores showing red asymmetric profiles are likely to be expanding. The origin of such expansion is unclear. One suggested idea for the existence of red asymmetric profiles in a dense core is that some disturbance in the external pressure of the core under the state of gravitational equilibrium (such as shock waves caused by nearby OB stars or supernovae) may trigger its oscillatory motions in the outer layers and the core is now being observed at the status of expanding motion (e.g., Lada et al. 2003, Redman et al. 2006, Aguti et al. 2007). Other starless cores (L1495A-N, L1507A, and L1512 from LMT01 and B68 from Redman et al. 2006) show a complicated mixture of blue and red asymmetric profiles. Oscillating motions of some specific mode in gaseous outer layers of the cores were also suggested to explain this feature (e.g., Lada et al. 2003, Broderick & Keto 2010).
Of course there are some cores which do not show any significant asymmetric feature in lines, i.e., no evidence for large scale contraction or expansion.
The foregoing results raise several basic questions about core motions and about how such motions are distributed in a sample of cores. How likely is it for a core to have motions dominated by infall, expansion, oscillation, or no obvious pattern ? Do the patterns of the internal motions in starless cores reflect any evolutionary status of the cores toward the star formation ? Would some environmental conditions affect their internal motions in starless cores ? Which physical parameters are significant, and how do they relate to observed internal motions ? Answers for these questions may help us to improve our understanding of how stars form in dense cores.
For this study we compiled and analyzed molecular line data available to assess the statistics of internal motions of starless dense cores and discuss on how they evolve toward star formation. In the following section the data that we collect are summarized. In Section 3 we examine the distribution of the normalized velocity differences between the optically thick and thin lines and its relation with physical quantities. In the last section we discuss implication of the distribution of the in the context of dense core evolution and environmental effect on the distribution.
2 Data
The spectral line data that are used in this study have been obtained from several previous observations, single pointing surveys of starless cores in CS 2-1 and 1-0 (Lee et al. 1999), in CS 3-2 (Lee et al. 2004), in HCN 1-0 (Sohn et al. 2007), and a mapping survey in CS 2-1 and 1-0 (LMT01). For these systematic surveys of starless cores we first constructed a catalog of optically selected cores (Lee & Myers 1999) from which 306 cores were selected as “starless” in the sense that they do not have either an embedded IRAS point source or a pre-main-sequence star.111Recent ’s Legacy Project “From Molecular Cores to Planet Forming Disks” (c2d; Evans et al. 2003) for small isolated cores indicated about 20 of “starless” cores harbor a very faint source which is called as Very Low Luminosity Objects (VeLLOs; Dunham et al. 2008). We dropped such cores in any number statistics in this paper.
Next we performed systematic spectral line surveys of 220 starless cores listed in the catalog in CS 2-1 and/or 1-0 to sample 66 cores detected in both lines (Lee et al. 1999). Then we made observations of the cores in CS 3-2 to have 66 cores detected in both CS 3-2 and (Lee et al. 2004), and also in HCN 1-0 to have 48 cores detected in both HCN and (Sohn et al. 2007). Mostly the same sources were detected in all four set of molecular lines CS 2-1, 3-2, HCN 1-0 and 1-0 except for a few sources. For example the number of cores detected in whole set of CS 2-1, 3-2 and 1-0 is 64. Thus two sources were detected in either CS 2-1 and 1-0 only or CS 3-2 and 1-0 only . Out of 48 sources detected in HCN 1-0 and 46 cores were also detected in the set of CS and lines. This indicates that starless cores detected in CS, HCN, and that are discussed for various statistics from different molecular line observations in this paper are mostly the same.
The mapping survey of a total of 53 targets has been performed with CS 2-1 and/or 1-0 to have 34 starless cores mapped in both lines (LMT01). These data are used in the analysis of the spectral asymmetry. The molecular line observations we collect for this study are summarized in Table 1.
The cores studied here have properties of typical mean density of and column density of a few (Lee & Myers 1999). The mapped radii of the cores in lines vary from 0.1 to 0.3 pc with a typical value of pc. The cores traced in CS lines are more extended, sometimes twice more, than cores. In Table 2 we collect detailed information on the starless cores that are frequently referred here, mostly from LMT01 regarding the degree of asymmetry in profiles and physical properties of the cores.
3 Analysis of the Normalized Velocity Differences of Spectra
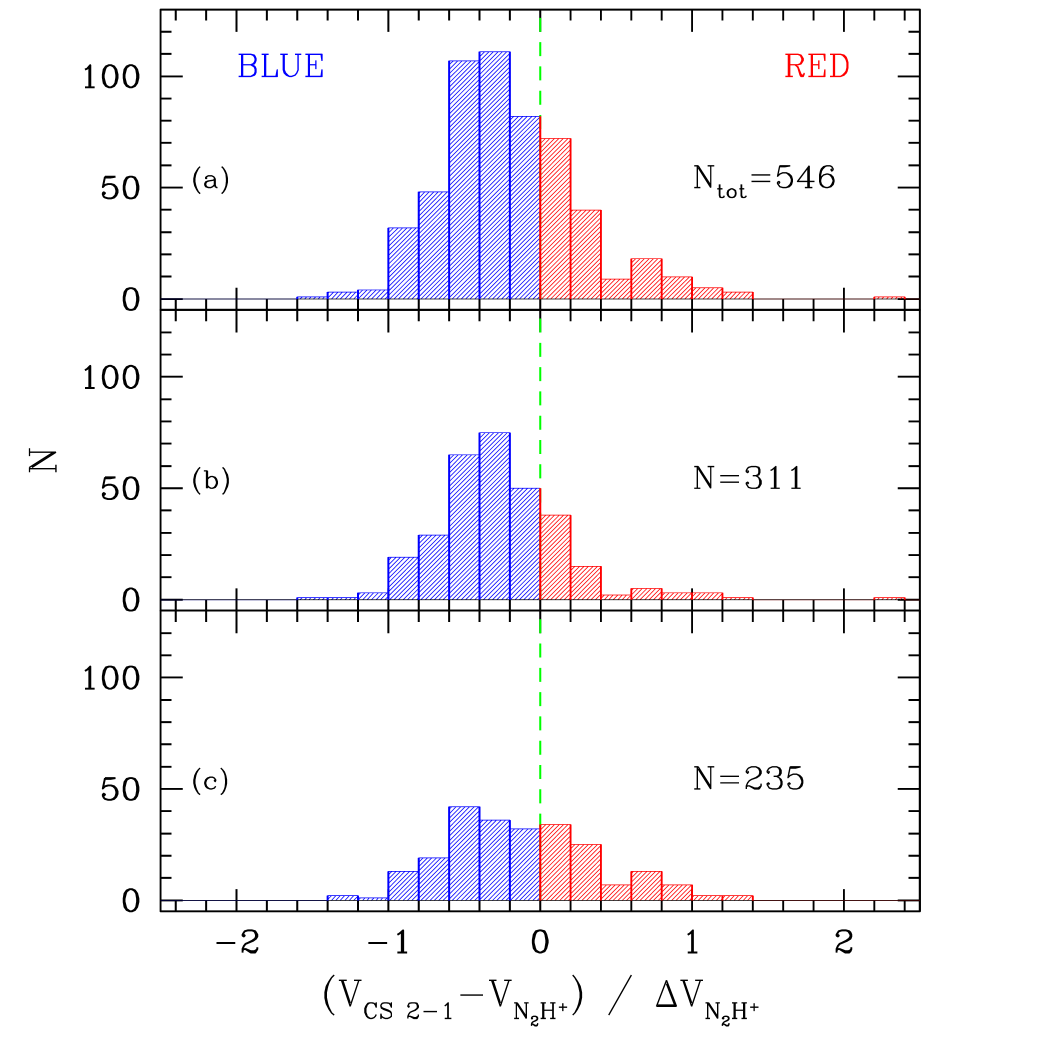
Quantifying properly the spectral asymmetry is very important to infer which internal motions are dominant in starless cores. The amount by which the optically thick spectrum is blueshifted or redshifted with respect to the optically thin line (N2H+ 1-0) can be estimated by using the normalized velocity difference , where and are the peak velocities of the optically thick and thin lines, and is the FWHM of the thin line (Mardones et al. 1997, Lee et al. 1999, LMT01). All the velocity information of the spectra was obtained with a Gaussian fit of the lines. This is a useful quantity which can help to determine the degree of spectral asymmetry. For example, if the for the spectra is negative, this would indicate that the thick profile is in infall (or blue) asymmetry possibly tracing inward gaseous motions, called as a blue profile. On the other hand, if the is positive, this may mean that the profile is now in outflow (or red) asymmetry tracing outward motions, called as a red profile.
3.1 Number Distribution of of Optically Thin and Thick Spectra
The number distribution of of the observed spectra has been examined with single pointing observations toward central regions of the cores using molecular lines of CS 2-1 (Lee et al. 1999), CS 3-2 (Lee et al. 2004), and HCN 1-0 (Sohn et al. 2007) as optically thick tracers and 1-0 as an optically thin tracer. From the single-pointing survey for 220 starless cores in the lines of CS 2-1 and/or 1-0, the distribution has been constructed for 66 cores detected in both CS 2-1 and 1-0 lines (Lee et al. 1999). The distribution from single pointing observations for CS 3-2 and 1-0 has also been tested for 66 starless cores (Lee et al. 2004; hereafter LMP04). Both distributions for CS 2-1 and CS 3-2 with respect to the 1-0 are found to be significantly skewed to the negative value, suggesting that CS 2-1 and 3-2 lines preferentially trace inward motions in the cores (see Figure 3 of LMP04 for the revised distributions). The distribution for HCN 1-0 using its single pointing observations showed that the degree of the skewness in the distribution to the blue (the negative value) is even greater than that for any other infall tracers such as CS 2-1 and 3-2, indicating that HCN is the best tracer of inward motions (Sohn et al. 2007). The skewed distribution of to the blue for all tracers from previous single dish surveys implies that it is very likely that the central region of a core has inward gaseous motions.
Then how is it likely for a core to show infall asymmetry at any place when one looks at the dense core ? What kind of motions are more likely to be observed in a dense core ? The analysis using all mapping observations with the above infall tracers may be able to address these questions. For this purpose we use CS 2-1 and 1-0 mapping data for 34 starless cores by LMT01 which give the most extensive data set of the line spectra available for this analysis.
Figure 1(a) is a histogram for the number distribution of for all observed positions of 34 starless cores, indicating overabundance of blue profiles. Note that half of the sample (17 cores; the group A) has been selected as infall candidates based on the single-pointing observations of Lee et al. (1999) while the other half of the sample (the group B) has been selected because they were either bright in high density tracers such as CS, , and lines, or very opaque in optical (LMT01). Figure 1(b) is the number distribution of for the cores for the group A and Figure 1(c) is that for the group B. These figures are intended to test whether the distribution of all cores shown in Figure 1(a) is significantly affected by a bias of sample selection. The mean value (and standard error of the mean, hereafter s.e.m.) of the distribution for the entire sample is -0.20.02. The mean value of for the group of infall candidates of Figure 1(b) is -0.260.02 while that for no infall-biased sample of Figure 2(c) is -0.120.03. This suggests that the distribution of the entire sample is somewhat affected by that of the the infall candidates group A. Nonetheless, it should be noted that the distribution of the group B also exhibits a statistically significant overabundance of blue profiles.
In fact, the selection of our sample has been originally made from single pointing observations toward 220 starless cores with high density tracers such as CS and among which 66 cores were both detected with two tracers. Thirty four cores have been chosen for mapping with same tracers on the basis of the brightness of the observed lines, especially line to make follow-up mapping observations feasible, regardless of whether they are infall candidates or not. In this sense our sample is not biased in the selection of targets by the pre-existence of infall asymmetry in cores from the single pointing survey, but by the brightness of the sources.
Therefore the overabundance of blue profiles in the distribution should be affected from our selection bias of the bright (in ) sources. What is really implied in the distribution of Figure 1 would be that bright cores (i.e., cores with high column density) are likely to have inward gaseous motions. This result is further investigated in the following section.
3.2 Relation of the Distribution with Gas Column Density
This section suggests that regions of higher column density have a better chance of having more negative or being in inward gaseous motion. We use the integrated intensity of 1-0 line as the column density tracer. The 1-0 line is usually optically thin, and the ion molecule barely depletes in the dense core. Thus 1-0 is useful to trace the density distribution of the cores (e.g., Tafalla et al. 2004, 2006).
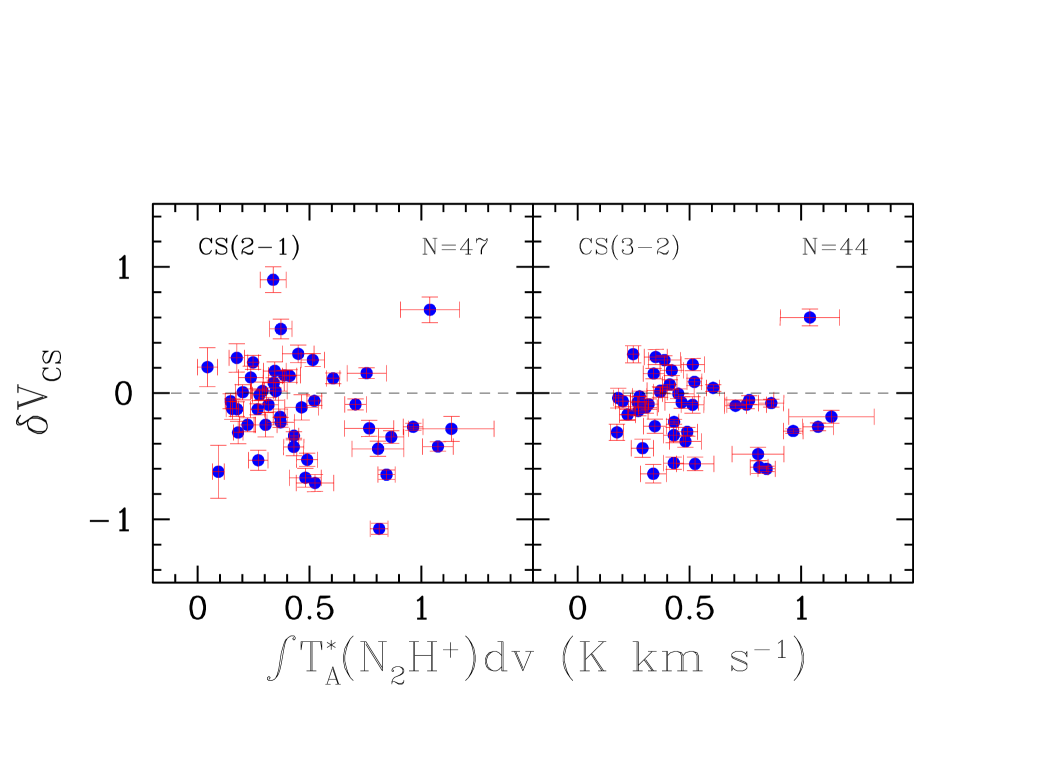
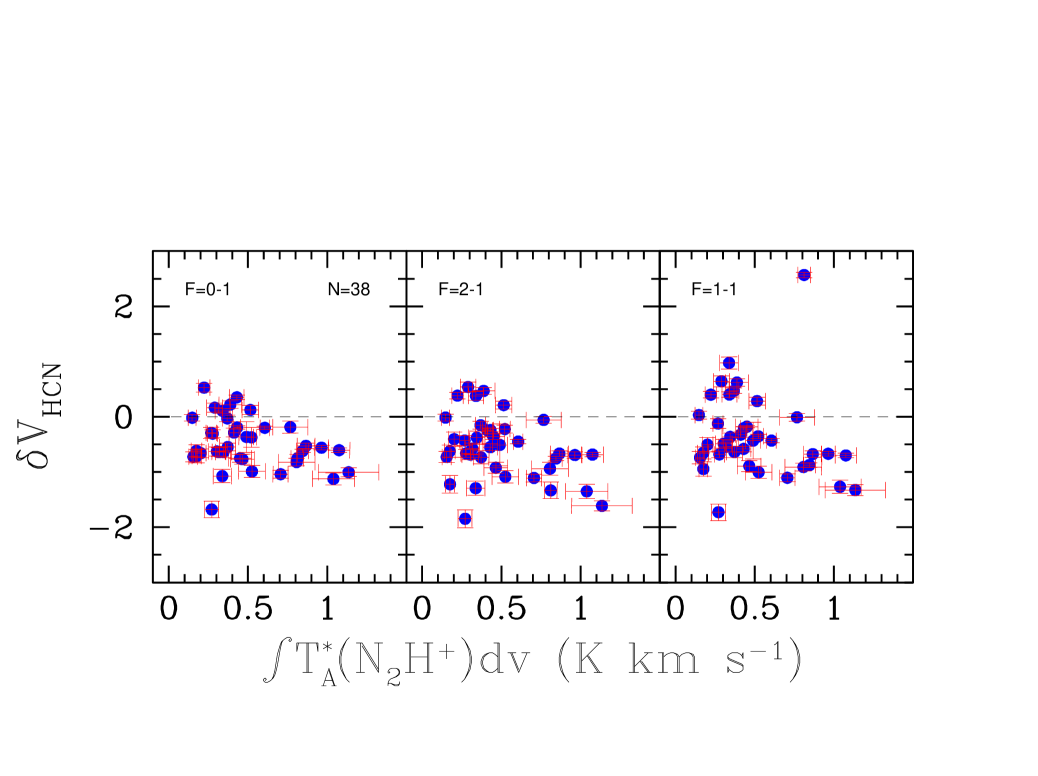
Figure 2 and 3 examine the dependence of on the integrated intensity of using single pointing data for CS 2-1, 3-2, HCN 1-0, and from Lee et al. (1999, 2004) and Sohn et al. (2007). The data were selected if the integrated intensity of is brighter than its 5 uncertainty. This allows us to have 47 sources for , 44 sources for and 37 sources for . All the diagrams in Figure 2 and 3 show that the cores with stronger emission tend to have their profiles more blue-skewed.
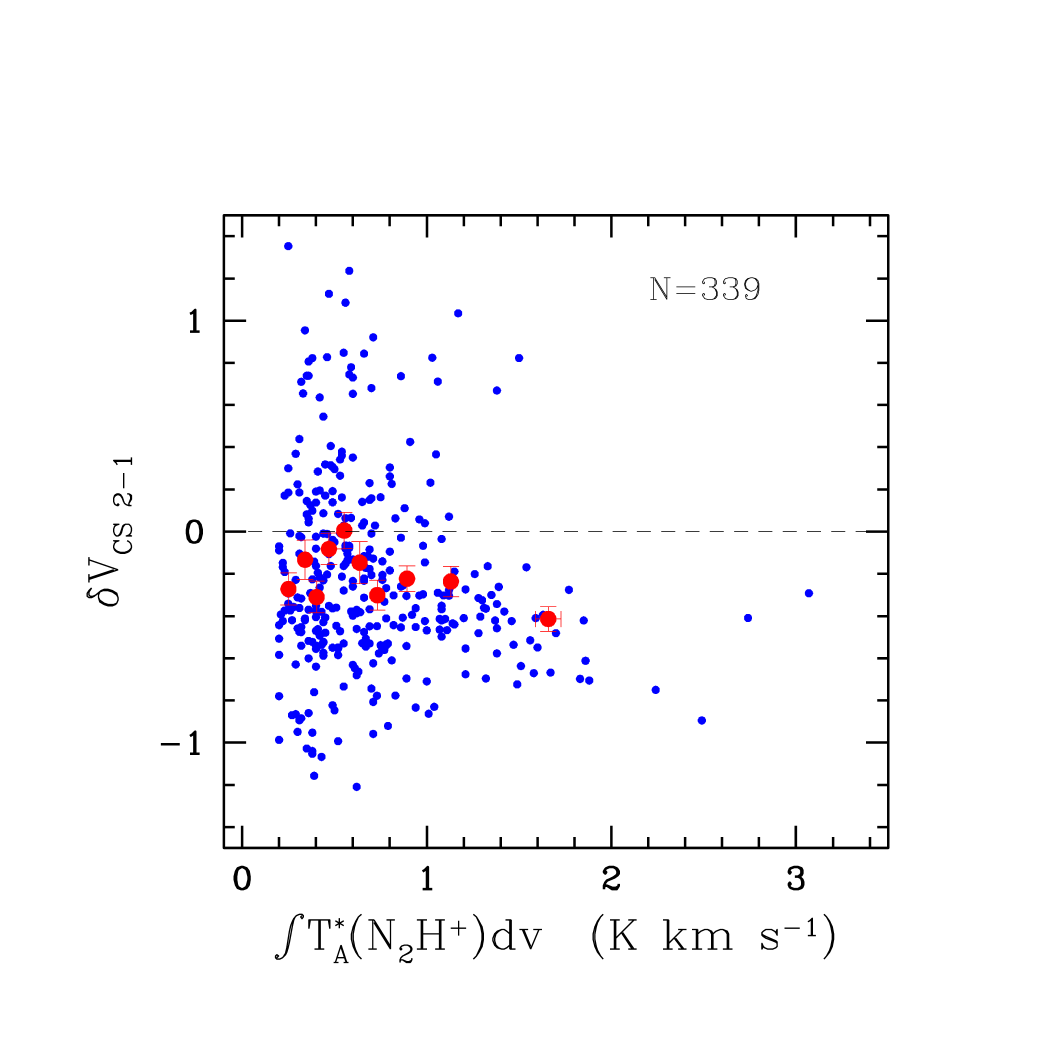
This tendency can be more thoroughly examined using mapping data in CS 2-1 in Figure 4. A total number of the positions where both CS and lines are available is 546, but in the figure we selected the data for 339 positions for which the integrated intensity of is brighter than its 5 uncertainty. We also display bigger red dots in Figure 4 which are the points of average values of s and intensities for positions counted in order of increasing intensity (i.e., from the left of the diagram) in 10 intervals so that in each interval the data for 34 positions are included and the rightmost bin contains last remainders (the data for 33 positions). The error bar is 1 uncertainty of the average. There is a clear tendency of to be larger in negative sense or of the infall asymmetry to be more significant at the bright positions.
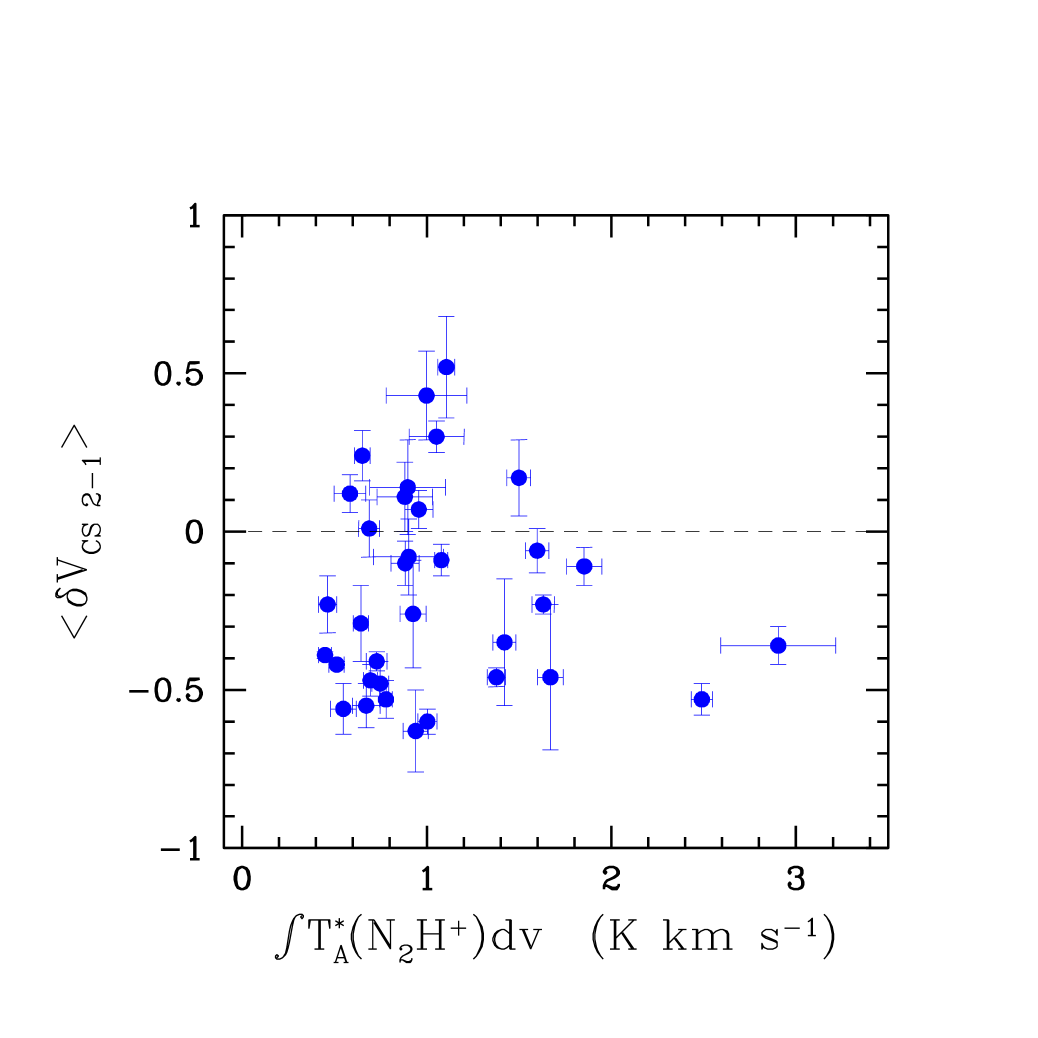
Figure 5 shows the distribution of versus the peak integrated intensity of in the cores. Here is the average of values of all positions for each core where the integrated intensity of is brighter than its 5 uncertainty. The difference between Figures 4 and 5 is that Figure 4 displays the distribution of over all mapped positions while Figure 5 shows the distribution of average over each core. Figure 5 indicates that the infall asymmetry of CS line is more significant at a core with the brighter peak intensity of .
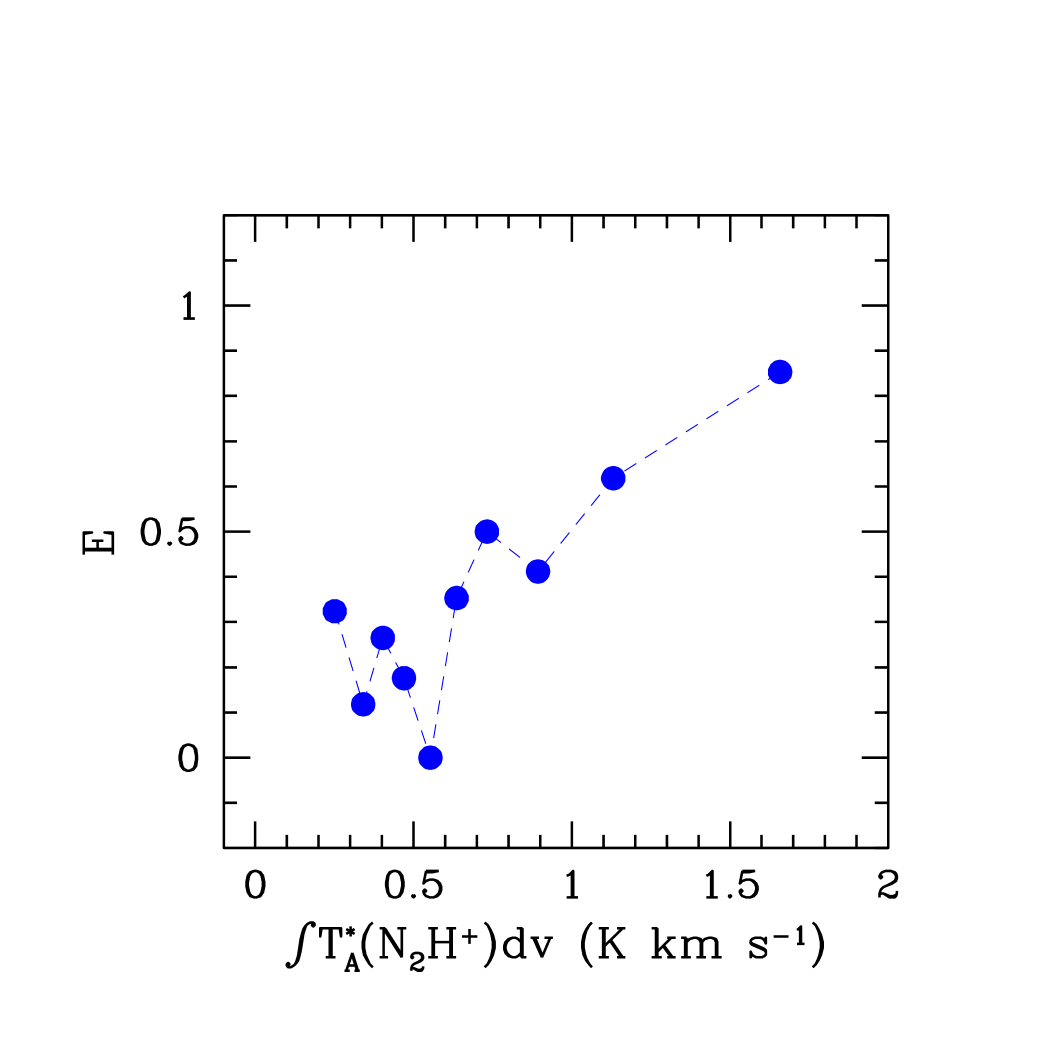
Figure 4 and 5 show that denser regions have bluer spectra. In addition, such dense regions have a larger proportion of blue spectra, as shown in Figure 6. The fractional blue excess () given in the ordinate of Figure 6 is defined as , where is the number of positions with , is the number of positions with , is the total number of positions given by , and is the number of positions with . All the numbers regarding the excess are estimated with the data points in the ten bins of the sample as in the case of Figure 4. The figure again shows that the positions where is brighter tend to have higher blue excess and thus to have more significant signature of inward motions. The 1 uncertainty of the average in the intensity is typically less than 0.01 which is smaller than the size of the dots in the figure, except for that of the brightest data point which is about 0.07 .
The uncertainty of E is difficult to calculate from the noise of the spectra. However, we may estimate its approximate value by assuming that the typical 1 uncertainty in () is unity, corresponding approximately to one incorrect assignment in the sample of in each bin. This implies by standard propagation of errors, uncertainty of E of . This suggests that the uncertainty of E is fairly small like the case of the uncertainty of the intensity. Thus the apparent trend in Figure 6 is likely to be significant against uncertainties of the intensity and of E.
3.3 Variation of with the Distance from the Peak Gas Column Density
This section examines how the asymmetric pattern of spectral lines changes with the distance from the density peak of a core.
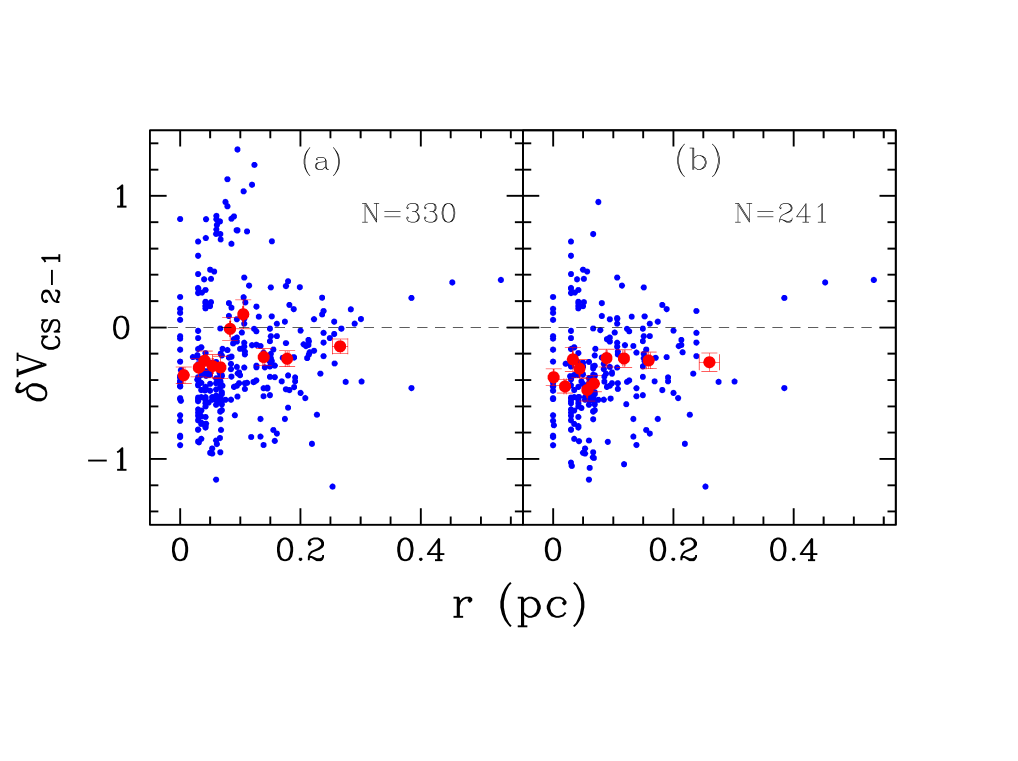
We discuss this with Figure 7 where of each spectrum is plotted against the distance of its position from the peak intensity position of . The distances to the cores from us were adopted from Table 2 of Lee & Myers (1999). Figure 7(a) displays distribution of the spectra of all sources where the integrated intensity of is brighter than its 5 uncertainty, indicating that tends to be more negative at positions closer to the position of peak intensity. In the figure there is a break for this tendency at the radius of 0.1 pc, where the local mean value of is close to zero. Over 0.1 pc the becomes again negative, although it is less negative than at inner (0.07 pc) positions, implying that blue profiles are also prevalent even at large radii. The break around 0.1 pc is mainly due to the contribution by the data from three cores L183, L429-1, and L1495A-N where both blue and red asymmetric CS profiles are observed in a significant number.
Figure 7(b) is the same diagram as Figure 7(a), but without having these cores, demonstrating that the mean value of close to zero in Figure 7(a) is due to the distribution of blue and red profiles in a comparable number in three cores. L1512 is also another core showing such distribution of spectra. But it has a relatively small number (9) of data positions and its most positions in the diagram are located within the radius of 0.06 pc from the peak position. Thus L1512 is not responsible for the break at 0.1 pc.
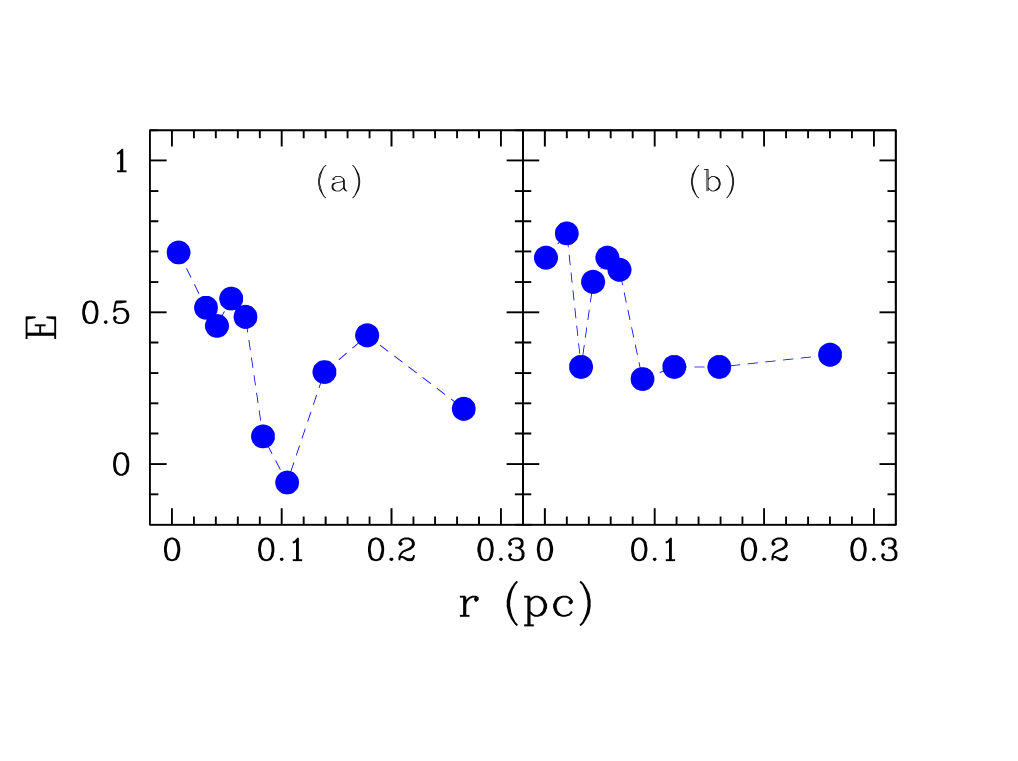
Figure 8 is another display of the distribution with the distance from the position of the peak intensity using a tool of the fractional blue excess like Figure 6. The figure shows that the fractional blue excess is more pronounced, implying overabundance of blue profiles, in inner region of the core (within a radius of about 0.07 pc from the column density peak of the core) than in its outer region. The 1 uncertainty of the average in the radial distance from the position of the peak intensity is typically less than 0.003 pc which is smaller than the size of the dots in the figure, except for that of the most distant point which is 0.017 pc. Because the uncertainty of E is also expected to be fairly small as discussed in the last section, this trend seen in Figure 8 is expected to be significant.
As the case of Figure 7, Figure 8(a) is a diagram for the spectra of all sources, showing that blue excess is close to zero at 0.1 pc and become significant even at the radii larger than 0.1 pc. Figure 8(b) is the same diagram as Figure 8(a), but without above three cores, confirming that the break of the blue excess at 0.1 pc is due to these cores.
The foregoing figures show that most cores in our sample have spectral asymmetry maps indicating contracting motions. However it is also clear that a minority of the cores cannot be described as primarily contracting. Therefore we classify cores into four groups according to their apparent dynamical status. We then examine how varies with the distance from the core map peak within each group.
The classification of the cores was made by using two parameters given by LMT01. These are the fractional blue excess E and the P-value of a student t-test for the distribution for each core. The P-value is the probability of drawing our distribution from a zero mean t-distribution. The E parameter determines how many blue or red profiles exist in a core while the P parameter informs how the dominance of the blue or red profiles is significant in the core. These parameters are listed in Table 3 of LMT01. Here the classification of the cores is given for 33 cores with measurement for more than three positions.
The first group of the sources are the infall candidates suggested by LMT01 which show significant overabundance of blue profiles in a core ( and ). This corresponds to the groups 1 and 2 in Figure 6 of LMT01; L1355, L1498, L1495A-S, TMC2, L1544, TMC1, L1552, L1622A-2, L158, L183, L1689B, L234E-C, L234E-S, L492, L694-2, L1155C-2, L1155C-1, L981-1, and L1197. Here we name these as candidates of “contracting core”.
The second group of the sources is the cores where blue and red profiles are observed in a comparable number so that there is no significant blue or red excess () with a large spread in the distribution (one standard deviation ). This corresponds to group 5 in Figure 6 of LMT01; L1495A-N, L1507A, and L1512. We refer this group to candidates of “oscillating core” because the mixture of blue and red profiles may be caused by oscillation motions of gas as suggested by Lada et al. (2003), Redman et al. (2006), and Aguti et al. (2007).
The third group of the sources is the cores dominated by red asymmetric profiles, showing significant overabundance of red profiles in a core ( and ). This corresponds to the group 3 in Figure 6 of LMT01; L134A, L429-1, and CB246. L134A has been dropped from this group in LMT01 by a mistake because it was erroneously treated as the sources with a small number () of measurements although it had 9 positions where was obtained. Now we include L134A in this group. On the other hand L1521F which had been classified to this group in LMT01 is dropped from this group because it is now known to have an embedded source (Bourke et al. 2006). We refer this group to the candidates of “expanding core”.
The fourth group of the sources are the cores with little blue or red excess and CS profile shapes similar to a single Gaussian form so that there is no significant blue or red excess () with a small spread in distribution (one standard deviation ). This corresponds to the group 4 in Figure 6 of LMT01; L1333, L1495B, L1400A, CB23, L1517B, L1622A-1, L1696A, and L234E-N. Here we included to this group CB23 which had been dropped from any classification of the cores in LMT01 because of a small number (four) of measurements of . We refer this group to the candidates of “static core”.
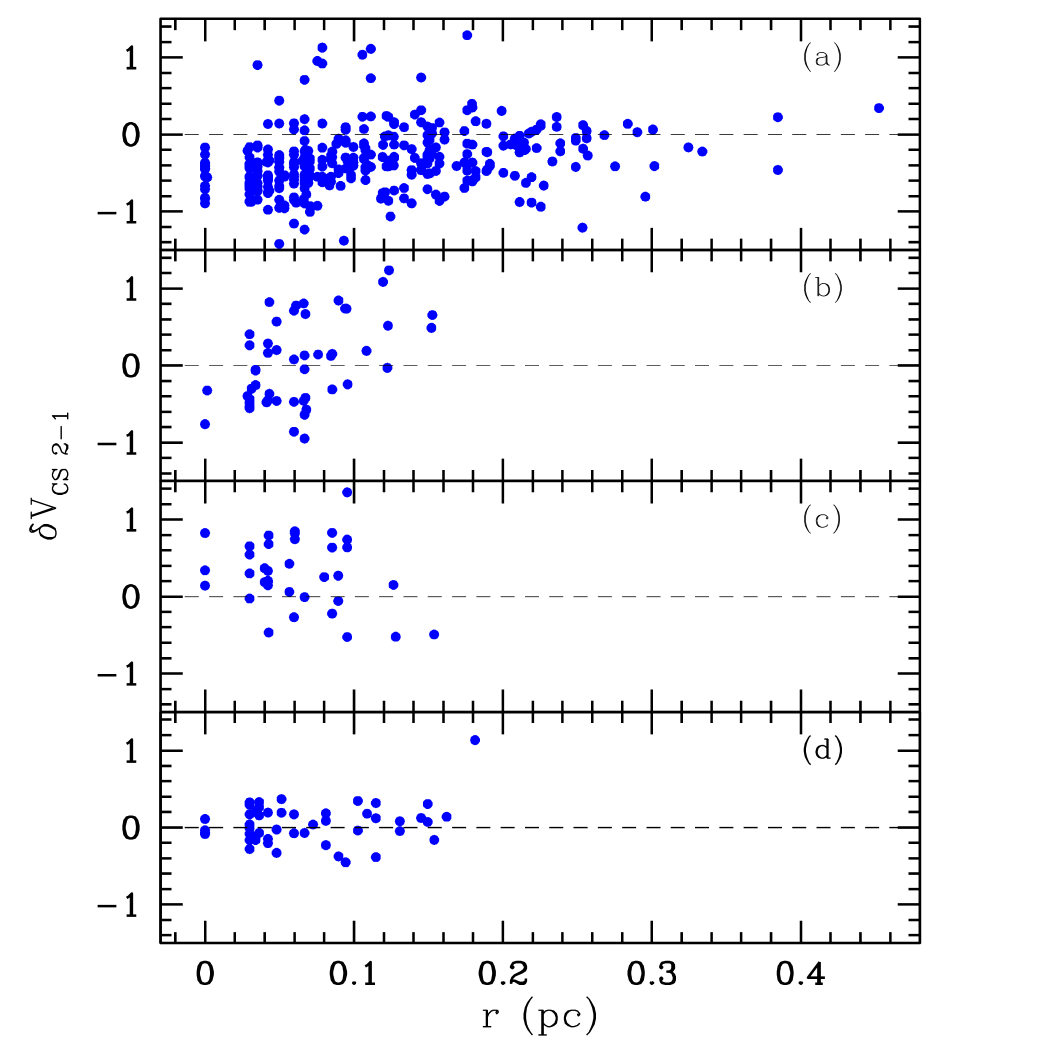
Figure 9(a) displays the distribution versus the distance from the position of peak intensity for 19 contracting cores in group 1. In this group, there are more positions with negative than those with positive at every radius. Within 0.07 pc this trend is much more significant: nearly all of the positions in contracting cores have negative .
On the other hand, the trend is not seen in other groups of the cores. Figure 9(b) shows that the oscillating cores in group 2 have overall comparable positions at both positive and negative along the distance, although there are a few more positions with negative at inner region pc and more positions with positive at outer region pc. The expanding cores in group 3 show opposite distribution to that of contracting cores, i.e., much more positions with positive than those with negative [Figure 9(c)]. The static cores in group 4 show no significant variation in value along the distance from the peak intensity, but with one exceptional position with the highest positive at the longest distance.
Note that the contracting cores are the majority of the data and their group shows the similar distribution to what is found in Figure 7 and 8 for whole sample of cores while other groups of the cores do not show it. This suggests that the characteristic property of the predominant distribution of negative value along the radius of the cores comes from distribution in the contracting cores.
4 Discussion
4.1 Relation of the Distribution with Gas Column Density and its Implication
In Section 3.2 we have shown that the bright positions tend to have more negative , a significant signature of inward motions. This section discusses this result in terms of individual cores and their dynamical status, and interprets the discussion in terms of evolution of the dense core.
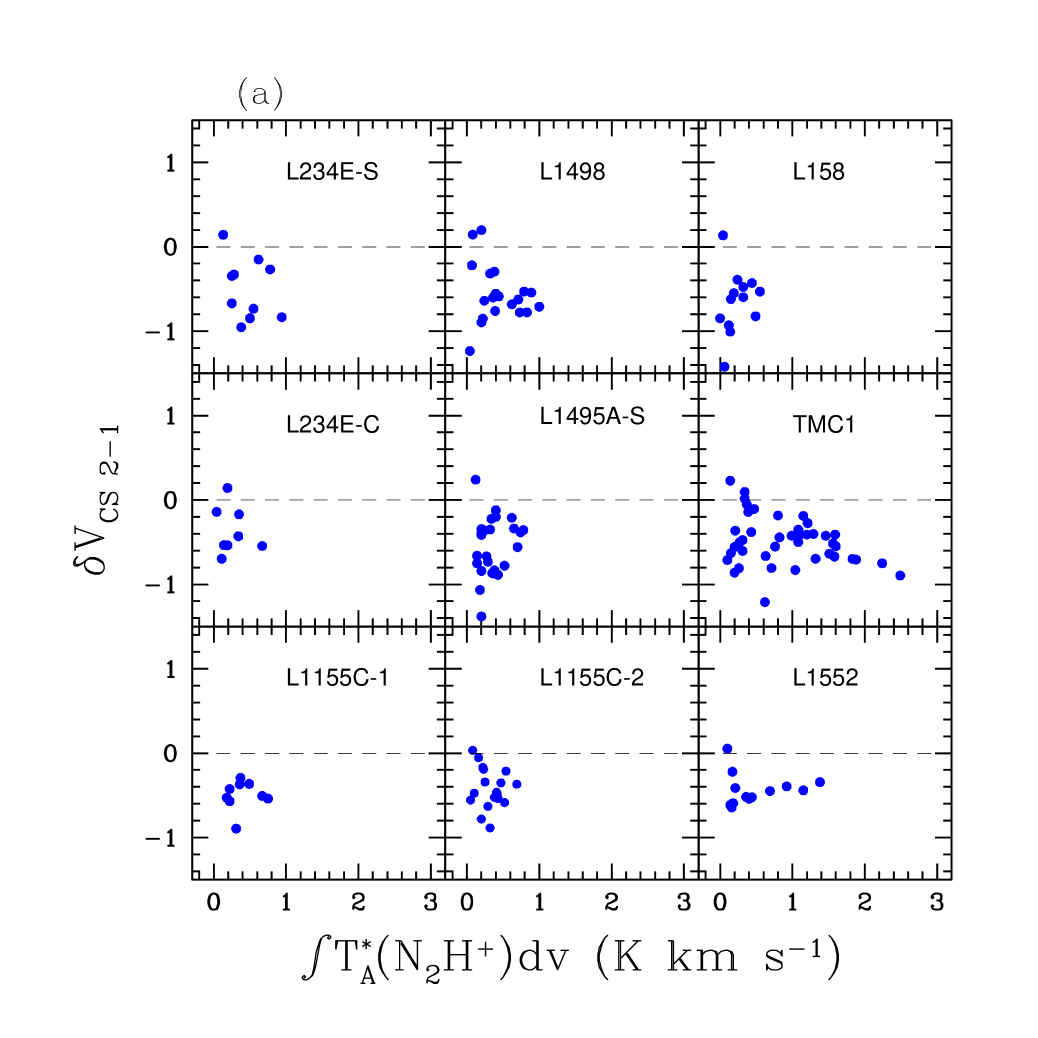
Figure 10 indicates the distribution of against the integrated intensity of for all available positions in the starless cores in four panels. While Figure 4 presents these data for all the cores in the plot, Figure 10 shows the same data in a separate plot for each core. Panel (a) of Figure 10 displays the distribution against the integrated intensity of for the contracting cores in decreasing order of , showing that clearly tends to be more negative at the brighter positions of . On the other hand, the cores in the other groups do not show any trend with integrated intensity of 1-0. The oscillating cores in panel (b) show that the distribution of is polarized between positive and negative values of , independent of the integrated intensity of . The expanding cores in panel (c) are also hard to see any dependency of the distribution of on the integrated intensity of . Instead they have mostly positive . The static cores in panel (d) tend to be less bright in emission than other types of the cores and show a uniform small spread of compared with that of oscillating cores.
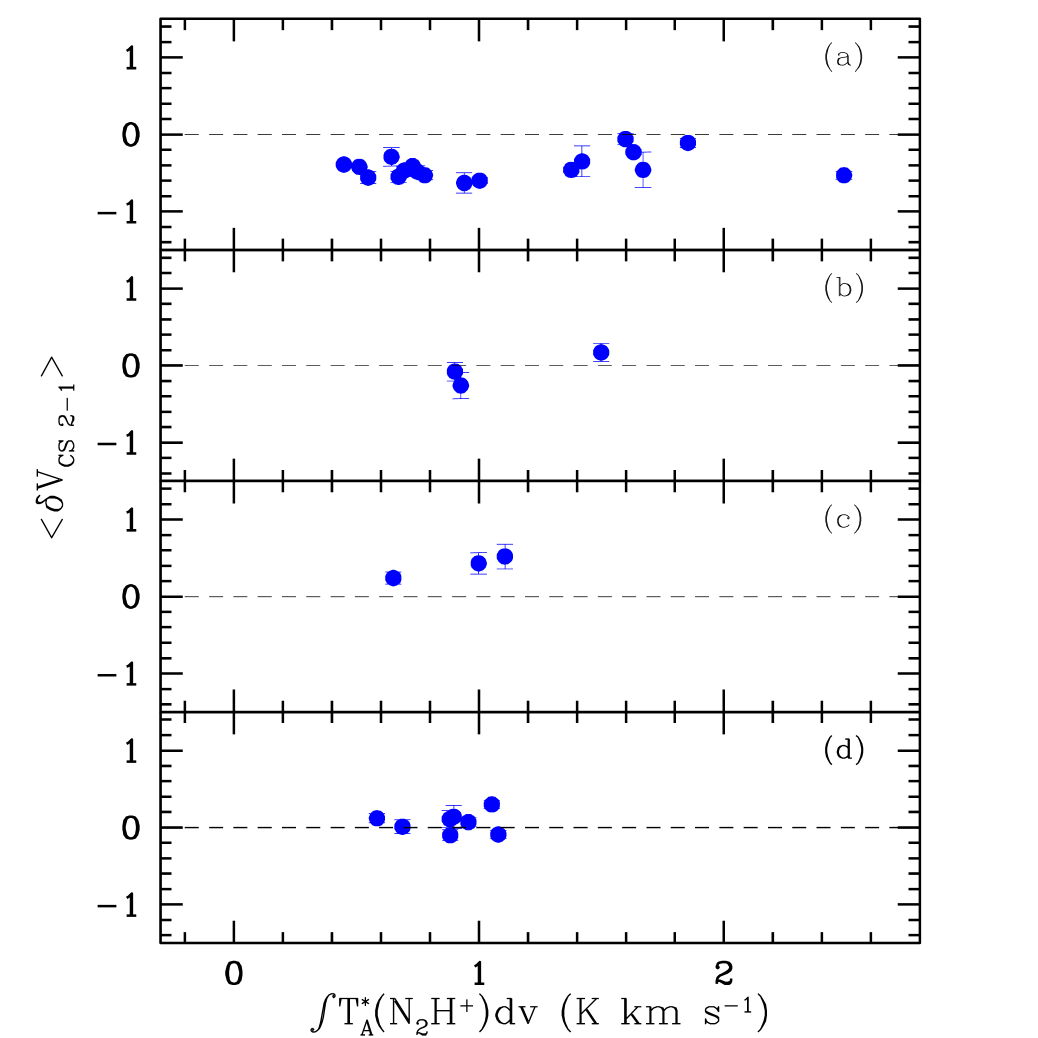
Figure 11 is another presentation of the distribution of as a function of the peak integrated intensity of when the cores are combined into their four dynamical status groups.
Figure 11(a) displays that contracting cores have the distribution of negative over wide range of the peak integrated intensity of . On the other hand, the cores in other groups have the distribution in smaller range of the intensity of . The oscillating cores and the static cores are similarly distributed near to zero value, but the oscillating cores have larger scatter (s.e.m. of 0.13 - 0.18) in value of each core because of the mixture of blue and red profiles in the core [Figure 11(b)], compared with that (s.e.m. mostly) in value of static cores [Figure 11(d)]. All of the expanding cores have positive contrary to the distribution of contracting cores.
Figure 11 shows that brighter cores tend to be dominated by contracting cores as was also shown in Figure 6. In addition, Figure 11 shows that non-contracting cores tend to be similarly faint in each group, with . Above a certain value () of the integrated intensity of there are contracting cores only (with negative ). This suggests that as starless cores become denser and approach some specific column density, they tend to have more chance to contract. Above this critical value of column density all starless cores are always to be in inward motions. We derived such a critical column density by using Equation (A4) of Caselli et al. (2002) and converted this to the corresponding column density of by using an average abundance of of of starless cores which is obtained using Table 3 in Johnstone et al. (2010). Our diagram may indicate that there is a threshold value of column density of over which most of starless cores are contracting. Note that this is very similar to the value of column density of for a star formation in dense cores suggested by Onishi et al. (1998)
Crapsi et al (2005) have shown that column density [] can be an indicator of the evolutionary status of starless cores since increases with other evolutionary indicators including column density [], / , column density, and CO depletion factor. According to their investigation, it is likely that starless cores with higher column density are more evolved than the cores with lower column density. If this is true, Figure 11 may imply that, in terms of increasing column density, starless cores in four groups are in a sequence of core evolution. In this picture, the static cores with the lowest column density may be in the earliest stage, the expanding cores and/or the oscillating cores in the next, and the contracting cores (with the highest column density) in the latest stage. We note that oscillating and expanding cores are nearly indistinguishable because of a small number of samples. It may be possible that some expanding cores are at the stage of outward motion in oscillatory mode. More sample of the cores in each stage is needed to constrain the evolutionary sequence of the cores with better statistical significance.
The discussion for this evolutionary sequence is qualitatively similar to the picture discussed by Stahler & Yen (2010). Using perturbation theory, they showed that the starless core would undergo contraction if they are initially compressed or inflated by the oscillation. Our diagram of observing data seems to indicate a similar result: Once the static cores are perturbed, this may result in imbalance between self gravity and the outward pressure gradient, and thus expanding or oscillating motions in the core. Once a core becomes denser over the critical column density like , it may be in “all” contracting motions. We note that there are also cores with low column density, but in inward motions, indicating that some cores may spend very short time in oscillation or expansion.
The discussion for the time scale in each stage is also interesting. Lee & Myers (1999) have suggested that starless cores of a mean density of last for about years using the statistical number ratio ( for the number ratio of starless cores and cores with embedded protostars) and the life time of protostar as years. Ward-Thompson et al. (2007) re-estimated this life time of starless cores as years using better estimate of Class I life time (). This estimation also needs to be revised by considering that about 20% of the starless cores may not be “starless” because they contain an embedded very faint source, i.e., the VeLLO (Dunham et al. 2008) and the reference life time of protostars (Class 0 and I) is recently updated as years with much better statistics by Evans et al (2009). By using these new information, our revised value of the life time of the detectable starless cores denser than is now estimated to be years.
If the starless cores share this duration for each evolutionary stage proportional to the statistics of the numbers in each class, the cores may spend the force balanced period for () years, experience either expanding or oscillatory motions in the surface of the cores for () years and then contract for () years.
Aguti et al. (2007) have calculated the modes of pulsation for an isothermal globule of gas in spherical shape for the core FeSt 1-457 and found its required mode as the least-damped mode of with an oscillation period of years. This oscillation period is consistent with our determination of the statistical period of starless cores in oscillation mode, even with small sample statistics.
4.2 Environmental Effect on Internal Motions in Starless Cores
Are internal motions in starless cores affected by the core environment ? We examined the association of 35 cores (including B68 and Fest1-457 as well as our sample) to any surrounding structures of clouds in the maps of the Digitized Sky Survey obtained using a star-count method by Dobashi et al. (2005), by checking how the core is enclosed with the lowest contour (=0.5) in the maps.
From this eye inspection we found that among 35 cores L694-2 is a core isolated entirely from nearby large cloud complex. There is also one small cloud where 2 of the cores, L134A and L183, are enclosed within the lowest contour (=0.5). This cloud is isolated from other nearby clouds. B68 is not identified in the map by Dobashi et al. (2005), probably because there are not enough background stars available toward B68 for enabling around the core to be estimated. From its location in the map, B68 seems located in a very small region within a surrounding cloud. Thus we believe 4 sources (L694-2, L134A, L183, and B68) may be well isolated from large clouds.
On the other hand the majority of the cores (17 of 33 cores) are found to exist as a part of long filament clouds. They are L1333, L1498, L1495B, L1495A-N, L1495A-S, L1400A, TMC2, TMC1, L1507A, CB23, L1544, L1696A, L1689B, L158, L234E-N, L234E-C, and L234E-S. The rest of our sample (14 of 35 cores) are more likely surrounded in a large cloud or located in the edge of the cloud (L1355, L1517B, L1512, L1552, L1622A-2, L1622A-1, L492, L429-1, L1155C-2, L1155C-1 L981-1, L1063, L1197, CB246, and Fest1-457).
Can isolation of the cores from a large complex cloud affect its dynamical status ? We may find some clue for this question if the isolated cores have their characteristic features of the spectral asymmetry. According to criteria given in Section 3.3, L694-2 and L183 are classified as contracting cores and L134A as expanding core. B68 is known to have a mixture of blue and red profiles, interpreted as an indication of oscillation motions of gaseous material in the surface of a core (Redman et al. 2006, Lada et al. 2003). It is interesting to note that no core which is in isolation from other clouds has spectra of a Gaussian shape indicative of dynamically static status. However, we are cautious to draw any conclusive remarks on the characteristic properties of the dynamical status of the isolated cores due to the poor statistics by our small sample and more data are needed.
Now we examine difference in dynamical status of starless cores in two other environments, the long filament clouds and the large complex clouds. According to previous classification criteria of the cores and examination of core associations with large clouds, we find that nine contracting, two oscillating, and six static cores are located in the long filamentary clouds while eight contracting, one oscillating, two expanding cores, and three static cores are in large complex clouds. Although there is a slight difference in the number of cores in two types of clouds, it seems hard to conclude whether the difference is significant or not, due to its limited statistics.
5 Summary
This paper aims for discussing how it is likely for a starless core to be in contracting, expanding, oscillating or static motions and which conditions are related to such dynamical status of the core, by analyzing asymmetric pattern in molecular lines. For this purpose we collected either single-pointing or mapped spectroscopic line data for several tens of starless cores and re-analyzed those especially by using the normalized velocity difference between optically thick and thin lines.
The main conclusions we found from this analysis are as follows:
1. Blue profiles are dominant in starless cores, implying that inward motions are prevalent in starless cores. These profiles are found to be more abundant and their asymmetry is bluer at the positions of the core with stronger or higher column density. This indicates that positions with high column density in the core are more likely contracting.
2. Relying on the distribution of their spectral asymmetric features, starless cores were classified to have four types of motions, contracting, oscillating, expanding, and static motions. More than half (19) of the 33 cores studied have spectral line maps dominated by evidence of contracting motions, about a quarter (8) of the cores show no significant evidence of either contraction or expansion, about 10% (3) of the cores are dominated by expanding motions, and about 10% (3) show a significant mixture of contracting and expanding motions, which may be interpreted as oscillatory motions.
3. Most of the contracting cores tend to have more positions with negative (blue asymmetry) than positive at every radius, with more concentration of negative within 0.07 pc from peak intensity region. This implies that inward motions in contracting cores are occurring along most lines of sight, with predominance of those motions near the column density peak region of the cores.
4. Contracting cores are far more numerous for the bright cores. Above a certain peak column density () only contracting cores are seen and no oscillating, expanding, or static cores are seen. This implies that as starless cores become denser, they are more likely to contract. Above some critical value of column density all starless cores are likely to be contracting.
5. In terms of increasing column density, starless cores in different internal motions may reflect their different status of evolution: static cores in the earliest stage, expanding and/or oscillating cores in the next, and the contracting cores in the latest stage. This is consistent with a theoretical picture by Stahler & Yen (2010) where once a static cores is perturbed, the core would show expanding or oscillating motions, and would then begin prolonged contraction motions. On the other hand, we note that some starless cores have both low column density and inward motions. This may mean that these cores may not spend much time in oscillation or expansion.
References
- (1)
- (2) Aguti, E. D., Lada, C. J., Bergin, E. A., Alves, J. F., & Birkinshaw, M. 2007, ApJ, 665, 457
- (3)
- (4)
- (5) Bourke, T. L., et al. 2006, ApJ 649, L37
- (6)
- (7) Broderick, A. E., & Keto, E. 2010, ApJ, 718, 1085
- (8)
- (9) Caselli, P., Walmsley, C. M., Zucconi, A., Tafalla, M., Dore, L., & Myers, P. C. 2002, ApJ, 565, 344
- (10)
- (11) Ciolek, G. E., & Mouschovias, T. Ch. 1995, ApJ, 454, 194
- (12)
- (13)
- (14) Crapsi, A., et al. 2005, A&A, 439, 1023
- (15)
- (16) Dobashi, K., Uehara, H., Kandori, R., Sakurai, T., Kaiden, M., Umemoto, T., & Sato, F. 2005, PASJ, 57, 1
- (17)
- (18) Dunham, M. M., Crapsi, A., Evans, N. J., II, Bourke, T. L., Huard, T.L., Myers, P.C., & Kauffmann, J. 2008, ApJS, 179, 249
- (19)
- (20) Dunham, M. M., Evans, N. J., II, Bourke, T. L., Myers, P.C., Huard, T.L., & Stutz, A.M. 2010, ApJ, 721, 995
- (21)
- (22) Evans, N.J., et al. 2009, ApJS, 181, 321
- (23)
- (24) Johnstone, D., Rosolowsky, E., Tafalla, M., & Kirk, H. 2010, ApJ, 711, 655
- (25)
- (26) Lada, C. J., Bergin, E. A., Alves, J. F., & Huard, T. L. 2003, ApJ, 586, 286
- (27)
- (28) Lee, C. W., & Myers, P.C. 1999, ApJS, 123, 233
- (29)
- (30) Lee, C. W., Myers, P.C., & Plume, R. 2004, ApJS, 153, 523
- (31)
- (32) Lee, C. W., Myers, P.C., & Tafalla, M. 1999, ApJ, 526, 788
- (33)
- (34) Lee, C. W., Myers, P.C., & Tafalla, M. 2001, ApJS, 136, 703
- (35)
- (36) Leung, C. M., & Brown, R. B. 1977, ApJ, 214, L73
- (37)
- (38) Mardones, D., Myers, P. C., Tafalla, M., Wilner, D. J., Bachiller, R., & Garay, G. 1997, ApJ, 489, 71
- (39)
- (40) Myers, P. C., & Lazarian, A. 1998, ApJ, 507, L157
- (41)
- (42) Myers, P. C., Mardones, D., Tafalla, M., Williams, J. P., & Wilner, D. J. 1996, ApJ, 465, 133
- (43)
- (44) Nakano, T. 1998, ApJ, 494, 587
- (45)
- (46) Onishi, T., Mizuno, A., Kawamura, A., Ogawa, H., & Fukui, Y. 2008, ApJ, 502, 2960
- (47)
- (48) Redman, M. P., Keto, E., & Rawlings, J. M. C. 2006, MNRAS, 370, 1
- (49)
- (50) Sohn J., Lee C. W., Park Y., Lee H. M., Myers P. C., & Lee Y.. 2007, ApJ, 664 928
- (51)
- (52) Stahler, S. W., & Yen, J. J. 2010, MNRAS, 407, 2434
- (53)
- (54) Tafalla, M., Mardones, D., Myers, P. C., Caselli, P., Bachiller, R., & Benson, P. J. 1998, ApJ, 504, 900
- (55)
- (56) Tafalla, M., Myers, P. C., Caselli, P., & Walmsley, C. M. 2004, A&A, 416, 191
- (57)
- (58) Tafalla M., Santiago J., Myers P. C., Caselli P., Walmsley C. M., & Crapsi, A., 2006, A&A, 455, 577
- (59)
- (60) Ward-Thompson, D. 2002, Science, 295, 76
- (61)
- (62)
- (63) Ward-Thompson, D., Andre, P., Crutcher, R., Johnstone, D., Onishi, T., & Wilson, C. 2007, in Protostars and Planets V, ed. B. Reipurth, D. Jewitt, & K. Keil (Tucson, AZ: Univ. Arizona Press), 33
- (64)
- (65) Zhou, S. 1995, ApJ, 442, 685
- (66)
![[Uncaptioned image]](/html/1104.2950/assets/x11.png)
![[Uncaptioned image]](/html/1104.2950/assets/x12.png)
![[Uncaptioned image]](/html/1104.2950/assets/x13.png)
| Observing Line | Telescope | Observing Mode | Number of Cores | Number of Cores | Reference |
|---|---|---|---|---|---|
| 1-0 | Haystack 37m | Single pointing | 72 | 72 | 1 |
| CS 2-1 | Haystack 37m | Single pointing | 163 | 66 | 1 |
| CS 3-2 | NRAO 12m | Single pointing | 91 | 66 | 2 |
| HCN 1-0 | TRAO 14m | Single pointing | 65 | 48 | 3 |
| 1-0 | FCRAO 14m | Mapping | 35 | 35 | 4 |
| CS 2-1 | FCRAO 14m | Mapping | 50 | 34 | 4 |
| Source | R.A. | Decl. | N | ||||||||
|---|---|---|---|---|---|---|---|---|---|---|---|
| (2000) | (2000) | () | () | (pc) | |||||||
| L1333 | 02 26 13.8 | 75 27 02 | -0.09 0.05 | 1.08 0.04 | 12 | 9 | 4 | 8 | 3.0 | () | |
| L1355 | 02 53 12.2 | 68 55 52 | -0.42 0.02 | 0.51 0.04 | 12 | 3 | 1 | 11 | 1.4 | 0.05 | |
| L1498 | 04 10 51.5 | 25 09 50 | -0.60 0.04 | 1.00 0.05 | 20 | 13 | 2 | 18 | 2.8 | 0.08 | |
| L1495B | 04 18 05.1 | 28 22 22 | 0.01 0.10 | 0.69 0.06 | 7 | 5 | 3 | 4 | 1.9 | 0.03 | |
| L1495A-N | 04 15 25.5 | 28 20 15 | 0.17 0.13 | 1.50 0.07 | 29 | 25 | 15 | 14 | 4.1 | 0.11 | |
| L1495A-S | 04 15 35.6 | 28 26 35 | -0.53 0.06 | 0.78 0.04 | 26 | 19 | 1 | 25 | 2.2 | 0.14 | |
| L1400A | 04 30 56.8 | 54 52 36 | 0.12 0.06 | 0.58 0.09 | 25 | 10 | 18 | 7 | 1.6 | 0.10 | |
| TMC2 | 04 32 48.7 | 24 24 12 | -0.23 0.03 | 1.63 0.06 | 49 | 42 | 10 | 39 | 4.5 | 0.13 | |
| TMC1 | 04 41 33.0 | 25 44 44 | -0.53 0.05 | 2.49 0.06 | 42 | 29 | 3 | 39 | 6.9 | 0.15 | |
| L1507A | 04 42 38.6 | 29 43 45 | -0.08 0.13 | 0.90 0.19 | 9 | 0 | 3 | 6 | 2.5 | 0.05 | |
| CB23 | 04 43 27.7 | 29 39 11 | 0.14 0.17 | 0.90 0.21 | 4 | 0 | 2 | 2 | 2.5 | ||
| L1517B | 04 55 18.8 | 30 38 04 | 0.11 0.10 | 0.88 0.15 | 7 | 1 | 3 | 4 | 2.4 | 0.04 | |
| L1512 | 05 04 06.2 | 32 43 09 | -0.26 0.18 | 0.93 0.07 | 14 | 9 | 7 | 7 | 2.6 | 0.07 | |
| L1544 | 05 04 14.9 | 25 11 08 | -0.36 0.06 | 2.90 0.31 | 17 | 5 | 3 | 14 | 8.0 | 0.05 | |
| L1552 | 05 17 36.0 | 26 05 18 | -0.46 0.03 | 1.38 0.05 | 13 | 7 | 1 | 12 | 3.8 | 0.06 | |
| l1622A-2 | 05 54 38.8 | 01 53 44 | -0.11 0.06 | 1.85 0.10 | 17 | 15 | 4 | 13 | 5.1 | 0.27 | |
| l1622A-1 | 05 54 53.5 | 01 57 24 | 0.07 0.06 | 0.96 0.08 | 13 | 9 | 7 | 6 | 2.7 | 0.25 | |
| L134A | 15 53 33.1 | -04 35 26 | 0.43 0.14 | 1.00 0.22 | 9 | 1 | 8 | 1 | 2.8 | 0.08 | |
| L183 | 15 54 06.5 | -02 52 23 | -0.06 0.07 | 1.60 0.06 | 76 | 52 | 29 | 47 | 4.4 | 0.28 | |
| L1696A | 16 28 31.4 | -24 19 08 | 0.30 0.05 | 1.05 0.15 | 7 | 2 | 5 | 2 | 2.9 | 0.04 | |
| L1689B | 16 34 45.8 | -24 37 51 | -0.29 0.13 | 0.64 0.04 | 14 | 7 | 2 | 12 | 1.8 | 0.09 | |
| L158 | 16 47 23.2 | -13 58 37 | -0.56 0.08 | 0.55 0.07 | 13 | 4 | 1 | 12 | 1.5 | 0.07 | |
| L234E-N | 16 48 02.0 | -10 47 08 | -0.10 0.08 | 0.88 0.08 | 11 | 5 | 2 | 9 | 2.4 | 0.08 | |
| L234E-C | 16 48 02.0 | -10 49 20 | -0.55 0.07 | 0.67 0.08 | 8 | 1 | 1 | 7 | 1.9 | 0.04 | |
| L234E-S | 16 48 08.6 | -10 57 25 | -0.63 0.14 | 0.94 0.07 | 10 | 6 | 1 | 9 | 2.6 | 0.06 | |
| L492 | 18 15 46.1 | -03 46 13 | -0.35 0.21 | 1.42 0.06 | 8 | 7 | 1 | 7 | 3.9 | 0.09 | |
| L429-1 | 18 17 05.6 | -08 13 30 | 0.45 0.17 | 1.11 0.05 | 16 | 11 | 11 | 5 | 3.1 | 0.11 | |
| L694-2 | 19 41 04.5 | 10 57 02 | -0.46 0.25 | 1.67 0.07 | 12 | 7 | 1 | 11 | 4.6 | 0.09 | |
| L1155C-2 | 20 42 58.8 | 67 48 18 | -0.47 0.06 | 0.70 0.04 | 18 | 14 | 1 | 17 | 1.9 | 0.31 | |
| L1155C-1 | 20 43 30.0 | 67 52 42 | -0.48 0.08 | 0.75 0.05 | 9 | 7 | 0 | 9 | 2.1 | 0.15 | |
| L981-1 | 21 00 13.2 | 50 20 50 | -0.39 0.02 | 0.45 0.04 | 3 | 2 | 0 | 3 | 1.2 | 0.09 | |
| L1197 | 22 37 02.3 | 58 57 21 | -0.41 0.04 | 0.73 0.06 | 4 | 2 | 0 | 4 | 2.0 | 0.10 | |
| CB246 | 23 56 49.2 | 58 34 29 | 0.24 0.09 | 0.65 0.04 | 11 | 8 | 8 | 3 | 1.8 | 0.10 |