Adsorption of CO2 and CH4 and their mixtures in gas hydrates.
Abstract
We report results from grand-canonical Monte Carlo simulations of methane and carbon dioxide adsorption in structure sI gas hydrates. Simulations of pure component systems show that all methane sites are equivalent, while carbon dioxide distinguishes between two types of sites, large or small. The adsorbed mixture can be regarded as ideal, as long as only large sites are occupied. A strong preference is demonstrated for methane, when the smaller sites become filled.
The molar heat of adsorption of methane decreases with composition, while the molar heat of adsorption for carbon dioxide passes an extremum, essentially in accordance with the observation on the site sizes. The Helmholtz energies of the hydrate with CO2 -CH4 gas mixture for temperatures between 278 and 328 K and pressures between 104 and 109 Pa indicate that certain mixtures are more stable than others. The results indicate that a thermodynamic path exists for conversion of a pure methane hydrate into a pure carbon dioxide hydrate without destroying the hydrate structure.
I Introduction
Understanding the possibility to exchange CH4 with CO2 in hydrates is of great importance to the oil industry, and has been the focus of several studies Sloan2003a ; SloanHydrates ; Tegze2007 ; Baldwin2009 ; Kvamme2007a . By studying the radial distribution function of a fully occupied sI hydrate using molecular dynamic simulations, Geng et al Geng/COCH have recently suggested that a CO2 + CH4 mixture in the hydrate lattice can be more stable than a hydrate with pure components, CH4 or CO2. The present work aims to find conditions for which this is true, using Grand-Canonical Monte-Carlo simulations (GCMC) in the study of the adsorption of pure CO2 and CH4, as well as mixtures of CO2 and CH4 in an sI hydrate.
Monte-Carlo simulations of this type are excellently suited for this purpose, because they allow one to study also metastable configurations, in particular, non-fully occupied hydrates Papadimitriou2008a ; Katsumasa2007 ; Wierzchowski2007 . Molecular simulations allows one to study the conditions of hydrate formation which are complicated to work with experimentally. For a particular configuration of a hydrate with adsorbed gas(es) one can use the adsorption isotherms to obtain the Helmholtz energy, which can be used to give information about relative stabilities. GCMC simulations have been used extensively to study adsorption processes Vlugt2008 ; Karavias1991 and we shall take advantage of the method development described earlier Wierzchowski2007 ; Wierzchowski2006 .
We shall use the chlatrate sI structure, which forms at typical reservoir conditions (for example, pressures up to bar or Pa, which corresponds to reservoir depths up to 10 km SloanHydrates ). The structure, which is well established McMullan1965a , has 8 cages per unit cell. Interaction potentials for water are available through a series of systematic investigations Castillo2009 . We will use a rigid water model and the rigid framework model for all of the calculations. The typical behavior of the adsorption isotherms remain essentially unaltered when the hydrate framework model becomes mobile (and therefore is not presented here).
The Helmholtz energy difference is negative for a spontaneous process at constant volume and temperature. The process of practical interest in this study can be written schematically as the reaction
| (I.1) |
The Helmholtz energy difference per mole of formed unit cell in this reaction is denoted by . The long-term aim of the work is to obtain the values for which would decide on whether the hydrate formation is favorable or not. This paper concerns a first step in this direction. We will study the variation in the Helmholtz energy of the hydrate with a mixed gas adsorbed, , compared to a metastable hydrate with empty cages . This difference is denoted by in this paper. Since, adding a gas molecule in a cage stabilizes the hydrate, this Helmholtz energy difference will normally decrease with the loading. However, if a gas hydrate with two components adsorbed is less stable than a single component one, the variation in the Helmholtz energy would also increase with loading. The main purpose of the paper is to show this, and discuss how this process can be understood in terms of molecular behavior. The quantities and are related, but we return to the relationship and a discussion of in a subsequent paper.
The paper is organized as follows. In II we discuss the basic thermodynamic relations which allow us to calculate the Helmholtz energy and the molar heat of adsorption as a function of loading. The details of the simulations are specified in III. In IV we provide our results. We report adsorption isotherms for the single component hydrates and the mixture of CO2 and CH4 in the hydrate, as well as the selectivity data for the mixture adsorption. Furthermore, we calculate the Helmholtz energy difference of the above hydrates as a function of loading. Finally, we compare the data for the molar heat of adsorption with the structure of the hydrates. An overall discussion and conclusion are given in V.
II Thermodynamics of adsorption
II.1 Helmholtz energy
We consider the framework of water molecules in the sI clathrate structure. In simulations we can control whether this framework is flexible or rigid. In both cases we specify and keep fixed the lattice parameters of the framework, so the volume of the system is constant. We also keep the temperature of the system fixed.
The Helmholtz energy of the clathrate with given numbers of adsorbed guest molecules (a loading) is given by
| (II.1) |
Here is the pressure in the system, is the chemical potential of the -th guest component and is the number of adsorbed molecules of component , while and are the corresponding quantities for water. The number of compounds is . For pure components, , for a mixture of methane and carbon dioxide . The number of water molecules is fixed, while the number of guest molecules vary. The chemical potentials, and therefore the Helmholtz energy, depend on the loading.
We would like to calculate , the difference in the Helmholtz energy of a filled clathrate and the Helmholtz energy of the empty clathrate . We refer to this difference as the Helmholtz energy of the mixture of gases in the hydrate. It follows from II.1 that
| (II.2) |
where is the hydrostatic pressure at the given volume and loading, while is the hydrostatic pressure at the same volume and zero loading. According to the Gibbs-Duhem relation we have
| (II.3) |
Integrating the equation at a constant temperature, volume, and a constant number of water molecules from zero loading to a given loading we obtain
| (II.4) |
which, after substitution into II.2 and integration by parts, gives Wierzchowski2007
| (II.5) |
where is the specified chemical potential of each of the component. The right hand side of this expression can be easily obtained from GCMC simulations, in which one specifies the chemical potential of the adsorbing components and measures the number of adsorbed molecules. Furthermore, this form is convenient for integration, because at low loadings the slope of the function approaches zero. The integration in II.5 over the chemical potential of one component is done by keeping the chemical potentials of all other components fixed. For a two-component system this means that integration is performed first along the path of from to and then along the path from to .
The chemical potential of the -th component directly follows from its fugacity ll5 ; moranshapiro :
| (II.6) |
where the first term in II.6 is the contribution from the ideal gas. Here where is the partition function for internal degrees of freedom. If the molecules are rigid (which is the case for our simulations, see III), has contributions only from rotation of the molecule. At high temperature , where is the characteristic temperature of the rotational degrees of freedom. Furthermore, is the thermal de Brogile wavelength of component , is the molar mass, and , , , are Plank’s constant, Avogadro’s number, the universal gas constant, and Boltzman’s constant, respectively.
II.2 The heat of adsorption
The heat of adsorption of gas(es) into the hydrate at constant volume is equal to the internal energy change of the reaction (I.1) at constant volume. From the internal energy of reaction (I.1), we define the partial molar energy for adsorption of a component ;
| (II.7) |
where is the internal energy of the hydrate phase and is the corresponding value for the gas phase. For a guest molecule in the hydrate, both energies have constant contributions from the translational energy, , where is the number of degrees of freedom of the component, and these contributions cancel in the difference AdsorptionSimulations . The remaining contribution is due to the difference between the configurational parts of the internal energy and . In the literature it is common to consider the gas to be ideal, so that it acts as a reference state to an adsorbed phase Vlugt2008 ; AdsorptionSimulations . Therefore, . This defines the partial molar heat of adsorption as
| (II.8) |
In this study we are interested only in the hydrate phase. The quantity defined by II.8 is then a property of a hydrate phase with reference to an ideal gas phase. This is typical in the simulation community and conforms with the discussion in II.1, to describe the hydrate phase only Vlugt2008 . We shall use II.8 for hydrates filled with single components, and calculate the molar heat of adsorption of CH4 and CO2.
The derivative of the internal energy of the hydrate with respect to the number of adsorbed molecules can be calculated in a number of ways Vlugt2008 . In GCMC simulations, one calculates the molar heat of adsorption (II.8) from the fluctuations of the thermodynamic quantities as AdsorptionSimulations ; Karavias1991
| (II.9) |
where , and denotes an ensemble average in the grand-canonical ensemble.
III Simulation details
We perform grand-canonical Monte Carlo (VT) simulations of CH4 and CO2 in a 2x2x2 unit cell of sI hydrate, which has 64 cages, with a lattice parameter 12.03 Å McMullan1965a . The number of running cycles was varying from 500 to 500000 in order to achieve the desired accuracy. The system became equilibrated rather quickly, typically after 300-500 cycles. The number of MC moves per cycle is equal to the number of particles of each component in the system, with a minimum of 20.
In GCMC simulations one specifies the chemical potential of a component and calculates the average number of particles which correspond to this chemical potential. For this a number of Monte Carlo moves is performed, typically attempts to displace a particle from one position in the box to another and to exchange particles with the reservoir. In the semi-grand canonical MC simulations, we specify and or , and we find the loading of the guest components and accordingly the Helmholtz energy of the gas mixture in the hydrate. In our GCMC simulations the molecules were allowed to change their position and orientation. They were also subjected to Regrow, Swap, and Identity change Martin1997 MC moves. Furthermore, a series of NVT simulations has been performed to analyze the distribution of molecules between the cages. In this case the number of adsorbed molecules was specified, while the chemical potential was adjusted during the simulation. The guest molecules were allowed to change the position and orientation as well as regrow.
The oxygen positions of water molecules were taken from crystallographic data McMullan1965a . The orientation of hydrogen atoms was chosen random in accordance with the Bernal-Fowler rule BernalFowler . Initially all the hydrogen atoms were assigned randomly to each of 4 sites of the water molecule (2 sites from the hydrogens and 2 sites for the hydrogen bonds to the neighboring molecule). Then a short Monte Carlo procedure has been performed to displace the hydrogen atoms between the sites randomly, in order to satisfy 2 conditions: i) each oxygen atom has only 2 hydrogen atoms, and ii) there is only 1 hydrogen atom between each 2 oxygen atoms. The third requirement, that the number of the hydrogen atoms of the corresponding Wyckoff type is given, was satisfied automatically after the above procedure.
The water model is TIP5PEw TIP5PEW . We performed simulations with both immobile and mobile water molecules, so in the latter case they were allowed to change their position and orientation. During the simulations we have found that behavior of the system with mobile and immobile water molecules is similar, while the fluctuations were larger for the case of mobile molecules. In the analysis of the results we therefore present the data for a rigid water framework. The description of the guest molecules was taken from the TraPPE force field TRAPPE .
We performed simulations for the range of the temperature from 278 K to 328 K. The adsorption isotherms were qualitatively the same for all the temperatures in this range. We therefore focused on the temperature of 278 K.
The adsorbed components were assumed to be in equilibrium with an imaginary gas reservoir. Specifying the chemical potentials of the components in this gas determines therefore the chemical potentials of the components, adsorbed into the hydrate. This procedure is typical in the molecular simulations of adsorption FrenkelSmit . The chemical potentials of the components can be specified in two ways. First, the pressure of the gas in the reservoir and its composition can be specified. The Peng-Robinson equation of state is used to calculate the chemical potential or the fugacity of each component. This method was used to obtain single component adsorption isotherms and - diagrams for mixtures. The pressure varied in the range between 104 Pa and 109 Pa in these simulations. Second, one can specify the fugacities of the components directly using the Lewis-Randall rule moranshapiro . According to the Lewis-Randall rule, the fugacity of each component equals the product of its mole fraction and the pure component fugacity at the same temperature and pressure of the mixture. This method was used to obtain the adsorption isotherms for mixtures. This allowed us to perform the integration of II.5 along each chemical potential, keeping the chemical potentials of the other components constant. The fugacity of each of the components varied in the range between 104 Pa and 109 Pa.
IV Results of the simulations
IV.1 Single component adsorption isotherms
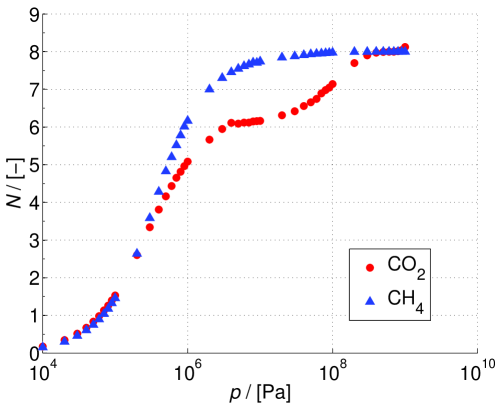
The single component adsorption isotherms for CO2 and CH4 at 278 K are shown in 1. We see how the hydrate loading, , varies with applied pressure on a sI unit cell with 8 cages. The pressure axis is given in a logarithmic scale. The error bar is less than the size of the symbol, for a hydrate with immobile water molecules. The adsorption isotherms of CO2 and CH4 for the case of mobile water molecules are also similar (not shown).
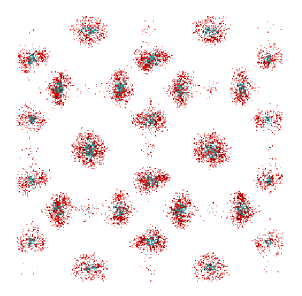
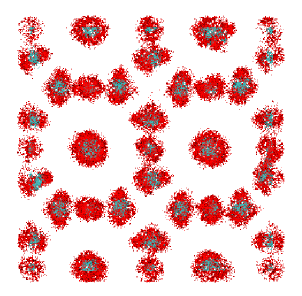
At first sight, the adsorption isotherms in 1(a) may look like Langmuir adsorption isotherms, however the fitting of the one- or two- site profiles to such isotherms is not satisfactory. Still, the CO2 isotherm reveals a two-site adsorption behavior. This can be explained by the structure of sI clathrate. A unit cell of an sI hydrate has 6 large and 2 small cages. Being a relatively large molecule, CO2 tends to occupy large cages first. Small cages start to be filled only after the large cages have been occupied. This can be also seen on 2. This figure shows the distribution of CO2 molecules between several cages, obtained from a NVT simulation. The positions of these molecules from 500 snapshots were combined and drawn on a single figure. When the loading of CO2 is small (), the loading of the large cages is much larger then the population of small cages. At intermediate loading (), which corresponds to the plateau in the CO2 adsorption isotherm, some small cages start to be filled, while the other small cages remain almost unoccupied. Finally, at high loading (), all the cages are occupied uniformly.
The cell with 2x2x2 units of sI clathrate has 64 cages. Having 66 molecules adsorbed into clathrate means that some cages contain 2 CO2 molecules. This happen at large pressures only. Double occupancy of a cage can be explained by the linear form of CO2 molecule, which allows special orientation in large cages.
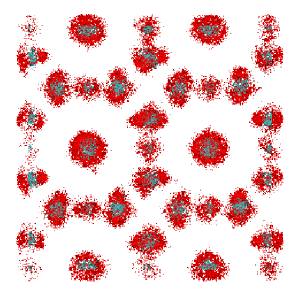
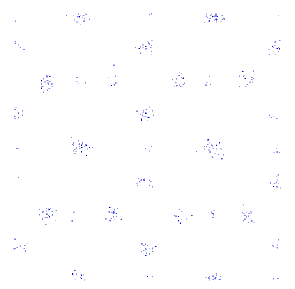
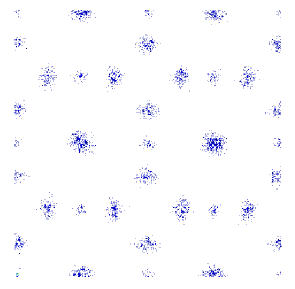
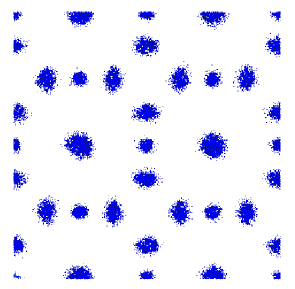
The CH4 isotherm, on the other hand, reveals a one-site adsorption behavior. The reason for this is that CH4 molecules are rather small and have almost no preference between large and small cages. However, the cage size is not completely irrelevant for the CH4 distribution: otherwise the adsorption isotherm would be a perfect single-site Langmuir curve. The typical distribution of CH4 molecules is shown on 3. The snapshots were obtained in the same way as those on 2 from VT simulations at different gas pressures. This figure shows that CH4 fills the cages uniformly showing almost no preference to large or small cages, in contrast to CO2.
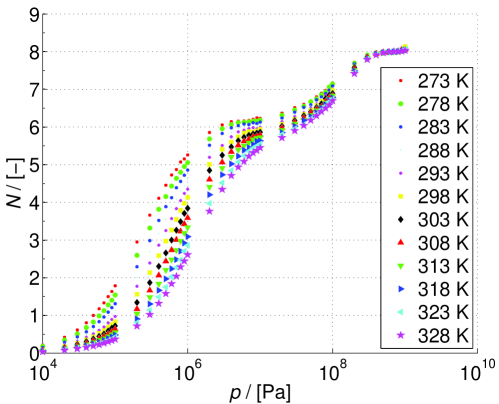
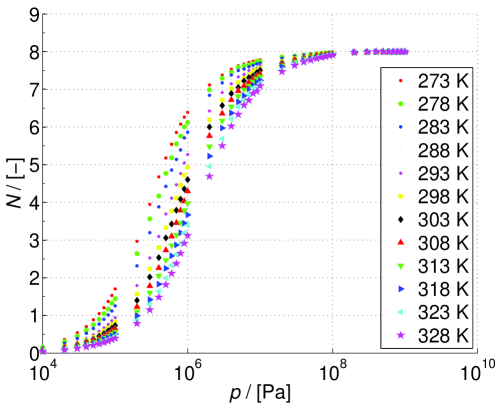
Furthermore, we computed the adsorption isotherms for different temperatures in the range between 273 K and 328 K. The results of simulations are presented on 4. One can see, that increasing the temperature leads to the decrease in the amount of adsorbed molecules both of CO2 and CH4. Nevertheless, the hydrate becomes completely filled at pressures about Pa. It is interesting to analyze the distribution of the CO2 molecules in cages with respect to the temperature. Recall that if the loading is less then 6, then mostly the large cages are being filled, while the higher loading correspond to filling also small cages. We see from 4(a) that increasing the temperature makes the isotherm to cross the line at higher pressure. Furthermore, the plateau at becomes less pronounced when the temperature is increased. This shifts the type of adsorption isotherm from 2-site to 1-site, which means that the difference between cages becomes less, when the temperature is increased. The CH4 adsorption isotherm is qualitatively the same at different temperatures. Increasing the temperature only increases the pressure at which the desired loading is achieved.
IV.2 Mixture adsorption isotherms
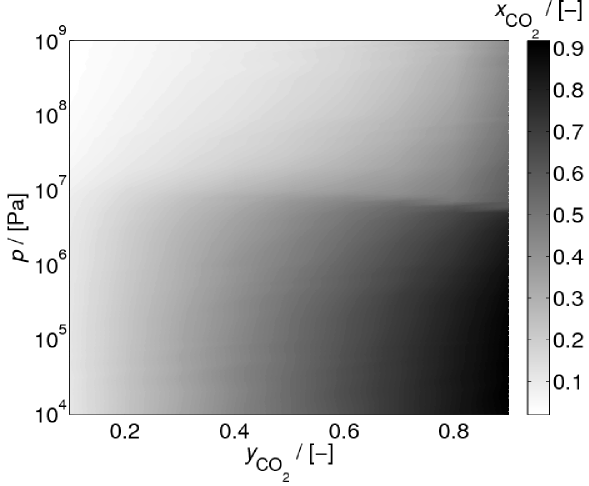
Isotherms for hydrates loaded with mixtures of CO2 and CH4 are shown in 5. This figure shows the CO2 mole fraction in the hydrate as a function of the gas pressure and the corresponding CO2 mole fraction in the gas phase. One can identify two regions in the figure, with the pressure above approximately Pa and below Pa. As one can see from 1(a) this is approximately the pressure where the adsorption isotherm of CO2 reaches the plateau. In both regions the molar content of CO2 in the hydrate increases gradually when the content of CO2 in the gas phase increases. When the pressure is below Pa the CO2 molecules fill the large cages while the CH4 molecules fill both the small and the large cages. Thus, there is no preference between large and small cages. Therefore, the mixture composition in the hydrate is approximately the same as in the gas phase over the whole range of compositions, see 6. At approximately Pa the large cages are all filled and only small cages are available. CO2 molecules cannot compete with CH4 molecules for these cages, since the former ones are larger than the latter ones. It is mostly CH4 molecules which occupy the small cages in the mixture, see 6.
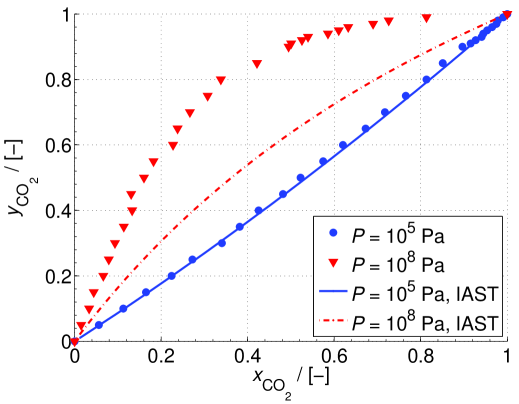
6 compares the results of the mixture loading with ideal adsorption solution theory (IAST) IAST . The concept of ideal solution for the adsorbed components is analogous to the Raoult’s law for vapor-liquid equilibrium. It holds well for mixtures of similar components which are adsorbed on similar sites. For segregated systems (when one component adsorbs on one type of sites while the other component adsorbs on the other adsorption sites) it is known that it does not work Krishna2001 ; Murthi2004 . As one can see from 6, the mixture can be considered ideal at small pressures, which are below the pressure when CO2 loading reaches the plateau. At these pressures CO2 and CH4 molecules occupy the large cages equally likely. Even though CH4 and CO2 molecules are different, the large cages are so large, that they show no preference to the components they would adsorb. At pressures larger than Pa we observe preferential adsorption for CH4 molecules, so the mixture cannot be considered ideal. At these pressures the small cages are being filled, so it is natural that they prefer small CH4 molecules rater than large CO2 molecules. It becomes clear that at high pressures IAST does not hold.
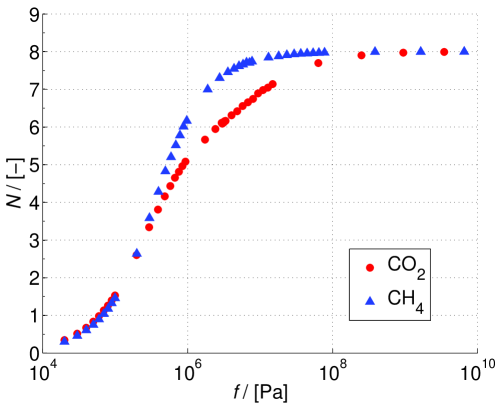
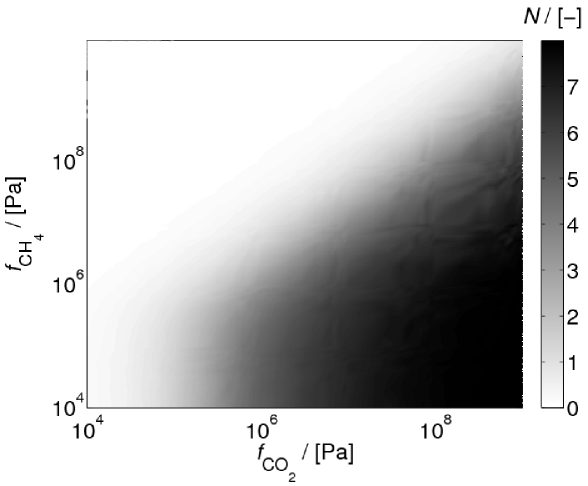
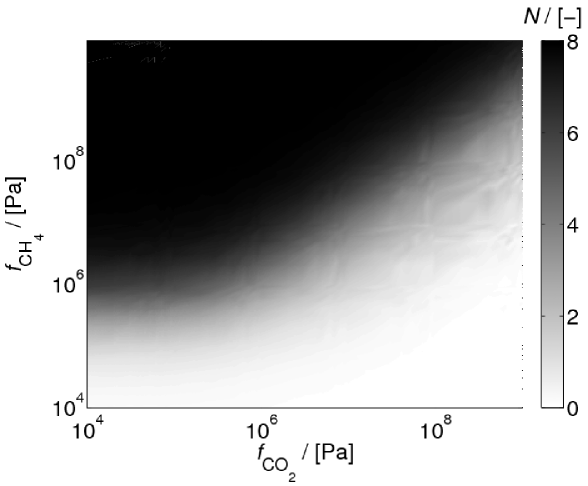
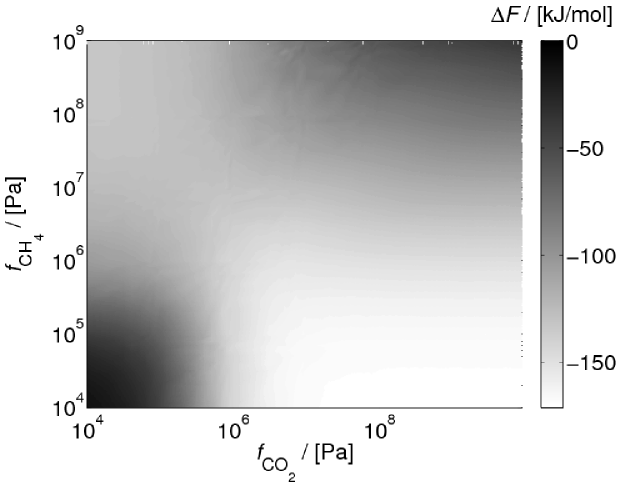
We next consider the dependence of loading on the fugacity of each of the component, which is shown on 7. We see that the loading of each of the component increases proportionally to its fugacity. Furthermore, the increase of the fugacity of one of the components complicates the adsorption of the other component and vice versa. This explains the dark triangular region in the bottom-right and the top-left corners of the figure for CO2 and CH4 respectively. Furthermore, one can see the gradual filling of the hydrate with the increase of the total fugacity which is related to the gas pressure. This behavior is consistent with the adsorption isotherms on 1(b).
IV.3 The Helmholtz energy of the pure gases and gas mixtures in hydrates
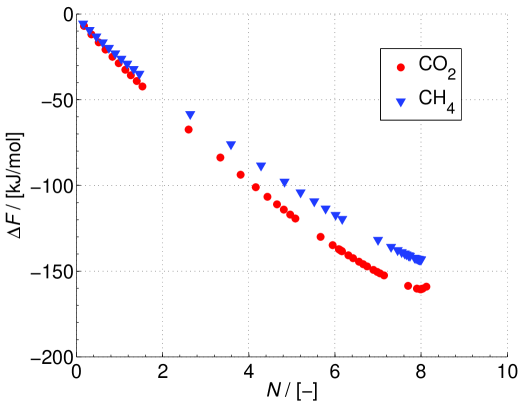
We first report the Helmholtz energy for the single component hydrates. 8 shows this Helmholtz energy for CO2 and CH4 hydrates. One can see, that the more molecules are adsorbed, the lower is the Helmholtz energy per mole. This means that the hydrate is becoming relatively more stable as the number of molecules increases. This is well known SloanHydrates , because empty cavities are not stable and guest molecules are required to stabilize them. Furthermore, one can see that the Helmholtz energy for the CO2 hydrate is lower than that of the CH4 hydrate over the whole range of loadings. This indicates that the CO2 hydrate is more stable than the CH4 hydrate.
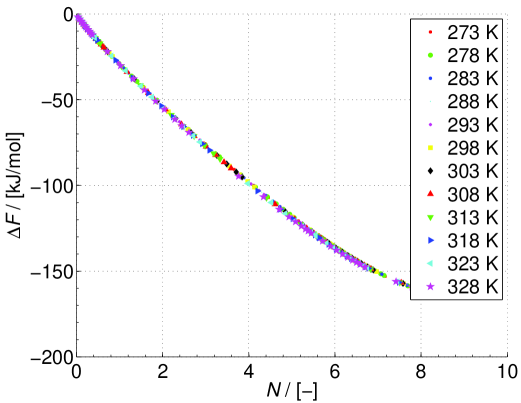
Furthermore, we consider the temperature dependence of the Helmholtz energy of a single component hydrate. The computed data in the range of temperatures between 273 K and 328 K are presented on 9. One can see, that variation of temperature does not affect the Helmholtz energy at all. This means, that the change of the entropy with respect to the change in loading is zero, . This indicates that the adsorbed molecules in different cages do not interact.
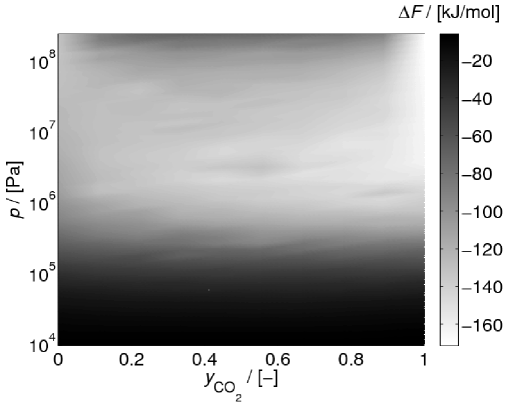
We next consider the Helmholtz energy of the gas mixtures in hydrate. 10 shows how the Helmholtz energy depends on the fugacities of each of the components. We see that there is a certain region where this energy is lowest, so the hydrate with gas mixture would be more stable at these composition. At low fugacities there are not that many molecules adsorbed, which means that many cages are empty. This makes the gas hydrate structure unstable, which explains the dark region on the figure in the bottom-left corner. If both fugacities are high, both CO2 and CH4 molecules prefer to occupy the cages. Competition for an available cage makes the hydrate structure less stable, as well. This is indicated by the dark region on the figure in the top-right corner. Finally, if only one of the two fugacities is large, while the other is low, only the high fugacity molecules tend to fill the cages and the hydrate structure becomes relatively more stable.
These considerations of stability are not conclusive, however. As explained in the introduction a more complete set of thermodynamic data is needed to evaluate the possibility of hydrate formation. Namely, the values of the Helmholtz energy of different phases which can be formed of CH4, CO2 and water are required. We shall return to this point in our next work.
It is still interesting to plot 10 in a - scale, where is the gas pressure, which is in equilibrium with the guest molecules in the hydrate, and is the mole fraction of CO2 in the gas phase. The distribution of the Helmholtz energy of the hydrate with gas mixture for this case is shown in 11. The pressure and the mole fraction were calculated from the fugacities of the components using the Lewis and Randall rule moranshapiro . We see that the hydrate is more stable at high pressures (i.e. at high loadings) if pure gas is being adsorbed. In contrast, if we have a mixture, the highest stability is achieved at moderate pressures.
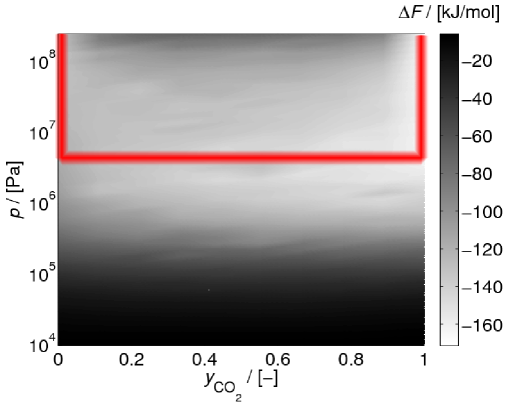
11 shows that there is a region in the pressure-composition diagram, which connects a relatively stable methane hydrate with a relatively stable carbon dioxide hydrate. While at low and high pressures the hydrate with gas mixture is unstable, it is almost as stable as either single component hydrate at moderate pressures. This is very promising, since one of the goals of our research is to find a path on a phase diagram to convert a pure CH4 hydrate into a pure CO2 hydrate without destroying its structure. In a pursuit of this path it will therefore be interesting to focus on the lightest region on the diagram. On 11 this path is drawn schematically. Note that following this path implies that one does not meet any energy barrier: the value of along it is almost everywhere constant. In contrast, going from pure CH4 hydrate to pure CO2 hydrate at constant pressure around Pa requires crossing an energy barrier of 50-100 kJ per mol of unit cell.
We see that this path goes through a region where a mixture of CH4 and CO2 is adsorbed into a hydrate. Namely, one has first to decrease the pressure of pure CH4 hydrate down to approximately Pa. At this pressure there is enough space in the large cages for CO2 molecules to go into them. Next, one has to increase the content of CO2 in the surrounding fluid. This would lead to the filling of the large cages with CO2 molecules while the CH4 molecules will be expelled out of the hydrate. When there is no CH4 in the mixture, the small cages are empty at the pressure Pa, and this is the time to start filling them in with the CO2 molecules. This is the last part of our path which ends up with a pure CO2 hydrate.
IV.4 Heats of adsorption
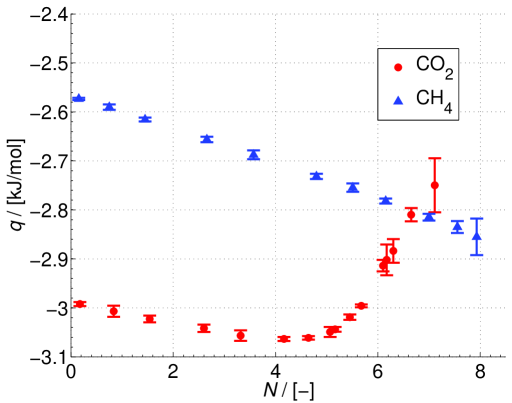
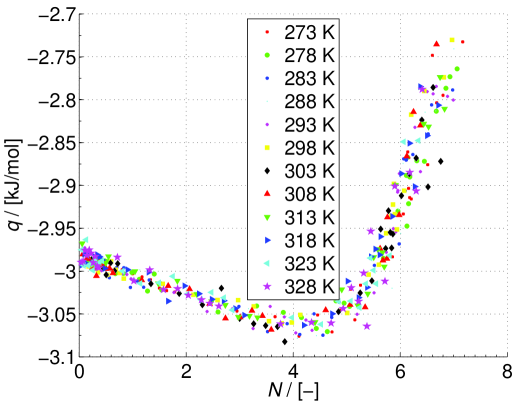
12 shows the partial molar heats of adsorption, II.9, of the single component hydrates obtained from GCMC simulations. At high loading () the calculated value of the partial molar heat of adsorption starts to fluctuate. This is expected for GCMC simulations, since in the dense phase which is realized at high loadings, the fraction of accepted trial MC moves is quite low. This means that that we shall trust the results at small and moderate loadings only (not more then 6-7 adsorbed molecules per unit cell). Both sets of data agree with the findings above.
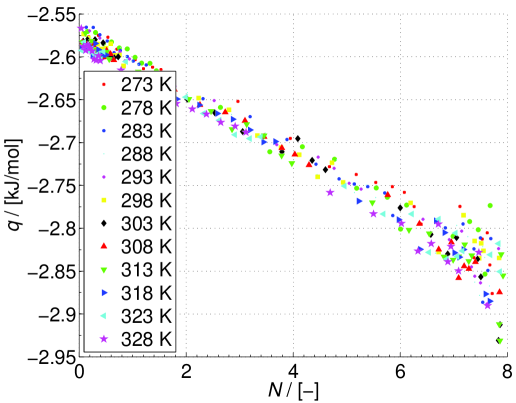
We see in 12 that the partial molar heat of adsorption of CH4 decreases almost linearly with the loading over the whole range of loadings. We also know that the change of the entropy with respect to the change in loading (see I.1) is zero. The single-site adsorption isotherm shown on 1(a) for methane can thus be explained by 12 alone. In contrast, for carbon dioxide one can distinguish the two regions for the partial molar heat of adsorption of CO2 . At small loadings the partial molar heat of adsorption decreases, similar to that for CH4. At this moment the large cages of the hydrate are being filled in. At moderate loadings the partial molar heat of adsorption has a tendency to increase, however. This corresponds to the filling of the small cages of the hydrate. As the CO2 molecules prefer not to be in the small cages, more and more energy is required to get them into hydrate at high pressures. Knowing that also here, the shape of the curve in 12 can explain the adsorption isotherm for CO2 shown on 1(a). Indeed, the profiles on 12 at small loadings are not exactly linear, which implies that the adsorption isotherm is not Langmuir-like.
The profile for CO2 in 12 changes direction not at which corresponds to the complete filling of the large cages. The minimum is when only 4-5 cages are filled in. This may be explained by a strong interactions of large asymmetric CO2 molecule with water cages Kvamme2007a .
The partial molar heat of adsorption of CO2 is lower than the one of CH4 over the whole range of loadings which can be trusted. This supports the preferential filling of the large cages by CO2 molecules.
Furthermore, we consider the temperature dependence of the partial molar heat of adsorption of a single component hydrate. The results of simulations in the range of temperatures between 273 K and 328 K are presented on 9. Within the error of simulation one can consider the partial molar heat of adsorption to be temperature independent, like the Helmholtz energy, computed in the previous section.
V Conclusions
In this paper we studied the thermodynamic properties of an sI hydrate filled with CO2, CH4 and the mixture of those. By performing grand-canonical Monte Carlo simulations, we obtained adsorption isotherms for single components and gas mixtures, partial molar heats of adsorption of single components, and the Helmholtz energy of a hydrate with the gas mixture referred to an empty hydrate.
The results show that the state of the hydrate is determined by the relation between the size of the clathrate cages and the guest molecules. The sI hydrate unit cell has two types of cages, 6 large and 2 small ones. The small methane molecules can easily fill both the large and the small cages, while the larger and not spherically symmetric molecules of carbon dioxide prefer the large cages. This determines the two regions of the hydrate state with various loading.
At a small pressure the CO2 molecules tend to fill the large cages only. Every new adsorbed molecule decreases the Helmholtz energy of the gas mixture in the hydrate so that the hydrate becomes more stable. This happens until all the large cages are occupied. Then the small cages start to be filled. While the hydrate is still becoming more stable (the Helmholtz energy is decreasing), the relative increase in stability becomes smaller.
The methane adsorption reveals almost no preference to cage type, so the partial molar heat of adsorption is always decreasing, which means that every new molecule is more welcome than the previous one. The Helmholtz energy is always decreasing, which means that the fully occupied hydrate is the most stable one comparing to a partially filled hydrate.
Furthermore, we studied the temperature dependence of the loading, the Helmholtz energy and the partial heat of adsorption. While the adsorption isotherm of single-component hydrate shifts when the temperature is changed, the dependence of the Helmholtz energy and the partial heat of adsorption on loading is unaltered by the change of the temperature. This indicates that the adsorption may be considered as ideal, i.e. the interaction between adsorbed molecules in different cages is low.
The single-component adsorption behavior determines the regime of mixture adsorption. The adsorbed mixture may be regarded as ideal, but only when the large cages are being filled. At this point there is almost no difference between the behavior of CO2 and CH4 molecules. In contrast, when small cages start to be filled, the hydrate with gas mixture reveals strong preference to CH4 adsorption.
Finally, the diagram obtained for the Helmholtz energy of the gas mixture in hydrate is promising. It may suggest a way to convert CH4 hydrates, which are excessively available at the sea bottoms, to CO2 hydrates. This could play a role for the question of CO2 storage, without destroying a hydrate. If one considers 11 as a starting point, a possible path corresponds to going from the top left corner (pure CH4 hydrate, full loading) to the top right corner (pure CO2 hydrate, full loading). In order to keep hydrate stable, i.e. to not use extra energy to destroy it, one has to go along the colored path on 11. From the kinetic point of view it may be complicated to perform an exchange of molecules in a hydrate, since, unlike zeolites, a hydrate does not have empty channels for molecules to go in. In practice, the exchange could be performed in a distorted clathrate structure Peters2008 . Existence of such a path must presently be seen as qualitative, as we are lacking information on the thermodynamic properties of the the other phases which can be in equilibrium with the hydrate phase, cf. I.1. Our further efforts are now directed into calculating the phase diagram and the remaining thermodynamic data.
VI Acknowledgment
We would like to thank Juan-Manuel Castillo Sanches for help with simulations and Bjørn Kvamme for fruitful discussions. We are also grateful to the VISTA grant #6343.

References
- [1] E. D. Sloan, Jr. Fundamental principles and applications of natural gas hydrates. Nature, 426:353–363, 2003.
- [2] Jr. E. Dendy Sloan. Clathrate hydrates of natural gases. Marcel Dekker, Inc., 2nd edition, 1998.
- [3] G. Tegze, L. Gránásy, and B. Kvamme. Phase field modelling of CH4 hydrate conversion into CO2 hydrate in the presence of liquid CO2. Phys. Chem. Chem. Phys., 9:3104–3111, 2007.
- [4] Bernard A. Baldwin, Jim Stevens, James J.Howard, Arne GRaue, Bjørn Kvamme, Erick Aspens, Geir Ersland, Jarle Husebø, and David R. Zornes. Using magnetic resonance imaging to monitor CH4 hydrate formation and spontaneous conversion of CH4 hydrate to CO2 hydrate in porous media. Magnetic Resonance Imaging, 27:720–726, 2009.
- [5] B. Kvamme, A.Graue, T. Buanes, T. Kuznetsova, and G. Ersland. Storage of CO2 in natural gas hydrate reservoirs and the effect of hydrate as an extra sealing in cold aquifers. Int. J. of Greenhouse Gas Control, 1:236–246, 2007.
- [6] Chun-Yu Geng, Hao Wen, and Han Zhou. Molecular simulation of the potential of methane reoccupation during the replacement of methane hydrate by co2. J. Phys. Chem. A, 113:5463–5469, 2009.
- [7] N. I. Papadimitriou, I. N. Tsimpanogiannis, A.Th. Papaioannou, and A. K. Stubos. Monte carlo study of sII and sH argon hydrates with multiple occupancy of cages. Molecular Simulation, 34:1311–1320, 2008.
- [8] Keisuke Katsumasa, Kenichiro Koga, and Hideki Tanaka. On the thermodynamic stability of hydrogen clathrate hydrates. The Journal of Chemical Physics, 127:044509, 2007.
- [9] S. J. Wierzchowski and P. A. Monson. Calculation of free energies and chemical potentials for gas hydrates using monte carlo simulations. J. Phys. Chem. B, 111:7274–7282, 2007.
- [10] T. J. H. Vlugt, E. García-Pérez, D. Dubbeldam, S. Ban, and S. Calero. Computing the heat of adsorption using molecular simulations: The effect of strong coulombic interactions. Juornal of Chemical Theory and Computation, 4:1107–1118, 2008.
- [11] F. Karavias and A.L. Myers. Isosteric heats of multicomponent adsorption: Thermodynamics and computer simulations. Langmuir, 7:3118–3126, 1991.
- [12] S. J. Wierzchowski and P. A. Monson. Calculating the phase behavior of gas-hydrate-forming systems from molecular models. Ind. Eng. Chem. Res., 45:424–431, 2006.
- [13] Richard K. McMullan and G. A. Jeffrey. Polyhedral Clathrate Structures. IX. Structure of Ethylene Oxide Hydrate. The Journal of Chemical Physics, 42(8):2725–2732, 1965.
- [14] J. M. Castillo, D. Dubbeldam, T. J. H. Vlugt, B. Smit, and S. Calero. Evaluation of various water models for simulation of adsorption in hydrophobic zeolites. Molecular Simulation, 35:1067–1076, 2009.
- [15] L. D. Landau and E. M. Lifshitz. Statistical Physics. Course of theoretical physics 5. Pergamon Press, 3rd english edition, 1986.
- [16] Micael J. Moran and Howard N. Shapiro. Fundamentals of Engineering Thermodynamics. John Willey & Sons, Inc., 5th edition, 2006.
- [17] D. Nicholson and N.G. Parsonage. Computer Simulations and the Statistical Mechanics of Adsorption. Academic Press, New York, 2nd edition, 1982.
- [18] Marcus G. Martin and J. Ilja Siepmann. Predicting multicomponent phase equilibria and free energies of transfer for alkanes by molecular simulation. J. Am. Chem. Soc., 119 (38):8921 8924, 1997.
- [19] Bernal J. D. and Fowler R. H. J. Chem. Phys., 1:515, 1933.
- [20] S. W. Rick. J. Chem. Phys., 120:6085, 2004.
- [21] J. J. Potoff and J. I. Siepmann. A.I.Ch.E J., 47:1676, 2001.
- [22] Daan Frenkel and Berend Smit. Understanding Molecular Simulation. From Algorithms to Applications. Academic Press, New York, 2nd edition, 2002.
- [23] A. L. Myers and J. M. Prausnitz. Thermodynamics of mixed-gas adsorption. A.I.Ch.E. J., 11:121, 1965.
- [24] R. Krishna and D. Paschek. Molecular simulations of adsorption and siting of light alkanes in silicalite-1. Phys. Chem. Chem. Phys., 3:453–462, 2001.
- [25] Manohar Murthi and Randall Q. Snurr. Effects of molecular siting and adsorbent heterogeneity on the ideality of adsorption equilibria. Langmuir, 20:2489–2497, 2004.
- [26] Baron Peters, Nils E. R. Zimmermann, Gregg T. Beckham, Jefferson W. Tester, and Bernhardt L. Trout. Path sampling calculation of methane diffusivity in natural gas hydrates from a water-vacancy assisted mechanism. J. Am. Chem. Soc., 130:17342–17350, 2008.