New Measurement of the Scintillation Efficiency of Low-Energy Nuclear Recoils in Liquid Xenon
Abstract
Particle detectors that use liquid xenon (LXe) as detection medium are among the leading technologies in the search for dark matter weakly interacting massive particles (WIMPs). A key enabling element has been the low-energy detection threshold for recoiling nuclei produced by the interaction of WIMPs in LXe targets. In these detectors, the nuclear recoil energy scale is based on the LXe scintillation signal and thus requires knowledge of the relative scintillation efficiency of nuclear recoils, . The uncertainty in at low energies is the largest systematic uncertainty in the reported results from LXe WIMP searches at low masses. In the context of the XENON Dark Matter project, a new LXe scintillation detector has been designed and built specifically for the measurement of at low energies, with an emphasis on maximizing the scintillation light detection efficiency to obtain the lowest possible energy threshold. We report new measurements of at low energies performed with this detector. Our results suggest a which slowly decreases with decreasing energy, from at 15 keV down to at 3 keV.
pacs:
95.35.+d, 14.80.Ly, 29.40.-n, 95.55.VjI Introduction
In recent years, liquid xenon (LXe) particle detectors Angle et al. (2008); Aprile et al. (2010); Alner et al. (2007); Lebedenko et al. (2009a); Minamino (2010) have achieved a large increase in target mass and a simultaneous reduction in backgrounds and are now among the leading technologies in the search for dark matter weakly interacting massive particles (WIMPs). The XENON100 experiment, with a target mass of 62 kg and a measured electronic recoil background of Aprile et al. (2011a) is currently the most sensitive dark matter search in operation. Key to the performance of XENON100 and of future experiments based on the same principle, is the ability to detect low-energy recoiling nuclei in LXe. Since WIMPs are expected to interact primarily with atomic nuclei, the nuclear recoil energy scale is based on the LXe direct scintillation signal and thus requires knowledge of the scintillation yield of nuclear recoils. The uncertainty in the nuclear recoil energy scale at low energies is the largest systematic uncertainty in the reported results from LXe WIMP searchesAprile et al. (2010, 2011b).
The scintillation yield, defined as the number of photons produced per unit energy, depends on the type of particle as well as the energy Lindhard and Scharff (1961); Hitachi (2005). Since a precise measurement of the absolute scintillation yield is rather difficult, the relative scintillation efficiency of nuclear recoils, , is the quantity that is used to convert the scintillation signals of LXe dark matter detectors in nuclear recoil energies. is defined as the ratio of the scintillation yield of nuclear recoils to that of electronic recoils from photoabsorbed 122 keV rays from a source, at zero electric field. The scintillation yield of electronic recoils is also an energy-dependent quantity Barabanov et al. (1987), but the 122 keV rays provide a reference with which scintillation yields at other energies or of other particles can be compared.
Two methods have been used to measure at different energies, an indirect method with the full spectrum comparison of the simulated response to the measured response from the irradiation with a neutron source, and a direct method with monoenergetic neutron fixed-angle scatters.
Indirect measurements Sorensen et al. (2009); Lebedenko et al. (2009b) infer the energy dependence of by comparing experimental data obtained with a neutron source and a Monte Carlo simulation of the expected nuclear recoil energy spectrum. In this way, any neglected factors will be absorbed in the energy dependence of . Such factors can include uncertainties in the energy spectrum of the neutron source, efficiency losses near threshold, energy dependence of selection cuts, etc, and are typically difficult to measure precisely.
Direct measurements Arneodo et al. (2000); Bernabei et al. (2001); Akimov et al. (2002); Aprile et al. (2005); Chepel et al. (2006); Aprile et al. (2009); Manzur et al. (2010) are performed by recording fixed-angle elastic scatters of monoenergetic neutrons tagged by organic liquid scintillator detectors. The recoil energy of the Xe nucleus is then entirely fixed by kinematics and approximately given by
| (1) |
where is the energy of the incoming neutron, and are the masses of the neutron and Xe nucleus, respectively, and is the scattering angle. The spread in measured recoil energies mostly comes from the energy spread of the neutron source and the angular acceptance of the LXe and neutron detectors due to their finite sizes.
Since the start of the XENON dark matter project, our group has already performed two direct measurements of . In this article we report results from a new measurement of this quantity, with an improved apparatus and elaborated control of systematic uncertainties. These are the most accurate measurements of in LXe to-date, down to 3 keV recoil energy.
II Experimental Setup
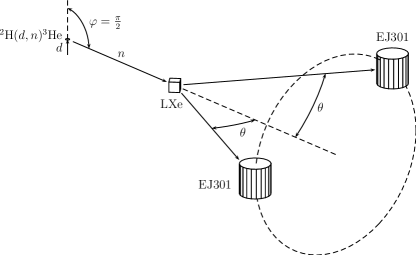
The measurement of was carried out by irradiating a LXe detector with approximately monoenergetic neutrons produced by a sealed-tube neutron generator 111Neutron generator provided by Schlumberger Princeton Technology Center, 20 Wallace Road, Princeton Jct., New Jersey 08550 and placing two organic liquid scintillator detectors at different azimuthally symmetric positions with respect to the neutron generator-LXe detector axis, see Fig. 1.
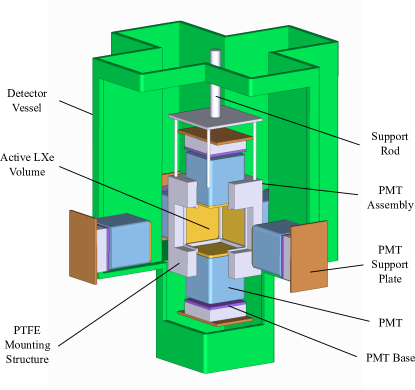
The emphasis for the design of the LXe detector has been placed on the reduction of non-active LXe and other materials in the immediate vicinity of the active LXe volume, and on the maximization of the scintillation light detection efficiency. The active LXe volume is a cube with sides of length viewed by six Hamamatsu R8520-406 Sel photomultiplier tubes (PMTs), the same type as used in the XENON100 experiment Aprile et al. (2010) but selected for high quantum efficiency (QE). The PMTs have a special Bialkali photocathode for low temperature operation down to and have an average room temperature QE of 32% 222Measured QE values for all six PMTs provided by Hamamatsu. at 178 nm, the wavelength at which Xe scintillates. The PMTs are operated with positive high voltage bias so that the PMT metal body and photocathode are at ground potential. This ensures that the active volume remains at zero electric field. This is a prerequisite to this measurement, since is defined as the relative scintillation efficiency of nuclear recoils at zero field. A polytetrafluoroethylene (PTFE) frame serves as a mounting structure and alignment guide for the PMTs so that each PMT window covers a side of the cubic active volume. The PMT assembly is housed in a stainless steel detector vessel, surrounded by a vacuum cryostat. The detector vessel has a special cross shape that closely follows the contours of the PMT assembly to minimize the probability that neutrons scatter before or after an interaction in the active volume. The PTFE mounting structure is suspended from the top by a stainless steel rod fixed to a linear displacement motion feedthrough. The motion feedthrough allows the adjustment of the vertical position of the assembly from the outside. A schematic of the detector is shown in Fig. 2.
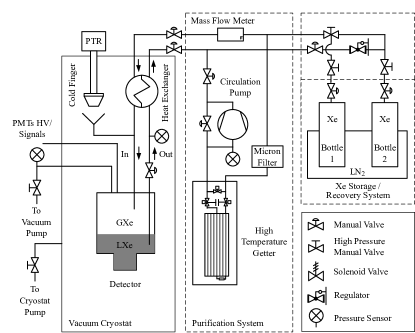
A schematic of the gas handling, liquefaction and re-circulation system developed for this experiment is shown in Fig. 3. The Xe is purified in the gas phase by circulating it through a hot getter and re-liquified efficiently using a heat exchanger Giboni et al. (2011). The LXe temperature is kept constant with an Iwatani PDC08 pulse tube refrigerator (PTR) delivering 24 W of cooling power at 165 K with an air-cooled 1.5 kW helium compressor. Thanks to the PTR stability and low maintenance, the cooling system developed for this detector has enabled us to acquire data over a two month long, uninterrupted run. During the measurements, the LXe temperature was maintained at which corresponds to a vapor pressure of . Further details on the design and performance of the cooling system developed for this experiment are presented in Ref. Giboni et al. (2011).
Neutrons with an average energy of 2.5 MeV were produced via the reaction in a compact sealed-tube neutron generator provided by Schlumberger. The generator was operated at deuteron energies of 60, 65, 75, or 80 keV and with deuterium beam currents ranging from 60 to . The target is a self-regenerating titanium deuteride (TiD) thick target.
For non-relativistic deuterons (), the energy of neutrons emitted in the reaction is given by Csikai (1987):
| (2) |
where and are the deuteron and nucleus masses, respectively, is the -value of the reaction, and is the neutron emission angle. At small and large emission angles the neutron energy depends significantly on the deuteron energy. However, there is a minimum in both and at , and consequently the energy spread of neutrons produced is minimal near this angle. For this reason, the neutron generator was operated in a configuration where deuterons are accelerated vertically and where the neutrons incident on the LXe detector are those produced at (see Fig. 1).
The expected neutron yield from the generator can be computed from its operating conditions, specifically the deuteron energy, , the deuterium beam current, and the monoatomic/diatomic deuterium beam composition. Since deuterons are stopped in the target, the neutron angular yield is calculated from
| (3) |
with
| (4) |
and the neutron energy distribution at angle from
| (5) |
with
| (6) |
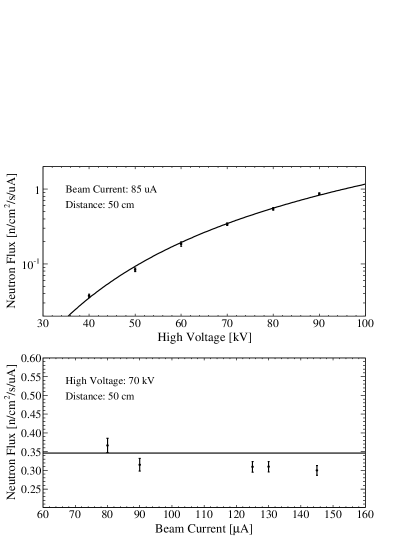
where is the incident deuteron flux, the number density of deuterium atoms in the target and its density, is the differential cross-section, the deuteron stopping power of the target, and / the monoatomic/diatomic beam fractions. The neutron production cross-section is taken from the ENDF/B-VII.0 database Chadwick et al. (2006), the stopping power for protons from the PSTAR database 333http://physics.nist.gov/PhysRefData/Star/Text/PSTAR.html, and the monoatomic/diatomic deuterium beam fraction is taken as 0.05/0.95 444Andrew Bazarko (personal communication, 2010). The result of the computation is shown in Fig. 4.
Measurements of the neutron flux were also carried out using a Nuclear Research Corporation NP-2 portable neutron monitor. The NP-2 neutron monitor is a boron trifluoride proportional counter surrounded by a low density polyethylene cylinder to moderate the neutron flux before capture by boron. Its accuracy is . The result of the computation show remarkable agreement with the measurement as a function of applied high voltage (maximum deuteron energy). The agreement with the measurement as a function of beam current is also good but worsens as the beam current increases. This effect is expected since, as the measured beam current increases, a larger fraction of it can be due to electronic leakage current instead of deuterium current. The energy spread of neutrons is assumed to be dominated by the energy loss of deuterons in the target and by neutrons produced at different angles that scatter back into the LXe detector direction.
The organic liquid scintillator neutron detectors used in this measurement are 3 inch diameter Eljen Technologies M510 detector assemblies filled with EJ301 555EJ301 is the commercial name used for . It is indentical to the more commonly known proprietary names of NE213 and BC501A.. The liquid scintillator is encapsulated in an aluminium cylindrical container, coupled to a 3 inch ET Enterprises 9821B PMT. EJ301 is especially adapted to fast neutron detection in the presence of radiation due to its excellent pulse shape discrimination (PSD) characteristics.
The alignment of the LXe detector and the neutron generator was performed with an auto-levelling laser mounted on a tripod. The horizontal line and the vertical line projected by the laser were used to set the height of the neutron generator target to the center of the LXe detector and to mark the position of both on the laboratory floor. The laser was also used to align the two EJ301 neutron detectors with respect to the LXe detector. For each angle, the distance between the LXe detector and the two EJ301 neutron detectors was chosen to produce a recoil energy spectrum with a spread due to the angular acceptance of the cell of 10% to 20%. The desired EJ301 neutron detector positions were marked on the floor using 1.5 m aluminium rules, while their height was set with the help of the laser and a vertical rule. The EJ301 neutron detectors were supported at the desired positions around the LXe detector by their own laboratory stands.
The horizontal distance between the neutron generator and the LXe detector was fixed at . The distance from the LXe detector to the EJ301 liquid scintillators varied from , for the scattering angles corresponding to low-energy recoils, to , for the scattering angles corresponding to higher energies. The positioning accuracy of the EJ301 neutron detectors is estimated to be better than .
The data acquisition electronics are largely the same as those of the XENON100 experiment. The signals from the six LXe PMTs are fed into a Phillips 776 amplifier with two amplified outputs per channel. The first output of each channel is digitized by a 14-bit CAEN V1724 100 MS/s flash ADC with 40 MHz bandwidth while the second output is fed to a Phillips 706 leading edge discriminator. The discriminator thresholds are set at a level of -15 mV, which corresponds to 0.5 photoelectrons (pe). The logic signals of the six discriminator outputs are added with a linear fan-in and discriminated to obtain a 2-fold PMT coincidence condition. The 2-fold PMT coincidence logic signal is passed to a holdoff circuit to prevent re-triggering on the tail of the LXe scintillation signal and constitutes the LXe trigger.
The signals from the two EJ301 PMTs are also fed into the amplifier, with one output digitized by the flash ADC unit, and the other output discriminated. However, since we do not expect a signal for both EJ301 PMTs in the same event, the two signals are multiplexed into a single channel before digitization. The two discriminator outputs are delayed and also digitized to serve as a demultiplexing code. A copy of the discriminator outputs is combined into an OR gate and forms the EJ301 trigger.
The neutron time-of-flight (TOF) is measured with an Ortec 566 time to amplitude converter (TAC), where the LXe trigger is used as the “start” signal and a delayed copy of the EJ301 trigger as the “stop” signal. The delay of the copy of the EJ301 trigger signal can be varied to calibrate the TOF measurement. The TAC output signal is also digitized by the flash ADC unit and the TOF is computed by the event processing program.
Finally, for neutron scattering measurements, the trigger is taken as a coincidence within a 200 ns window of the LXe trigger and the EJ301 trigger. The low-energy roll-off of the trigger efficiency can contribute significantly Manalaysay (2010) to the systematic uncertainty on , if it is not properly understood. As an improvement over previous measurements of , where the efficiency was based solely on simulations, the efficiency of the trigger setup described above was measured in addition to its simulation. The efficiency measurement was done using a source (a emitter) placed between the LXe detector and a sodium iodide NaI(Tl) detector. The back-to-back pair of 511 keV rays from the annihilation interact effectively at the same time in the LXe and the NaI(Tl) detectors. The NaI(Tl) detector was positioned such that the solid angle it subtended at the source was larger than the one subtended by the active LXe volume. This ensures that the whole active volume of the LXe detector is probed. For this measurement, the triggering signal consisted of the discriminated signal of the output of the NaI(Tl) detector. In addition to the signals of the LXe PMTs, the trigger signal of the normal LXe trigger was digitized with the flash ADC. The efficiency is inferred by computing the fraction of events accompanied by a LXe trigger signal as a function of their measured number of photoelectrons. Fig. 5 shows the resulting trigger efficiency.
The expected efficiency has also been computed via a detailed Monte Carlo simulation. The simulation takes into account the spatial distribution of the light collection efficiency within the active LXe volume, PMT quantum efficiencies, PMT first dynode collection efficiencies, PMT gains, variations in the single photoelectron pulse height distribution, and discriminator trigger thresholds. The result is also shown in Fig. 5. The discrepancy between the simulated and measured efficiencies is attributed to the limited accuracy in modelling hardware components of the trigger. Consequently, the measured trigger efficiency is used to extract (Sec. III.5) from the neutron scattering measurements. In effect, this discrepancy only stresses the need to perform a measurement of the trigger efficiency instead of relying solely on simulation.

III Data Analysis
III.1 Calibration
The LXe PMT gains were measured under single photoelectron conditions with a pulsed blue light emitting diode (LED), embedded in the PTFE mounting structure. The gains were equalized to a mean value of by adjusting the individual PMT anode bias voltages at the beginning of the experiment and were monitored regularly throughout. At the operating conditions chosen, the single photoelectron resolution of the LXe PMTs has a mean value of .
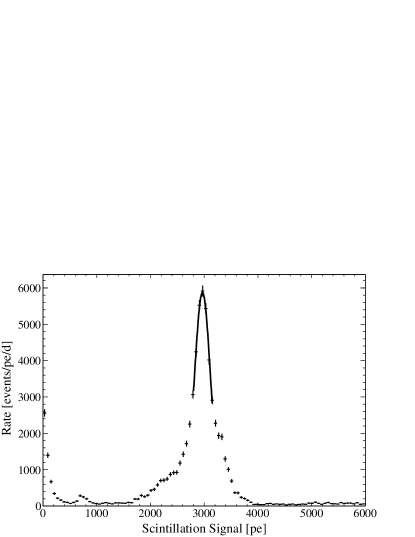
The electronic recoil energy scale is calibrated using 122 keV rays since is defined as the scintillation light yield of nuclear recoils relative to the yield of rays of that energy. Calibrations with an external source were taken regularly throughout the duration of the experiment. Fig. 6 shows the scintillation spectrum of a calibration with the source. The scintillation light yield was measured to be with a resolution of 5%. This very high light yield, combined with the 90% trigger efficiency at 7 pe, implies that energy spectra do not suffer from efficiency losses down to energies as low as 0.3 keVee.
Since the attenuation length of 122 keV rays in LXe is Berger et al. the external source mostly probes the light yield in the outer layers of the active volume. However, since the elastic scattering mean free path of 2.5 MeV neutrons in LXe is , the expected spatial distribution of nuclear recoils is uniform. Hence, the quantity of interest is the average light yield over the whole volume. The spatial uniformity of the light collection has been investigated using a light propagation simulation that takes into account the detailed geometry of the active volume, the photocathode coverage of the PMTs, and the reflectivity of PTFE. The relative light yield variation over the active volume was calculated to be less than 2%, with a maximum variation of 5% near the edge.
The TOF calibration was performed with the source placed between the LXe detector and the EJ301 neutron detectors. The two emitted 511 keV rays emitted interact in both detectors and give a calibration point. The time delay between the LXe and EJ301 triggers was varied with a delay generator over a range of 32 ns to obtain the TOF calibration.
III.2 Data Processing, Selection
Events consist of the six LXe PMT waveforms, the waveform of the triggered EJ301 neutron detector, as well as the waveform of the TAC output. For each event, the processing software searches the LXe PMT waveforms for scintillation signals and records several parameters for each pulse found: position, area, height, etc. The same procedure is applied to the EJ301 neutron detector waveform. In addition, a PSD parameter is defined as the fraction of the total EJ301 scintillation signal contained within the tail of the pulse. The tail of the pulse is defined as a region with a lower boundary at 30 ns after the pulse peak and an upper boundary at the time where the pulse returns to 1% of the peak amplitude. Finally, the TOF is computed from the height of the TAC ouput and the TOF calibration values. For a LXe detector and EJ301 neutron detector distance of 1 m, the the typical neutron TOF is 45 ns.
Three selection cuts are applied to the data: a PSD cut to select neutron interactions in the EJ301 neutron detectors, a lower energy threshold cut on the EJ301 scintillation signal, and a TOF cut.
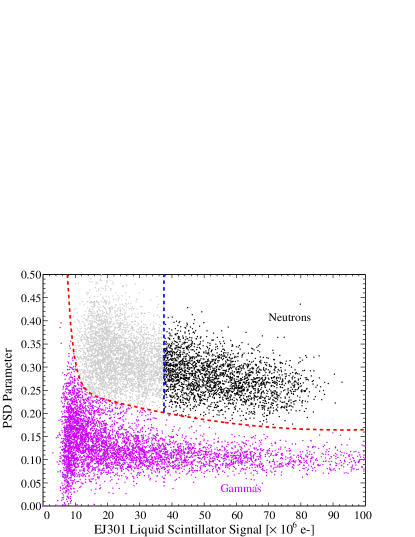
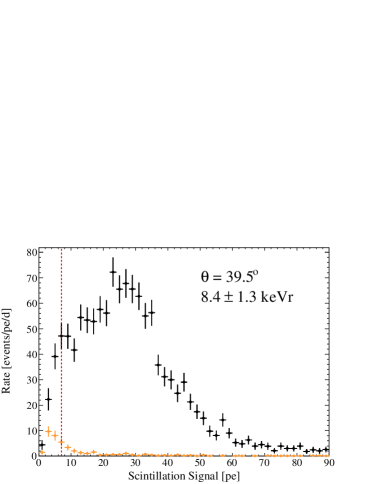
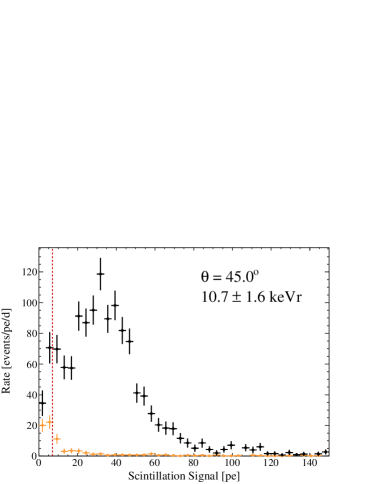
The PSD cut uses the /n discrimination capabilities of the EJ301 liquid scintillator and allows the selection of neutron interactions in the EJ301 with high efficiency. However, since this cut is based on the scintillation signal, the discrimination power degrades with decreasing energy and it is preferable to apply an energy threshold cut on the EJ301 scintillation signal. This reduces the background from neutrons that scattered in other materials, in addition to the scatter in the LXe detector, since the neutron energy was reduced and hence cannot deposit the maximum energy expected. Fig. 7 shows the events selected by the combination of the PSD cut and the EJ301 energy threshold cut for one of the two EJ301 neutron detectors.
A subtle effect can be observed in the TOF calibration data. Since the LXe trigger comes from the coincidence of two LXe scintillation photons, the LXe scintillation light decay time systematically shifts the TOF measurement of scintillation signals with fewer photons to lower TOF values. The effect is more pronounced for rays interacting in LXe due to the slower recombination time for electron recoils. The TOF value is corrected for this effect in the event processing software. However, the correction does not eliminate the spread in values due to this effect. To eliminate any possible bias, we chose TOF cuts that contain the full neutron TOF peak for each scattering angle measurement, even if this results in a higher contamination of the recoil spectrum by neutrons that scattered in other materials.
III.3 Measured Recoil Distributions
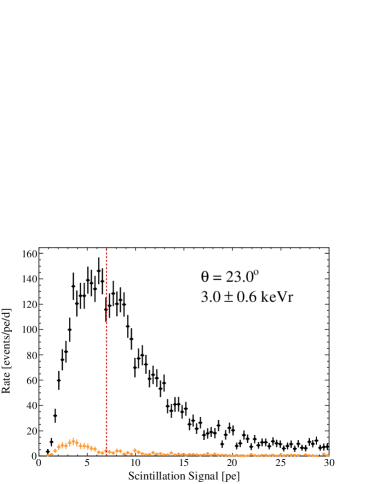
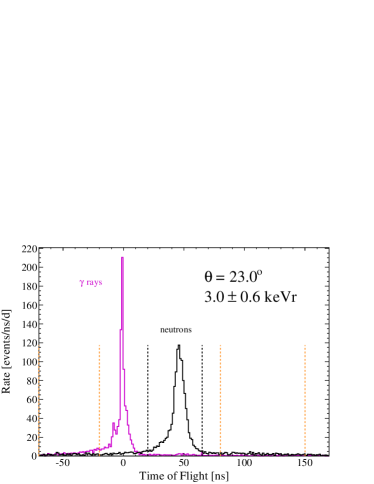
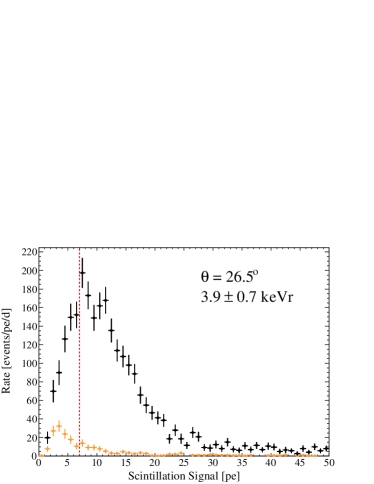
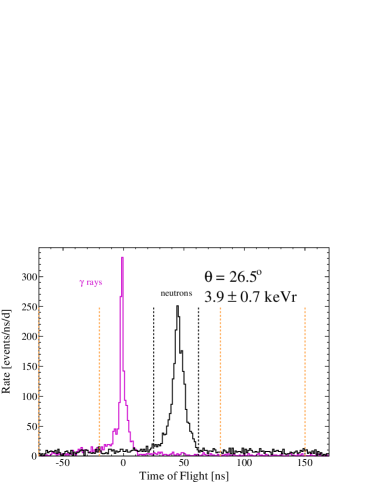
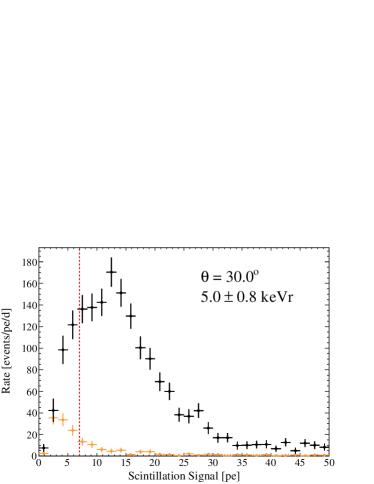
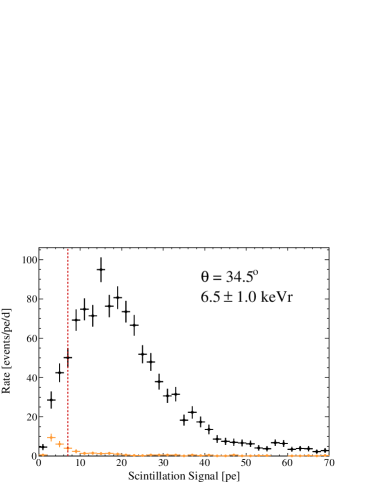
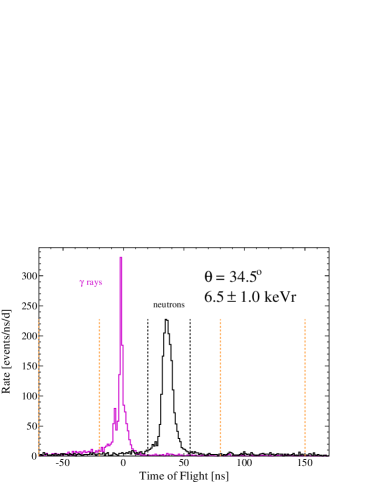
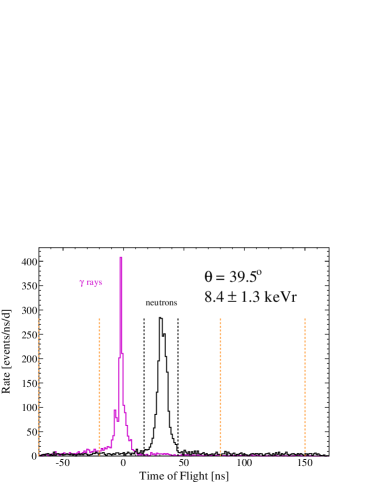
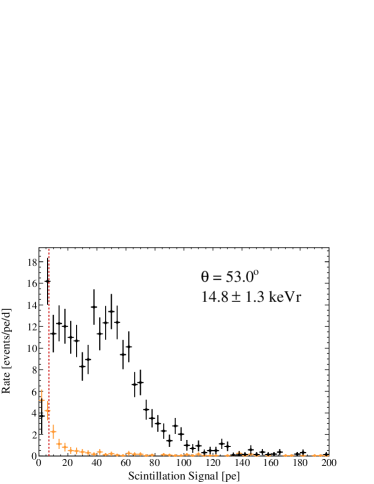
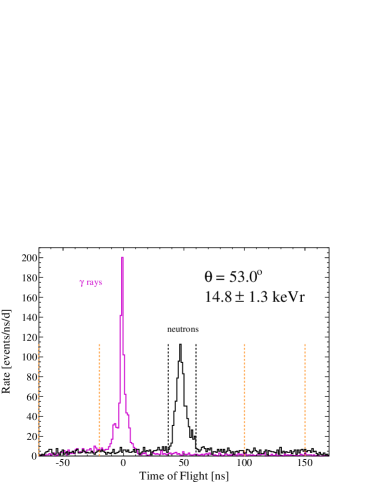
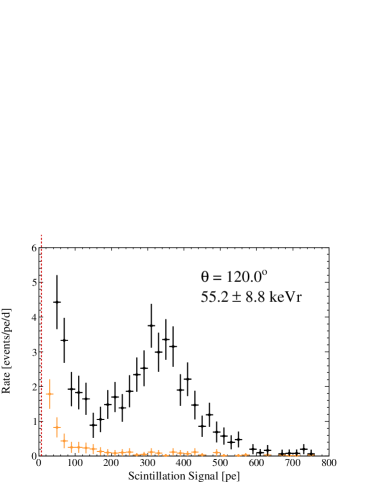
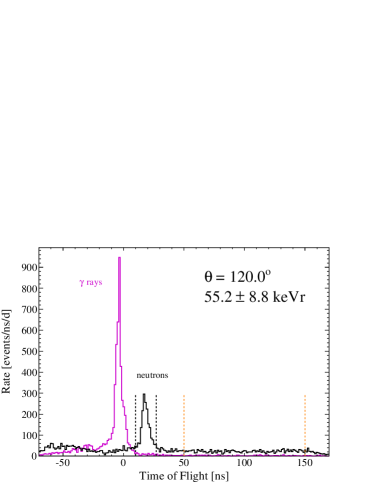
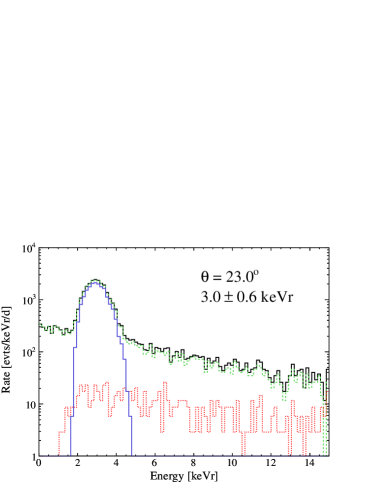
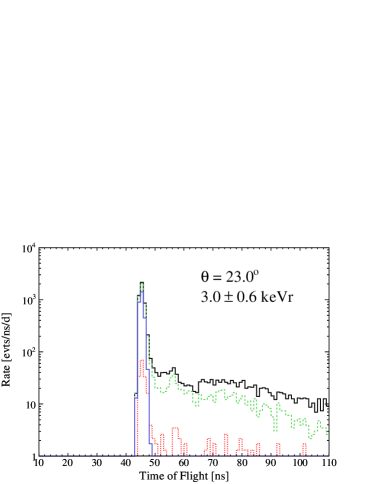
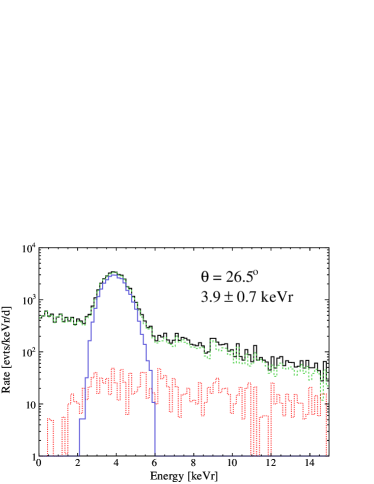
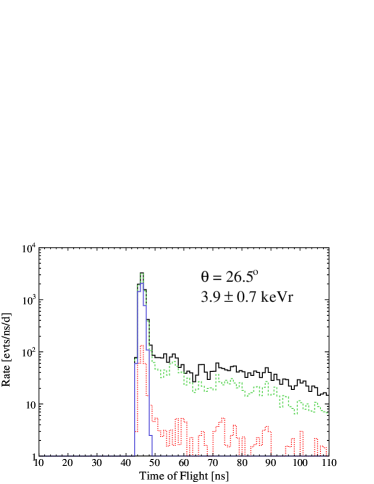
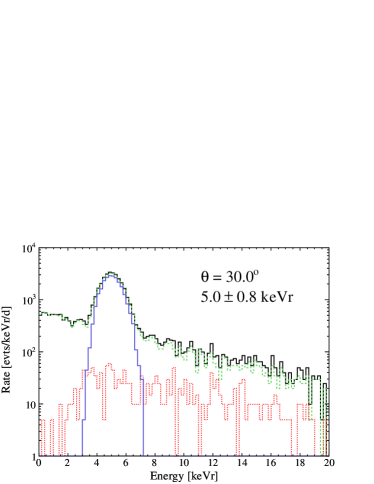
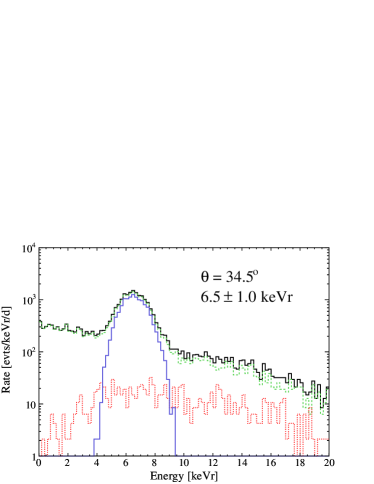
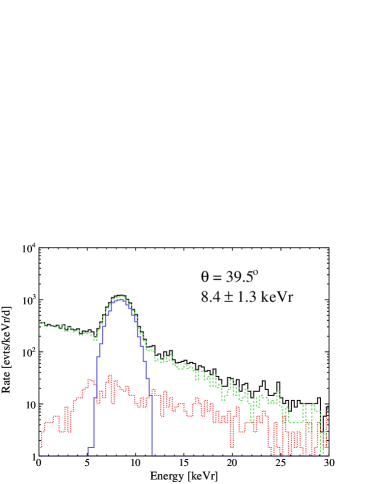
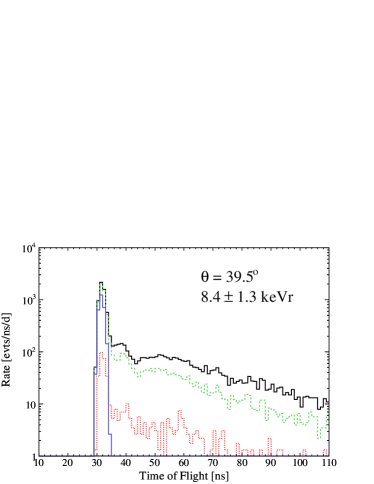
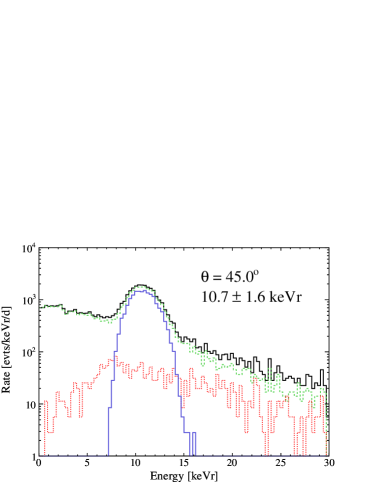
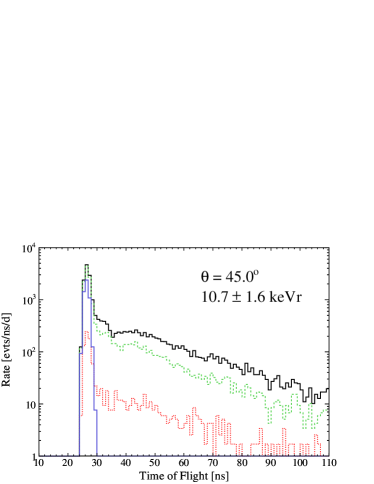
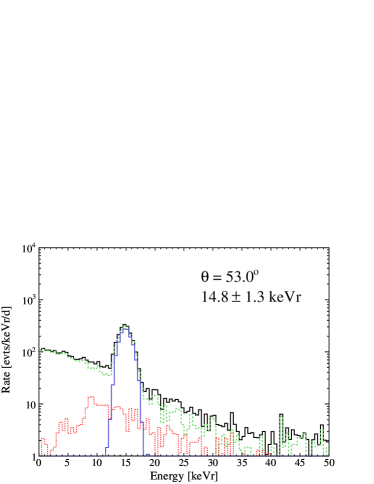
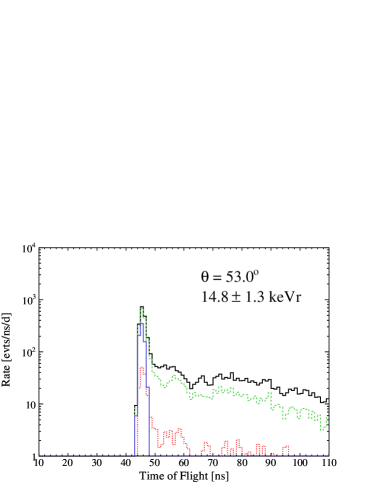
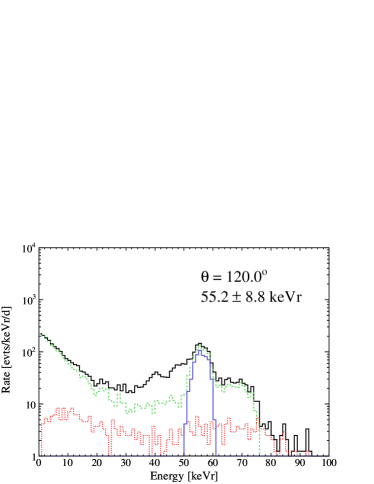
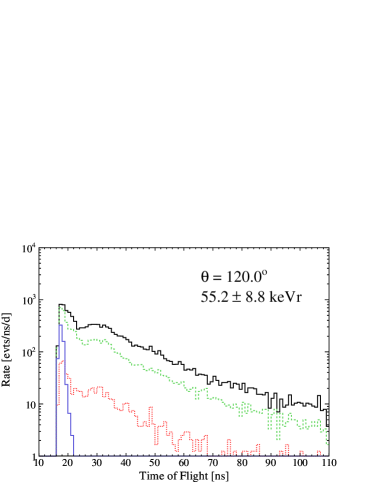
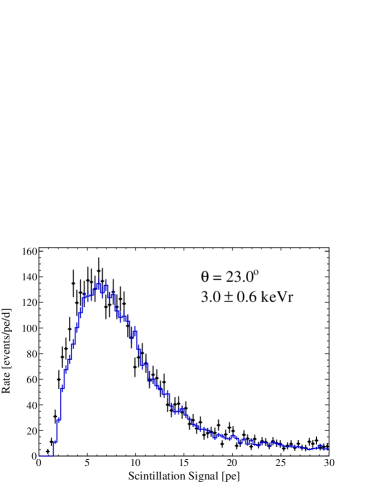
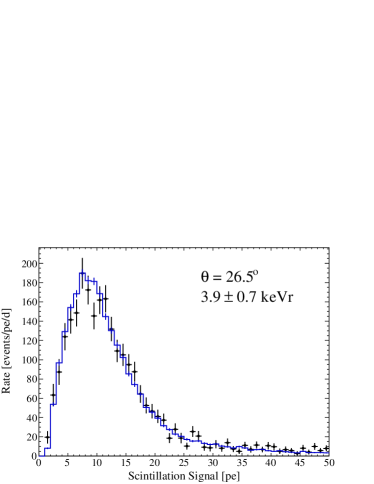
Neutron scattering data were acquired at eight different angles: , , , , , , , and , corresponding respectively to recoil energies of , , , , , , , and keV. The uncertainty in nuclear recoil energies, dominated by the angular acceptance of the detectors, is extracted from the results of the Geant4 Monte Carlo simulation described in Sec. III.4. For most angles, the first EJ301 neutron detector was placed in the plane of the neutron generator and the LXe detector, while the second was placed at the same distance to the LXe detector but higher above the laboratory floor, with an azimuthal angle of about . For all measurements the recoil energy and TOF distributions of the two EJ301 neutron detectors are compatible. Figures 8 and 9 show the measured recoil energy and TOF spectra for the all scattering angles.
All measurements show two very clear peaks in the TOF spectrum. The peak at corresponds to rays that Compton scatter in the LXe detector before interacting in the EJ301 neutron detectors, while the peak at later TOF values corresponds to neutrons. For the lower recoil energies the effect of the spread of the TOF distribution to smaller values, discussed in the previous section, is noticeable in Figures 8 and 9.
For energies of 6.5 keV and above, the peak in the recoil spectrum is clearly above the beginning of the low-energy trigger efficiency roll-off. For these energies, could even be computed directly without much uncertainty, simply by fitting a Gaussian to the peak. For energies below 6.5 keV, a more sophisticated procedure that takes into account the trigger efficiency is warranted. The procedure used to extract from the measured recoil energy spectra is detailed in Sec. III.4.
 |
 |
 |
 |
 |
 |
 |
 |
 |
 |
 |
 |
 |
 |
 |
 |
III.4 Monte Carlo Simulation
Extensive Geant4 simulations of the expected neutron scattering rate, nuclear recoil energy distribution and neutron TOF distribution were performed for each scattering angle. Each simulation takes into account a realistic description of the neutron generator, LXe detector, detector vessel, vacuum cryostat, support frame, as well as the measured positions of the two EJ301 neutron detectors. The livetime of each scattering angle simulation is calculated from the expected neutron yield of the generator at the operating conditions of the measurement and the results are scaled accordingly.
The information recorded in the simulation includes the energy, position, time, type of particle, and physical process responsible for each energy deposit in the LXe detector, as well as the energy, time, and type of particle for each energy deposit in the EJ301 neutron detectors. The energy and direction of the primary neutron is sampled from the calculated energy-angle distribution of neutrons produced by the generator, as given by eq. 6.
Neutrons that interact in the active LXe volume can deposit energy via elastic or inelastic scattering, once or multiple times, and may additionally scatter in materials outside of the active volume. The contributions from all these classes of events has been inferred from the Monte Carlo simulation. Figs. 10 and 11 show the simulated recoil energy and TOF distributions for all measured scattering angles. The energy spectrum of elastic recoils consists of a peak, roughly centered at the recoil energy corresponding to the angle at which the EJ301 neutron detectors have been placed, and an approximately exponentially distributed background. The peak is due to neutrons that elastically scatter once in the LXe detector and interact nowhere else (pure single elastic scatters), while the exponential background is due to neutrons that additionally scatter in other materials surrounding the active volume, that is, their energy deposit in the LXe is essentially that of a recoil with a random scattering angle. For the smaller angles the nuclear recoil energy spectrum is clearly dominated by pure single elastic recoils with 61% at (3 keV) but the proportion gradually decreases reaching 49% at 8.4 keV and 17.8% at 55.2 keV. The multiple scatter contribution is negligible at all angles, from 3.7% at up to 7.0% at , due to the small dimensions of the active LXe volume compared to the neutron elastic scattering mean free path. These simulation results demonstrate clearly that the design goal of minimizing the amount of materials in the vicinity of the active LXe volume has been achieved.
 |
 |
 |
 |
 |
 |
 |
 |
 |
 |
 |
 |
 |
 |
 |
 |
III.5 Extracting
 |
 |
 |
 |
 |
 |
 |
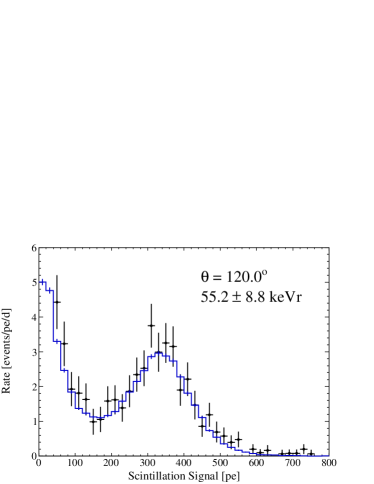 |
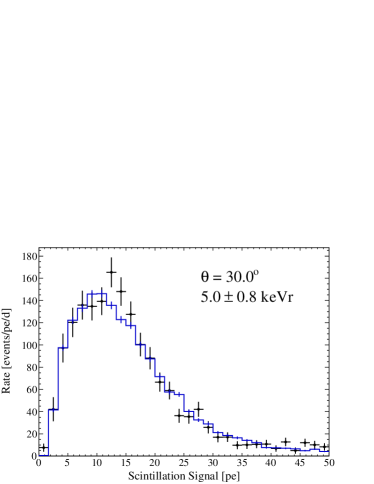
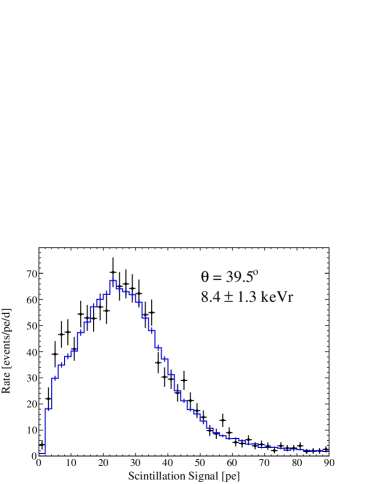
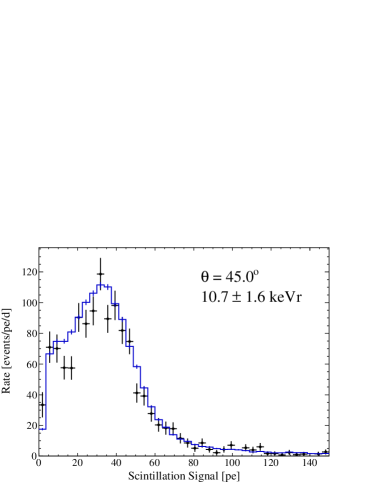
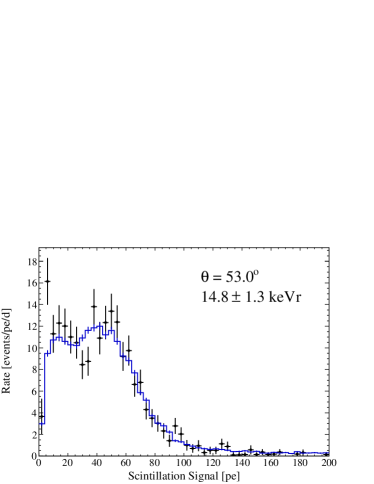
The energy dependence of is obtained by minimizing the statistic between the measured recoil distribution and the simulated distribution with respect to two free parameters, and , respectively the scintillation efficiency and the energy resolution at the recoil energy measured . These fits are shown in Fig. 12 for all measured scattering angles. Explicitly, the statistic is computed from
| (7) |
where and are the measured and simulated event rates in energy bin , respectively, and and the uncertainties in the measured and simulated event rates in bin , respectively. The bins over which the statistic is computed varies depending on the scattering angle so that the does not become dominated by effects in the higher energy tail of the recoil distribution, nor the low trigger efficiency region. Bins with no counts are removed from the sum (and the number of degrees of freedom is decreased by one).
The steps involved in transforming the simulated recoil energy distributions of Figs. 10 and 11 into the simulated recoil energy distribution , in photoelectrons, are detailed below.
The recoil energy spectrum obtained from the simulation is first multiplied by the value under test to convert it to a spectrum with energies in keV (electron-equivalent) and convolved with a Gaussian energy resolution with standard deviation , where is the resolution parameter under test. Next, the recoil energy spectrum is multiplied by the measured light yield to obtain a spectrum in photoelectrons. The number of photoelectrons is allowed to fluctuate according to a Poisson distribution. The effect of the PMT gain fluctuations is incorporated by convolving the recoil energy spectrum in photoelectrons with a Gaussian single photoelectron resolution with standard deviation, where is the measured mean PMT single photoelectron resolution. The measured trigger efficiency function discussed in section II is then applied to the recoil energy spectrum. As mentioned earlier, the resulting recoil energy spectrum is divided by the simulation livetime, computed from the neutron generator yield at the operating conditions. Since is left as a free parameter during the minimization, any additional contribution to the resolution not accounted for will be absorbed in that parameter.
The last step involves multiplying the simulated recoil energy spectrum by an overall, energy independent efficiency , taken as the same for all scattering angle measurements, mostly due to the EJ301 energy threshold cut and to the uncertainty in the neutron generator yield. This efficiency is computed during the minimization as an additional parameter for the measurement at the recoil energies of , and keV. The best fit value from these three measurements is taken as the efficiency for all measurements, while its uncertainty is taken as the maximum deviation in the measurements. The value obtained is . The 10% relative uncertainty on the efficiency reflects the fact that uncertainties in the neutron yield from the generator are at this level.
IV Results
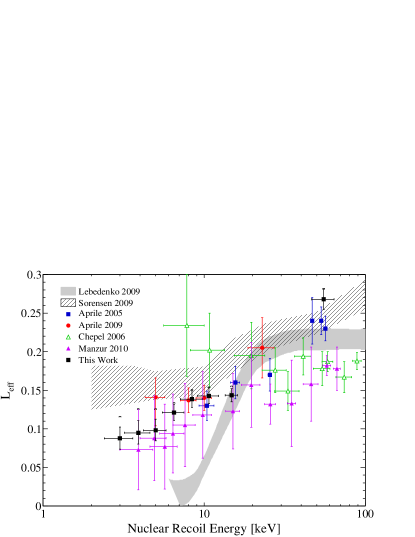
The values obtained for all scattering angles measured are listed in Table 1. Fig. 13 shows the results along with those of prior measurements at low energies Aprile et al. (2005); Chepel et al. (2006); Aprile et al. (2009); Manzur et al. (2010); Sorensen et al. (2009); Lebedenko et al. (2009b).
| (keV) | ||
|---|---|---|
| 23∘ | ||
| 26.5∘ | ||
| 30∘ | ||
| 34.5∘ | ||
| 39.5∘ | ||
| 45∘ | ||
| 53∘ | ||
| 120∘ |
The total uncertainty on is given by a combination of statistical and systematic factors with the statistical uncertainty taken from the fit to the data. The systematic uncertainties include contributions from the spread in nuclear recoil energies, , and uncertainties associated with the light yield, , the efficiency of the liquid scintillator threshold cut, , and the positions of the neutron generator, , and of the EJ301 detectors, . Explicitly
| (8) |
The change in with nuclear recoil energy, , is computed in closed form from a logarithmic fit to the measured values versus nuclear recoil energy. The change in the inferred values due to the uncertainties in the efficiency, and the positions of the neutron generator and of the EJ301 detectors, , , and , respectively, were all calculated through a discrete approximation by performing additional Geant4 simulations where each parameter is varied by small amounts.
The largest contribution to the total uncertainty in comes from the spread in recoil energy. At energies below 6.5 keV, this is followed by the uncertainty in the efficiency . This is expected as in this region, varies most with nuclear recoil energy, and since the mean of the pure single elastic recoil peak is in the roll-off of the trigger efficiency curve. For energies of 6.5 keV and above, the statistical uncertainty from the fit is the next-to leading contribution to the total uncertainty. This is likely caused by the smaller statistics acquired for the higher recoil energy datasets.
The systematic uncertainty in coming from the uncertainty in the trigger efficiency roll-off has been investigated by varying the trigger efficiency function. If one assumes the measured trigger efficiency as the true efficiency, then its statistical uncertainty has a negligeable effect on the inferred values. However, if one assumes that a systematic effect is responsible for the discrepancy between the mesured and simulated trigger efficiencies and takes the simulated efficiency as the true efficiency, then the effect on the values below 6.5 keV is substantial. The effect is indicated by the additional error indicators in in Fig. 13.
V Discussion
Our results suggest that slowly decreases with decreasing energy, from at 15 keV to at 3 keV. The agreement at 8.4 and 10.7 keV with the points at 8 and 10 keV of Aprile et. al Aprile et al. (2009) is excellent. Considering that the two measurements were performed with different LXe detectors, using different incident neutron energies, and at different neutron fluxes, reinforces the accuracy of the new measurement. Our results below 10 keV are consistent with those of Manzur et al. Manzur et al. (2010), within errors, but the decreasing trend observed is not as pronounced. However, they are incompatible with the indirect measurement of Lebedenko et. al Lebedenko et al. (2009b) or with considerably smaller values such as those suggested in Collar (2010).
We have not performed any measurement of below 3 keV to avoid the low trigger efficiency region. If were to decrease below 3 keV with the same logarithmic slope as observed between 3 and 10.7 keV, the single elastic recoil peak for a 2 keV measurement, for example, would lie at a trigger efficiency of 45%. At this stage, the fraction of the neutron scattering rate which produces measurable signals becomes comparable to the relative uncertainty on the neutron generator yield. Considering that this LXe detector has the highest light detection efficiencies achieved in a LXe detector, measuring in the near future at lower energies is probably impractical and will be subject to a considerably higher systematic uncertainty from the trigger efficiency roll-off.
Given that most LXe dark matter detectors use both the scintillation and ionization signals to distinguish nuclear recoils from backgrounds and would thus benefit from an improved energy calibration using both signals, the next step will be to simultaneously measure the scintillation and ionization yield of nuclear recoils.
Acknowledgements.
This work was carried out with support from the National Science Foundation for the XENON100 Dark Matter experiment (Award No. PHYS09-04220). We express our gratitude to Andrew Bazarko and Peter Wraight from the Schlumberger Princeton Technology Center, for their support with the neutron generator.References
- Angle et al. (2008) J. Angle et al. (XENON10), Phys. Rev. Lett. 100, 021303 (2008).
- Aprile et al. (2010) E. Aprile et al. (XENON100), Phys. Rev. Lett. 105, 131302 (2010).
- Alner et al. (2007) G. J. Alner et al. (ZEPLIN-II), Astropart. Phys. 28, 287 (2007), eprint astro-ph/0701858.
- Lebedenko et al. (2009a) V. N. Lebedenko et al. (ZEPLIN-III), Phys. Rev. Lett. 103, 151302 (2009a), eprint 0901.4348.
- Minamino (2010) A. Minamino (XMASS), Nucl. Instrum. Meth. A623, 448 (2010).
- Aprile et al. (2011a) E. Aprile et al. (XENON100) (2011a), eprint 1101.3866.
- Aprile et al. (2011b) E. Aprile et al. (XENON100) (2011b), eprint 1103.0303.
- Lindhard and Scharff (1961) J. Lindhard and M. Scharff, Phys. Rev. 124, 128 (1961).
- Hitachi (2005) A. Hitachi, Astropart. Phys. 24, 247 (2005).
- Barabanov et al. (1987) I. R. Barabanov, V. N. Gavrin, and A. M. Pshukov, Nucl. Instrum. Meth. A254, 355 (1987).
- Sorensen et al. (2009) P. Sorensen et al. (XENON), Nucl. Instrum. Methods A 601, 339 (2009).
- Lebedenko et al. (2009b) V. N. Lebedenko et al. (ZEPLIN-III), Phys. Rev. D 80, 052010 (2009b).
- Arneodo et al. (2000) F. Arneodo et al., Nucl. Instrum. Methods A 449, 147 (2000).
- Bernabei et al. (2001) R. Bernabei et al., Eur. Phys. J. direct C3, 11 (2001).
- Akimov et al. (2002) D. Akimov et al., Phys. Lett. B 524, 245 (2002).
- Aprile et al. (2005) E. Aprile et al., Phys. Rev. D 72, 072006 (2005).
- Chepel et al. (2006) V. Chepel et al., Astropart. Phys. 26, 58 (2006).
- Aprile et al. (2009) E. Aprile et al., Phys. Rev. C 79, 045807 (2009).
- Manzur et al. (2010) A. Manzur et al., Phys. Rev. C 81, 025808 (2010).
- Giboni et al. (2011) K. L. Giboni et al., JINST 6, P03002 (2011), eprint 1103.0986.
- Csikai (1987) J. Csikai, Handbook of fast neutron generators, vol. 1 (CRC Press, Boca Raton, Florida, 1987).
- Chadwick et al. (2006) M. Chadwick, P. Obložinský, M. Herman, et al., Nuclear Data Sheets 107, 2931 (2006), URL www.sciencedirect.com/science/journal/00903752.
- Manalaysay (2010) A. Manalaysay (2010), eprint 1007.3746.
- (24) M. Berger, J. Hubbell, S. Seltzer, J. Chang, J. Coursey, R. Sukumar, D. Zucker, and K. Olsen, Xcom: Photon cross section database.
- Collar (2010) J. I. Collar (2010), eprint 1010.5187.