Mapping the X-Ray Emission Region in a Laser-Plasma Accelerator
Abstract
The x-ray emission in laser-plasma accelerators can be a powerful tool to understand the physics of relativistic laser-plasma interaction. It is shown here that the mapping of betatron x-ray radiation can be obtained from the x-ray beam profile when an aperture mask is positioned just beyond the end of the emission region. The influence of the plasma density on the position and the longitudinal profile of the x-ray emission is investigated and compared to particle-in-cell simulations. The measurement of the x-ray emission position and length provides insight on the dynamics of the interaction, including the electron self-injection region, possible multiple injection, and the role of the electron beam driven wakefield.
Remarkable advances in relativistic laser-plasma interaction using intense femtosecond lasers have led to the development of compact electron accelerators and x-ray sources with unique properties. These sources use the very high longitudinal electric field associated with plasma waves, excited in an under-dense plasma by a relativistic laser pulse, to trap and accelerate electrons to relativistic energies Tajima and Dawson (1979). For laser and plasma parameters corresponding to the bubble or blowout regimes Pukhov and Meyer-ter Vehn (2002); Lu et al. (2007), the production of quasimonoenergetic electron beams was demonstrated Mangles et al. (2004); *Nature2004Geddes; *Nature2004Faure. During their acceleration, these electrons perform transverse (betatron) oscillations due to the transverse focusing force of the wakefields. This leads to the emission of bright and collimated femtosecond beams of x rays Rousse et al. (2004); Kiselev et al. (2004); Kneip et al. (2010). Such a compact and cost effective x-ray source could contribute to the development of emerging fields such as femtosecond x-ray imaging Gaffney and Chapman (2007). The x-ray emission can be exploited as well to provide information on the physics of laser-plasma interaction, such as electron trajectories in the bubble Ta Phuoc et al. (2006).
In this Letter, we demonstrate that by measuring the position and the longitudinal profile of the x-ray emission, one can determine important features of the interaction: laser pulse self-focusing, electron self-injection and possible multiple injection, as well as the role of the electron beam wakefield. The method relies on the observation, in the x-ray beam profile, of the shadow of an aperture mask adequately positioned just beyond the end of the emission region. The size of the shadow on the x-ray image permits us to determine the longitudinal position of the x-ray emission in the plasma, while the intensity gradient of the edge of the shadow yields the longitudinal profile of the emission. Because the x-ray emission position and length are closely connected to the electron injection position and the acceleration length, this measurement provides a unique insight into the interaction. Particle-in-cell (PIC) simulations are performed to analyze the experimental results.
The experiment was conducted at Laboratoire d’Optique Appliquée with the “Salle Jaune” Ti:Sa laser system, which delivers 0.9 Joule on target with a full width at half maximum (FWHM) pulse duration of 35 fs and a linear polarization. The laser pulse was focused inside a capillary at mm from the entrance, with a spherical mirror. The FWHM focal spot size was m, and using the measured intensity distribution in the focal plane we found a peak intensity of , corresponding to a normalized amplitude of . The target was a capillary made of two Sapphire plates with half-cylindrical grooves of diameter m and a length of 15 mm, filled with hydrogen gas at pressure ranging from 50 to 500 mbar. The target acts as a steady-state-flow gas cell Osterhoff et al. (2008). The capillary wall surface roughness is around 1 m, and therefore x rays cannot be reflected by the capillary wall. In addition, from our laser contrast of , number and capillary diameter, we estimate that the pedestal intensity on the capillary wall is smaller than W.cm-2, and thus no preplasma is formed before the x-ray pulse arrival. We measured either the x-ray beam profile using an x-ray CCD camera ( pixels, ), set at cm from the capillary exit and protected from the laser light by a 20 m Al filter, or the electron beam spectrum with a focusing-imaging spectrometer.
In our experiment, the betatron emission had a divergence larger than the opening angle associated with the capillary exit, which acts as the aperture mask. The x-ray beam was thus clipped by the capillary Genoud et al. (2011). Figures 1(a)-1(c) present a sample of shadows of diverse sizes corresponding to different longitudinal positions of the source, .
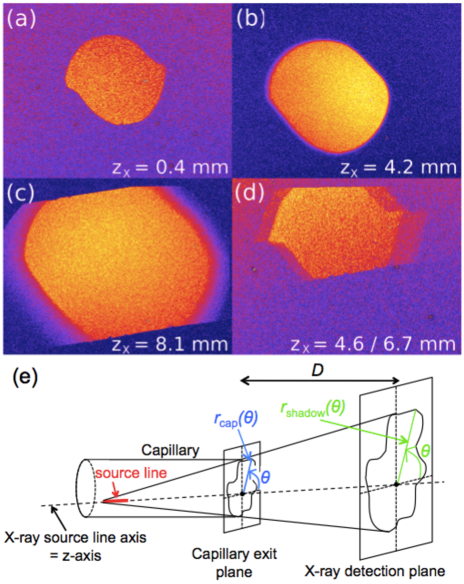
If x rays were emitted from a point source the edge of the shadow would be perfectly sharp. In contrast, for a finite source size, the edge has a finite intensity gradient which depends on the transverse and longitudinal dimensions of the source. Previous experiments reported transverse source sizes on the order of 1-2 m Ta Phuoc et al. (2006); Albert et al. (2008); Mangles et al. (2009); Kneip et al. (2010); Fourmaux et al. (2011). In our configuration, the observed intensity gradients are much larger than those induced by such a transverse size. For mm, a transverse source size of 1-2 m gives the same gradient as a longitudinal extension of 100-200 m, which gives a limit on the longitudinal resolution of the method. The gradient length is therefore dominated by the longitudinal extension of the source and x rays are considered as emitted from a line source. In the following, we use a cylindrical coordinate system whose axis is the line source axis. If corresponds to the entrance of the capillary and to the exit, then the x-ray emission position is given for by , where [respectively ] is the radial distance between the axis and the capillary edge (respectively the shadow edge) in the direction defined by the angle [see Fig. 1(e)], and is the distance between the capillary exit and the observation plane. For a perfectly circular capillary exit and a line source on the capillary axis, simplifies to , but a more general capillary exit shape and an arbitrary position or orientation of the line source can be represented by the function .
Assuming the betatron x-ray beam profile without the mask is constant on the gradient scale length (a reasonable approximation for our experimental results), the signal profile reads:
| (1) |
with . In Eq. (1), is the x-ray signal that originated from the emission between and , and is the signal measured at a given position on the detector. Equation (1) can be understood as follows. For a position on the detector, rays coming from are blocked at the capillary exit, and therefore the signal measured at is the sum of the signal emitted between and .
Taking the derivative of Eq. (1), the longitudinal profile of the x-ray emission can be expressed as a function of the radial profile in the detection plane:
| (2) |
with . If and are, respectively, the characteristic emission and intensity gradient lengths, Eq. (2) leads, for , to . Thus, the measurement of the shadow size and the gradient yield, respectively, the longitudinal position and the longitudinal length of the x-ray emission. The full emission profile is retrieved from using Eq. (2). Further, the transverse displacement of the shadow and the asymmetry of give information on the position and orientation of the line source. For example, we observed experimentally a drift of the line source which was correlated to a low vertical drift of the laser pulse. In addition, the asymmetry in , as observed in Fig. 1(b), cannot originate from the transverse source size and is a signature of the longitudinally induced edge intensity gradient. This confirms that the gradient length is dominated by the longitudinal extension of the source.
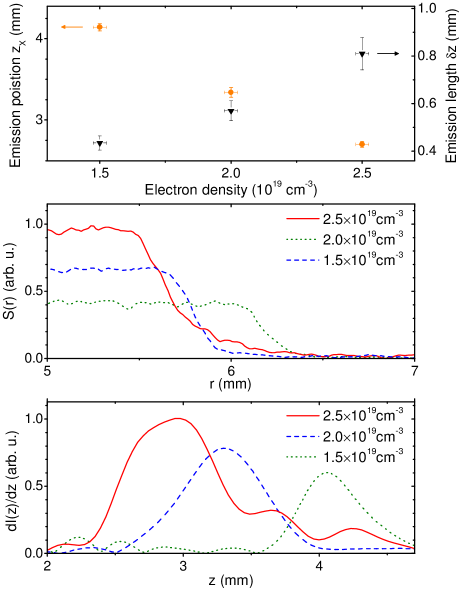
We now apply this method to study the influence of the plasma electron density on the x-ray emission position , and longitudinal extension . No x ray is observed for electron density cm-3, and the x-ray signal is increasing with . At the density range cm cm-3, we observed broadband electron beams with energies from 100 to 400 MeV, with sometimes some monoenergetic components, and charge in the few tens of pC range. Figure 2 shows the experimental results: the behaviors of and with respect to the electron density on the top, as well as single shot raw lineouts of the edge intensity profiles (middle) and the corresponding x-ray emission profiles (bottom) for different densities. The error on , due to the uncertainty on the capillary exit diameter resulting from laser damage, is estimated to be inferior to 1%.
To interpret these results, we performed 3D PIC simulations with the numerical code described in Ref. Lifschitz et al. (2009), which uses a Fourier decomposition of the electromagnetic fields in the azimuthal direction. The first two modes are retained, which allows us to describe the linearly polarized laser field and a quasicylindrical wakefield. The normalized laser amplitude was taken as , the FWHM focal spot width was 22 m and the FWHM pulse duration 35 fs. The focal plane was located inside the capillary at 2.2 mm from the entrance. As the x-ray wavelengths are not resolved by the grid used in the simulations, x-ray emission was computed by using the trajectories of trapped electrons obtained from the PIC code and the Liénard-Wiechert fields to calculate the radiation emitted by electrons Jackson (2001). Figure 3(a) presents the calculated x-ray emission profiles for cm-3 and cm-3, which reproduce qualitatively the experimental profiles.
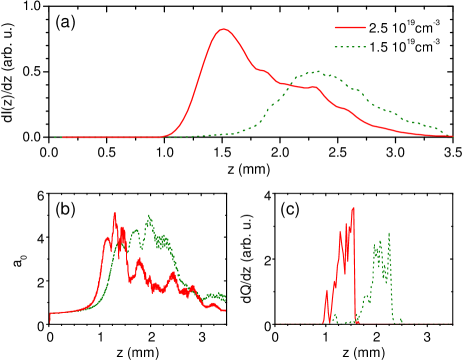
Experimentally, the position of the beginning of the x-ray emission varies from 4.1 mm to 2.7 mm when increases from cm-3 to cm-3. This behavior can be explained by the influence of on the laser propagation in the plasma. At higher density, the laser pulse self-focuses and self-steepens more quickly and towards a smaller transverse spot size Esarey et al. (1997), as shown by the simulated profiles in Fig. 3(b). As a result, it attains sufficiently large to trigger electron trapping and then x-ray emission on a smaller propagation distance. Moreover, electron self-injection is facilitated at high density, due to the stronger wakefield amplitude and the reduced wake velocity and wave-breaking threshold. Therefore, as can be seen in Fig. 3(b) and 3(c), at low density, electron trapping is delayed with respect to the beginning of the plateau (), which contributes to an x-ray emission beginning later.
Figure 2 shows that the emission length (in which 70% of the signal is emitted) depends also on the electron density. It increases from 430 m to 810 m when the density varies from cm-3 to cm-3. Further, at high density, the x-ray emission length extends well beyond the dephasing and depletion lengths (the orders of magnitude are respectively m and m for cm-3 considering Lu’s model Lu et al. (2007)).
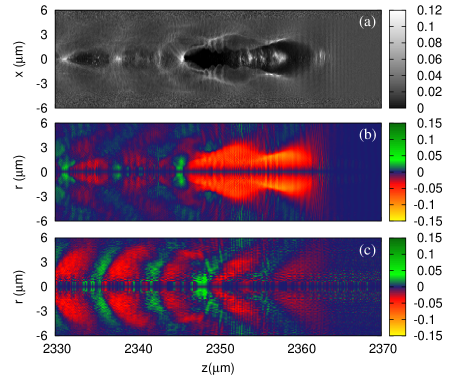
To understand why x-ray emission can continue after the dephasing length or after the fall of , we simulated the wakefield excited by the laser pulse only (without the influence of the electron beam) at a late time. Figure 4 shows the simulated wakefield at mm for the high density case, and the corresponding transverse force with and without the influence of the electron beam. At this late time, the laser pulse is unable to excite a strong transverse wakefield and the wakefield is excited mainly by the electron beam [compare Figs. 4(b) and Fig. 4(c)]. Hence, a transverse focusing wakefield is maintained by the electron beam such that electrons continue to oscillate and to emit x rays. It corresponds to a smooth transition from a laser wakefield accelerator to a plasma wakefield accelerator Pae et al. (2010) in which the wakefield is excited by a particle beam Blumenfeld et al. (2007). Therefore, x-ray emission is no longer limited by the dephasing length or by the laser depletion. This explains why the x-ray emission length at cm-3 is comparable to cm-3 in the simulation, while the peak profile is significantly shorter in length in the former case.
The behavior of , particularly visible on the experimental results, could be explained by a higher normalized particle beam density at high density, favoring an electron beam excited transverse wakefield and a late x-ray emission.
During the experiment, multiple emission positions were observed on some shots, as shown for instance in Fig. 1(d), where x rays are emitted at and mm. This can be explained by oscillations of the laser pulse amplitude during its propagation in the plasma. The wakefield amplitude is sufficiently high to trap electrons only when is at its maximum, leading to multiple electron injection and therefore multiple emission positions.
In conclusion, we developed a novel method to map the longitudinal dependence of x-ray emission in a laser-plasma accelerator and demonstrated the possibility to measure single shot x-ray emission longitudinal profiles. This method provides detailed information on the interaction. In particular, we showed that, at high density, x-ray emission begins sooner because of the faster self-focusing and self-steepening of the laser pulse, and that the electron beam driven wakefield plays an important role in the late x-ray emission. One of the major goals for laser-plasma accelerators consists in increasing the acceleration length, either by guiding the laser pulse or using higher laser energy. In this context, this method, which can also be used with gas jets by using a small aperture near the source, will allow us to understand over which distance self-focusing and self-steepening take place, where electron injection occurs and over which distance acceleration and x-ray emission happen.
We acknowledge the Agence Nationale pour la Recherche, through the COKER project ANR-06-BLAN-0123-01, the European Research Council through the PARIS ERC project (under Contract No. 226424) and the support from EC FP7 LASERLABEUROPE/ LAPTECH Contract No. 228334 for their financial support. The authors also appreciate the contributions of J. Larour, P. Auvray and S. Hooker in the realization of the capillary unit.
References
- Tajima and Dawson (1979) T. Tajima and J. M. Dawson, Phys. Rev. Lett. 43, 267 (1979).
- Pukhov and Meyer-ter Vehn (2002) A. Pukhov and J. Meyer-ter Vehn, Appl. Phys. B 74, 355 (2002).
- Lu et al. (2007) W. Lu et al., Phys. Rev. ST Accel. Beams 10, 061301 (2007).
- Mangles et al. (2004) S. P. D. Mangles et al., Nature (London) 431, 535 (2004).
- Geddes et al. (2004) C. G. R. Geddes et al., Nature (London) 431, 538 (2004).
- Faure et al. (2004) J. Faure et al., Nature (London) 431, 541 (2004).
- Rousse et al. (2004) A. Rousse et al., Phys. Rev. Lett. 93, 135005 (2004).
- Kiselev et al. (2004) S. Kiselev, A. Pukhov, and I. Kostyukov, Phys. Rev. Lett. 93, 135004 (2004).
- Kneip et al. (2010) S. Kneip et al., Nature Phys. 6, 980 (2010).
- Gaffney and Chapman (2007) K. J. Gaffney and H. N. Chapman, Science 316, 1444 (2007).
- Ta Phuoc et al. (2006) K. Ta Phuoc et al., Phys. Rev. Lett. 97, 225002 (2006).
- Osterhoff et al. (2008) J. Osterhoff et al., Phys. Rev. Lett. 101, 085002 (2008).
- Genoud et al. (2011) G. Genoud et al., Appl. Phys. B 105, 309 (2011).
- Albert et al. (2008) F. Albert et al., Phys. Rev. E 77, 056402 (2008).
- Mangles et al. (2009) S. P. D. Mangles et al., Appl. Phys. Lett. 95, 181106 (2009).
- Fourmaux et al. (2011) S. Fourmaux et al., Opt. Lett. 36, 2426 (2011).
- Lifschitz et al. (2009) A. F. Lifschitz et al., J. Comput. Phys. 228, 1803 (2009).
- Jackson (2001) J. D. Jackson, Classical Electrodynamics, 3rd ed. (Wiley, New York, 2001).
- Esarey et al. (1997) E. Esarey et al., IEEE J. Quantum Electron. 33, 1879 (1997).
- Pae et al. (2010) K. H. Pae, I. W. Choi, and J. Lee, Phys. Plasmas 17, 123104 (2010).
- Blumenfeld et al. (2007) I. Blumenfeld et al., Nature (London) 445, 741 (2007).
- Leemans et al. (2006) W. P. Leemans et al., Nature Phys. 2, 696 (2006).