A peculiar young eruptive star in the dark cloud Lynds 1340
Abstract
We conducted a long-term optical photometric and spectroscopic monitoring of the strongly variable, accreting young sun-like star [KOS94] HA 11, associated with the dark cloud Lynds 1340, that exhibited large amplitude (5–6 magnitudes in the band) brightness variations on 2–3 years timescales, flat spectral energy distribution (SED), and extremely strong ( EW/Å) H emission. In this Letter we describe the basic properties of the star, derived from our observations between 1999 and 2011, and put into context the observed phenomena. The observed variations in the emission spectra, near-infrared colors, and SED suggest that [KOS94] HA 11 (spectral type: K7–M0) is an eruptive young star, possibly similar in nature to V1647 Ori: its large-scale photometric variations are governed by variable accretion rate, associated with variations in the inner disk structure. The star recently has undergone strong and rapid brightness variations, thus its further observations may offer a rare opportunity for studying structural and chemical rearrangements of the inner disk, induced by variable central luminosity.
1 Introduction
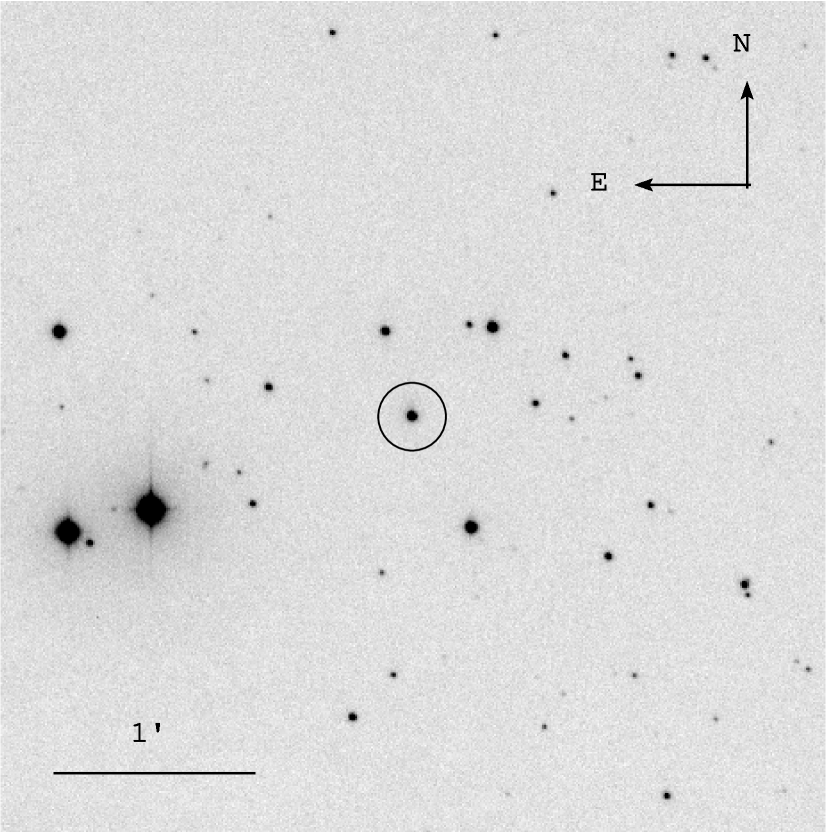
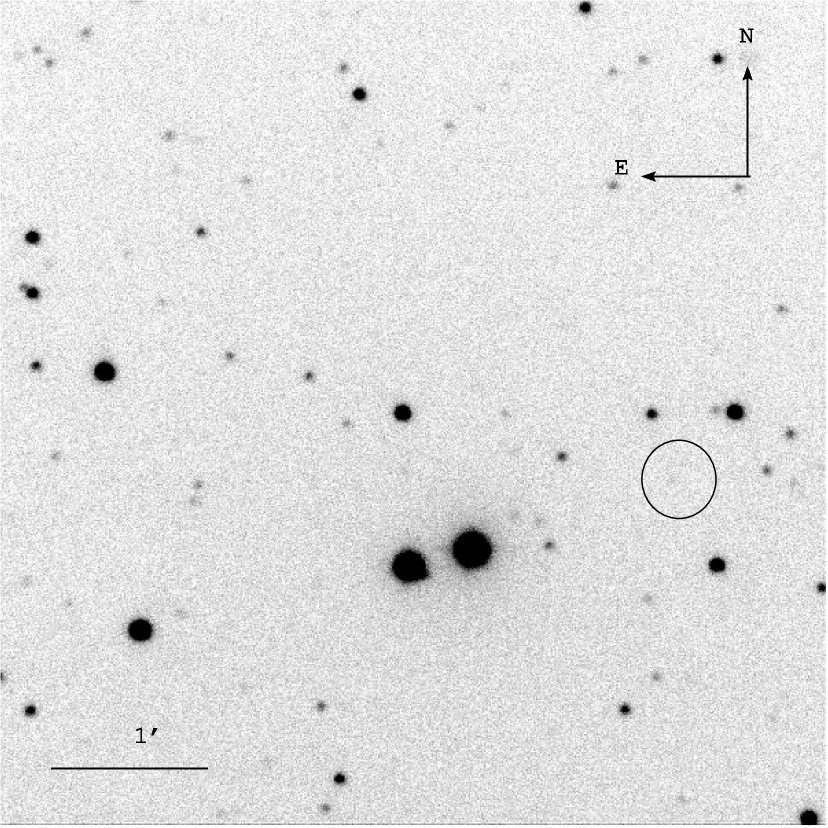
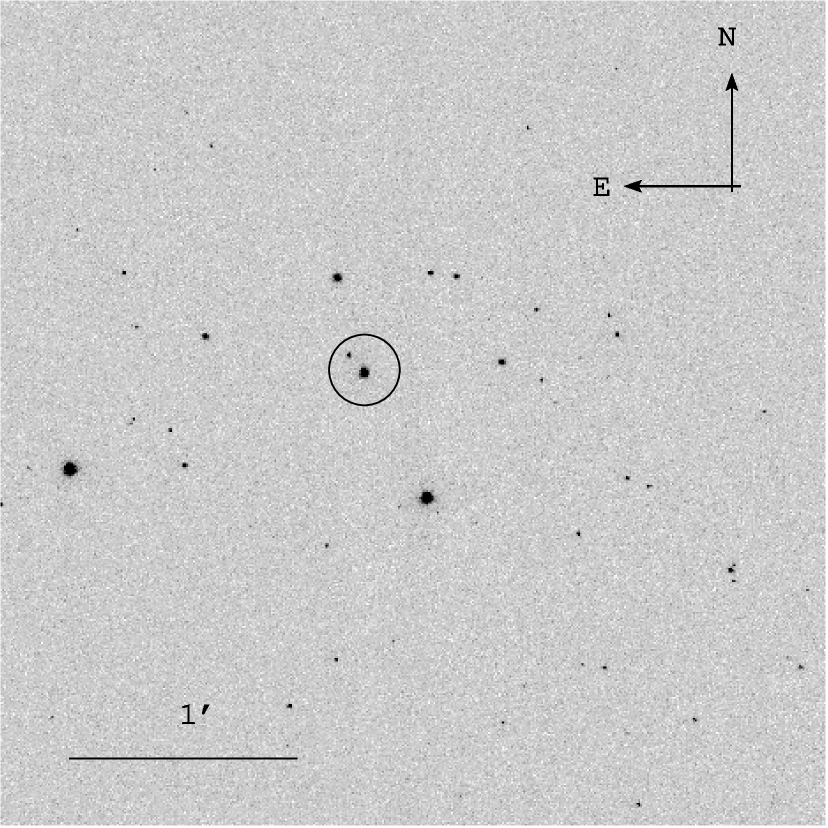
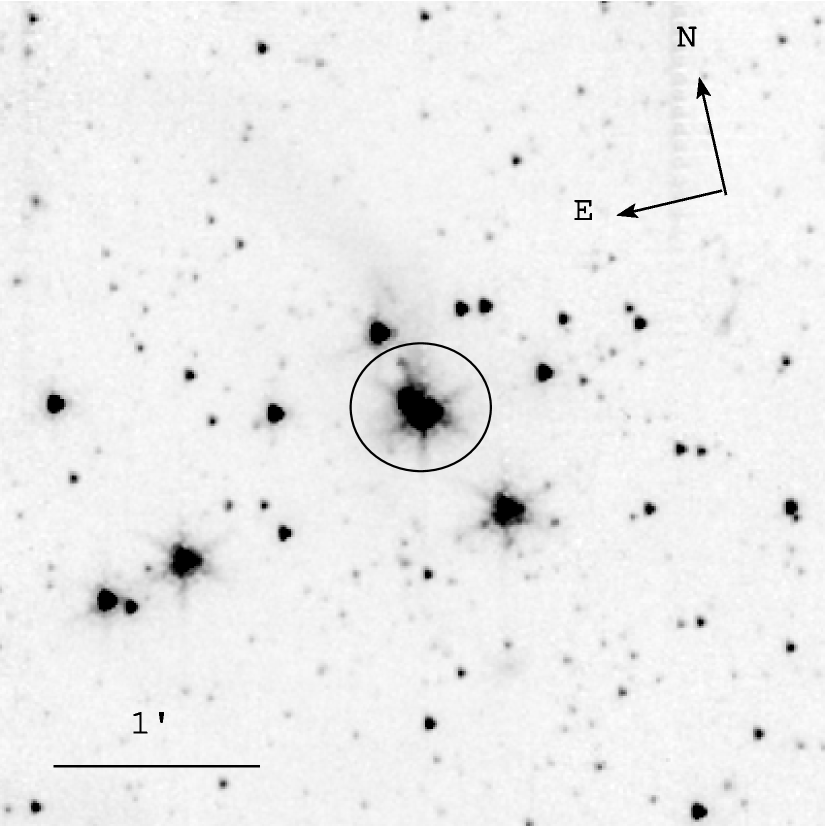
The irregular, large-scale photometric and spectroscopic variations of young low-mass stars reflect violent physical processes, originating from interactions of the stars with their accretion disks, and leading to clearing of the disk within an astrophysically short time-scale. Most of the disk material accretes onto the central star in episodic outbursts, characterized by strongly increased optical, infrared, and X-ray brightness (e.g. Kastner et al., 2004; Aspin et al., 2010; Audard et al., 2010), powered by the enhanced accretion rate. The varying accretion luminosity may induce changes in the inner disk structure, which result in changing circumstellar extinction (Aspin, Beck & Reipurth, 2008; Brittain et al., 2010). The spectacular brightenings of eruptive young stars offer a rare opportunity to understand the effects of outbursts on disk structure and evolution. The target of the present paper is a young star whose photometric variations are comparable in amplitude with those of eruptive stars, but differ from them in timescale. [KOS94] HA11 (Simbad designation) was identified as a candidate young stellar object by Kun et al. (1994), during an objective prism H survey for young stellar objects in the molecular cloud Lynds 1340, located at a distance of 600 pc from the Sun. It is associated with the protostellar-like IRAS source 02283+7230, and appears as a 16th magnitude star in both the DSS1 and DSS2 red images, obtained on 1954 September 28 and 1993 August 22, respectively, at the equatorial coordinates RA(J2000)=, D(J2000)=. We noticed its peculiar behavior in 1999, when the star was too faint to be detected in an unfiltered image obtained with a 2.2-m telescope (Fig. 1). We started monitoring the star in 1999, with the aim of observing its expected reappearance, and understanding the physical processes behind the observed phenomena. In this Letter we describe the basic properties of the star, determined from our observations.
2 Observations
Optical photometry
Photometric observations in the bands spanning the time interval between 1999 October and 2011 February were performed with several instruments and telescopes. Most of the data were obtained with the 60/90/180 cm Schmidt telescope of the Konkoly Observatory, equipped with a Photometrics AT 200 camera before 2010 August and with an Apogee Alta U16 camera after that date, and with the 1-m RCC telescope of the Konkoly Observatory, equipped with a Princeton Instruments VersArray:1300B camera. Further photometric observations were performed with the Electro Multiplying (EM) Andor Technology iXon camera installed on the 50 cm Cassegrain telescope of the Konkoly Observatory, the ‘CAMELOT’ CCD camera installed on the IAC–80 telescope of the Teide Observatory (Spain), and with the CAFOS instrument installed on the 2.2-m telescope of the Calar Alto Observatory (Spain). More detailed description of these instruments is given in Acosta-Pulido et al. (2007), Kóspál et al. (2011) and Kun et al. (2011). Typically three frames were taken with exposure times of 180–300 s/frame each night. The instrumental V(RI)C magnitudes of [KOS94] HA 11 were determined by aperture photometry using the ‘daophot’ package in IRAF. To transform the instrumental magnitudes into the standard system, we calibrated 8 stars in the field of view of the 1-m telescope (). Calibration was made during five photometric nights. Standard stars in NGC 7790, published by Stetson (2000), were used as reference. On 2010 December 31 and 2011 January 26 we performed photometric observations of [KOS94] HA 11 through and filters, using WFGS2, installed on the 2.2-m telescope of University of Hawaii. The instrumental magnitudes were transformed into the standard system using the and magnitudes of eight nearby stars, found in the SDSS111Funding for SDSS-III has been provided by the Alfred P. Sloan Foundation, the Participating Institutions, the National Science Foundation, and the U.S. Department of Energy. The SDSS-III web site is http://www.sdss3.org/. SDSS-III is managed by the Astrophysical Research Consortium for the Participating Institutions of the SDSS-III Collaboration including the University of Arizona, the Brazilian Participation Group, Brookhaven National Laboratory, University of Cambridge, University of Florida, the French Participation Group, the German Participation Group, the Instituto de Astrofisica de Canarias, the Michigan State/Notre Dame/JINA Participation Group, Johns Hopkins University, Lawrence Berkeley National Laboratory, Max Planck Institute for Astrophysics, New Mexico State University, New York University, Ohio State University, Pennsylvania State University, University of Portsmouth, Princeton University, the Spanish Participation Group, University of Tokyo, University of Utah, Vanderbilt University, University of Virginia, University of Washington, and Yale University. archive, and then were transformed into and using the formulae of Ivezić et al. (2007). [KOS94] HA 11 itself was observed by the SDSS on 2005 November 3. The data point, transformed into , is also included in our light curve. Finding charts for [KOS94] HA 11 are shown in Fig. 1. The results of the photometry are listed in Table 1, and the light curve in the band is plotted in Fig. 2.
Optical spectroscopy
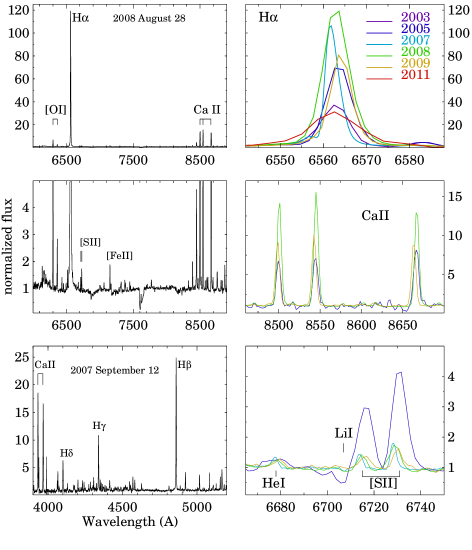
Intermediate resolution optical spectra of [KOS94] HA11 were obtained in 2003 February 5, 2005 September 12, 2008 August 28, 31, and 2009 October 9 and 13, using CAFOS on the 2.2-m telescope of the Calar Alto Observatory. Both the R–100 grism, covering the 5800–9000 Å wavelength range, and the G–100 grism, covering the 5800–9000 Å wavelength range were used in 2008 and 2009. We used only G–100 in 2003, and only R–100 in 2005. The spectral resolution, using a 1.3 arcsec slit width, was at Å. Broadband photometric images were taken immediately before the spectroscopic exposures for flux calibration. [KOS94] HA 11 was observed on 2007 September 12 using the double-armed, medium-resolution spectrograph ISIS, installed on the William Herschel Telescope at the Observatorio del Roque de Los Muchachos, Canary Islands, Spain, with the grating R600R (0.49 Å/pixel). We observed our target with the slitless spectrograph WFGS2, installed on the 2.2-m telescope of the University of Hawaii on 2010 December 31. We used the low-dispersion grism 1 (3.8 Å/pix), and a wide H filter to isolate a Å wide region around the H line. We reduced and analysed the spectra in IRAF. The overall appearance of the optical spectrum can be seen in the left panels of Fig. 3, and some variable features are shown in the right panels.
Near-infrared photometry
imaging observations of [KOS94] HA 11 were performed on 2007 October 1, using the infrared camera NOTCam, installed on the Nordic Optical Telescope222The Nordic Optical Telescope is operated on the island of La Palma jointly by Denmark, Finland, Iceland, Norway, and Sweden, in the Spanish Observatorio del Roque de los Muchachos of the Instituto de Astrofísica de Canarias., on 2009 October 12 using NICFPS on the ARC 3.5-m telescope333The Apache Point Observatory 3.5-meter telescope is owned and operated by the Astrophysical Research Consortium., and on 2010 October 18 with MAGIC installed on the 2.2-m telescope of Calar Alto Observatory444The Centro Astronómico Hispano Alemán (CAHA) at Calar Alto is operated jointly by the Max-Planck-Institut für Astronomie and the Instituto de Astrofísica de Andalucía (CSIC).. The images were reduced in IRAF. magnitudes were derived by aperture photometry, and were transformed into the standard system by comparing them with the 2MASS magnitudes of four stars in the image field. The results of the photometry are listed in Table 1, and plotted in Fig. LABEL:Fig_ir, together with the 2MASS data, obtained on 1999 December 12. In addition to the near-infrared counterpart of [KOS94] HA 11, 2MASS 02330153+7243269, the images reveal an optically invisible companion at an angular distance of 6.2 arcsec NW from the star, 2MASS 02330247+7243315 (Fig. 1).
Spitzer photometry
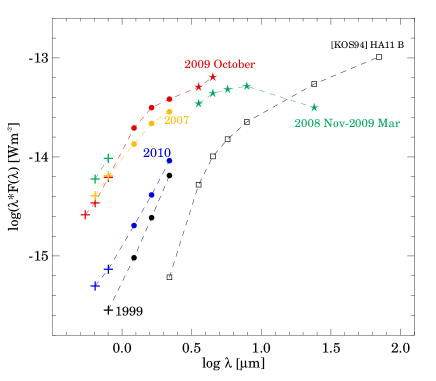
L 1340 was observed by the Spitzer Space Telescope using IRAC on 2009 March 16 and MIPS on 2008 November 26 (Prog. ID: 50691, P.I. G. Fazio). Moreover, we conducted a monitoring of [KOS94] HA11 with IRAC during the post-helium phase between 2009 October 24 and November 7 (Prog. ID: 60167, P.I. P. Ábrahám). The data reduction procedures were same as described in detail in Kun et al. (2011). The results of the photometry of [KOS94] HA 11 are listed in Table 1. The fluxes of the companion are as follows: mJy, mJy, mJy, mJy, mJy, and mJy. The spectral index between 2 and 24 µm reveals that it is a Class I young stellar object. We assume that both stars are members of L 1340. Their angular separation corresponds to a projected separation of 3600 AU. We refer to the companion as [KOS94] HA 11 B. SEDs of both objects, based on our photometric results, are plotted in the right panel of Fig. LABEL:Fig_ir.
3 Results
3.1 Photometric behavior
Light curves
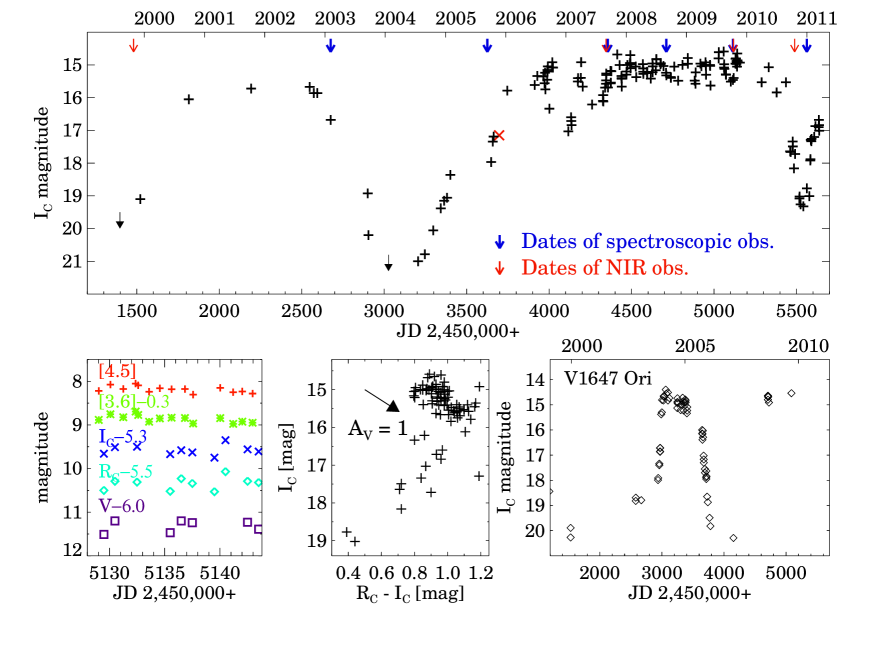
The upper panel of Fig. 2 shows that the amplitude of the variations of [KOS94] HA 11 in the band is about 6 mag, comparable with those of known eruptive young stars. The characteristic timescales of the faint and bright phases, however, differ from those of both FU Ori (FUor) and EX Lupi (EXor) type eruptive stars. The star emerged from a deep brightness minimum in 2000, and stayed around mag for two years. Its brightness dropped by a factor of 100 in the band in 2003, and then returned to the 2000–2002 level by the end of 2005. In 2006–2007 the light curve was characterized by large-scale fluctuations. Between 2007 September and 2010 September the average brightness level was =15.3 mag, and the average color index mag. The star faded to =19.3 between 2010 October and mid-December, and then started brightening. The short timescale behavior between 0.55 and 4.5 µm is shown in the lower left panel of Fig. 2. Daily fluctuation on some 20% flux level can be seen in each band. The fluxes at 3.6 and 4.5 µm increased by some 50% between 2009 March and October. These figures are consistent with the predictions of the model developed by Turner et al. (2010), in which changing shadows, cast by dust clouds lifted by magnetic activity into the disk atmosphere are a cause of the daily to monthly mid-infrared variability.
Color variations
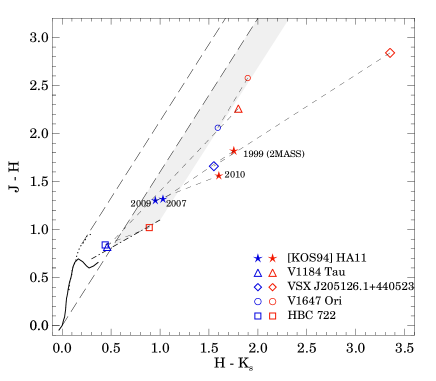
The vs. color–magnitude diagram (lower middle panel of Fig. 2) shows that during the brightness fluctuations in the bright state [KOS94] HA 11 tends to be redder when fainter: this behavior may result from either variable circumstellar extinction or variable hot spot coverage on the stellar surface due to fluctuating accretion rate (e.g. Scholz et al., 2009). In dim state the star turned bluer, indicating that the fraction of scattered light in the optical fluxes increased (cf. e.g. Bibo & Thé, 1991; Kun et al., 2011). The near-infrared color-color diagram (Fig. LABEL:Fig_ir, left) shows that in the bright state (blue symbols) [KOS94] HA 11 appears a moderately reddened T Tauri-type star, whereas in the low-state (red symbols) the near-infrared colors shift to the right, beyond the area occupied by reddened Class II young stellar objects (Meyer, Calvet & Hillenbrand, 1997). The color changes associated with the brightness variations differ from those originated from variable extinction, and are similar to those of the recently discovered eruptive young stars VSXJ 205126.1+440523 and HBC 722 (Kóspál et al., 2011): the stars are shifted nearly parallel to the T Tauri locus, indicating variations in the temperature and/or structure of the inner disks (Meyer et al., 1997).
The spectral energy distribution (SED)
of [KOS94] HA 11 for different epochs is shown in the right panel of Fig. LABEL:Fig_ir. The slope of the bright-state SED between 2 and 24 µm, , classifies [KOS94] HA 11 as a Flat SED source (Greene et al., 1994).
3.2 Stellar properties
Spectral classification
The left panels of Fig. 3 suggest that [KOS94] HA 11 is a strongly accreting T Tauri type star. The spectrum is dominated by the extremely strong H line, and several permitted and forbidden emission lines, characteristic of strongly accreting T Tauri stars, can be identified. The spectrum obtained on 2005 September 12, when the star was some 3 mag fainter than in maximum, is less veiled than those obtained in the bright period between 2007 and 2009. The Li I absorption line can be identified (Fig. 3, bottom right). We estimate a spectral type of K7–M0, based on the flux ratios , , and , defined by Kirkpatrick, Henry & McCarthy (1991), as well as on and , introduced by Prosser et al. (1991).
Extinction and luminosity
We derive an extinction of mag towards the line of sight of [KOS94] HA 11 from the color index, averaged from the measurements in 1999, 2009, and 2010, assuming an unreddened for the K7 spectral type (Kenyon & Hartmann, 1995). We determined the photospheric luminosity from the magnitude measured at the brightness minimum in 1999, after correcting for the above extinction, applying the bolometric correction , given by Hartigan, Strom & Strom (1994) for the K7 spectral type, and a distance modulus of 8.89. The result is , which, together with the effective temperature K of the K7 spectral type (Kenyon & Hartmann, 1995), places [KOS94] HA 11 near the main sequence in the HRD. The emission spectrum of the star contradicts this result, and suggests that the luminosity has been underestimated, most probably because the observed and fluxes are dominated by scattered light, and thus the observed color indices underestimate the extinction. The implausibly low luminosity is indicative of high circumstellar extinction, originating from an envelope or edge-on disk around the star (e.g. White & Hillenbrand, 2004; Huélamo et al., 2010).
Spectral variability
The temporal behavior of the H line is shown in the upper right panel of Fig. 3. The equivalent widths range from 300 (2003 February 5) to 900 Å (2008 August 28). We measured EW(H)=530 Å at the latest brightness minimum on 2010 December 31. These values are unusually high for classical T Tauri stars (cf. e.g. Fernández et al., 1995; Reipurth et al., 1996), but occur in some very low mass young stars (Comerón et al., 2003), and in Class I stars (White & Hillenbrand, 2004). The shape of the H line is symmetric, except in the spectrum observed in 2007, when P Cygni type absorption can be seen. The accretion-tracer Ca II infrared triplet lines are also significantly weaker in the low-state spectrum in 2005, than in the bright-state spectra (middle right panel of Fig. 3), suggesting that the photometric variations are associated with variable accretion activity (Muzerolle, Hartmann & Calvet, 1998). The He I lines at 5873 and 6678 Å, apparent in the bright-state spectra, but absent from the spectrum obtained in 2005, lead to the same conclusion. Contrary to the permitted emission lines, the forbidden lines [O I] 6300, 6363, [S II] 6717,6731, and [Fe II] 7154 exhibit higher equivalent widths in the dim state, like in the spectra of V1647 Ori (Fedele et al., 2007), PV Cep (Kun et al., 2011), and V1184 Tau (Semkov, 2006).
Accretion rates
The luminosity of the Ca II 8542 emission line is widely used for estimating the accretion rate, applyng the emprical relationship between the line luminosity and accretion luminosity (e.g. Dahm, 2008). For lack of reliable extinction estimate, we can derive only a lower limit for the accretion rate, using as lower limit for the extinction, and assuming that the gas is accreted onto a 1 million year old K7 type star ( M☉, R☉). We obtain for both 2008 and 2009, and some ten times lower value for 2005. These figures imply that the accretion luminosity in bright state is higher than the photospheric one, and changing accretion luminosity can account for most of the observed magnitude difference mag between 2005 September and 2008 October. The whole amplitude of the light curve would require some 100-fold variation in the accretion rate.
4 Possible nature of [KOS94] HA 11
Large-amplitude optical photometric variations of young stars result from changing of either the accretion rate or the line-of-sight extinction. The near-infrared color-color diagram of [KOS94] HA 11 (Fig. LABEL:Fig_ir) does not support the variable extinction scenario. The variable H, Ca II, and He I emission suggest that variable accretion may govern the photometric variability. Our results suggest that the accretion rate increased by an order of magnitude between 2005 September and 2008 August. The P Cygni absorption in the H line in 2007, which disappeared by 2008 August, indicated a temporary wind activity, probably associated with invigorated accretion. It resembles the behavior of the enigmatic eruptive star PV Cep during the outburst in 1977–1979 (Cohen et al., 1981). The bluer than average color index, and the appearance of the He I emission lines in the spectrum at the same epoch may suggest that a high-temperature component – a hot region associated with an accretion shock – appeared in the star-disk system in 2006–2007.
The brightening in 2000 might have resulted from a similar event, indicating repetitive outbursts. Exor outbursts are also repetitive, but their light curves are characterized by several-year-long quiescent periods and weeks or months timescale outbursts. The bright and faint phases of [KOS94] HA 11 have comparable lengths. The morphology of the light curve resembles that of V1647 Ori (bottom left panel of Fig. 2), whose outbursts in 2003–2005 and 2008 are separated by a three-year-long period of quiescence. Timescales of accretion bursts and the variations in the star–disk system associated with the eruption depend on the physics of the circumstellar environment of the stars. The increasing number of young eruptive stars apparently different from both FUors and EXors suggest that the present picture of the mechanisms of episodic accretion bursts still has to be refined. [KOS94] HA 11 may be a new member of yet unclassified eruptive young stars. The star currently undergoes significant brightness changes. Detailed monitoring across the recent period of high activity may give valuable information on the mechanism of outburst, and its effects on the disk structure and evolution.
Acknowledgements
Our observations were supported by the OPTICON. OPTICON has received research funding from the European Community’s Sixth Framework Programme under contract number RII3-CT-001566. We thank Calar Alto Observatory for allocation of Director’s discretionary time to this programme. This work makes use of observations made with the Spitzer Space Telescope, which is operated by the Jet Propulsion Laboratory, California Institute of Technology under a contract with NASA. Financial support from the Hungarian OTKA grant K81966 is acknowledged.
References
- Acosta-Pulido et al. (2007) Acosta-Pulido, J. A. et al. 2007, AJ, 133, 2020
- Aspin et al. (2008) Aspin, C., Beck, T. L., & Reipurth, B. 2008, AJ, 135, 423
- Aspin & Reipurth (2009) Aspin, C., & Reipurth, B. 2009, AJ, 138, 1137
- Aspin et al. (2010) Aspin, C., Reipurth, B., Herczeg, G. J., & Capak, P. 2010, ApJ, 719, 50
- Aspin et al. (2009) Aspin, C., Briceno, C., Downes, J., Hernández, F., & Rojas, R. 2009, IAU Circ., 9079
- Audard et al. (2010) Audard, M. et al. 2010, A&A, 511, A63
- Bibo & Thé (1991) Bibo E. A., & Thé P. S. 1991, A&AS, 89, 319
- Briceño et al. (2004) Briceño, C. et al. 2004, ApJ, 606, L123
- Brittain et al. (2010) Brittain, S. D., Rettig, T. W., Simon, Th., Gibb, E. L., & Liskowsky, J. 2010, ApJ, 708, 109
- Cardelli, Clayton, & Mathis (1989) Cardelli, J. A., Clayton, G. C., & Mathis, J. S. 1989, ApJ, 345, 245
- Cohen et al. (1981) Cohen M., Kuhi L. V., Harlan E. A., & Spinrad H. 1981, ApJ, 245, 920
- Comerón et al. (2003) Comerón, F., Fernández, M., Baraffe, I., Neuhäuser, R., & Kaas, A. A. 2003, A&A, 406, 1001
- Dahm (2008) Dahm, S. E. 2008, AJ, 136, 521
- Fedele et al. (2007) Fedele, D., van den Ancker, M. E., Petr-Gotzens, M. G., & Rafanelli, P. 2007, A&A, 472, 207
- Fernández et al. (1995) Fernández, M., Ortíz, E., Eiroa, C., & Miranda, L. F. 1995, A&AS, 114, 439
- Greene et al. (1994) Greene, T. P., et al. 1994, ApJ, 434, 614
- Grinin et al. (2009) Grinin, V. P., Arkharov, A. A., Barsunova, O. Yu., Sergeev, S. G., & Tambovtseva, L. V. 2009, Ast.Let. 35, 114
- Grosso et al. (2005) Grosso, N. et al. 2005, A&A, 438, 159
- Hartigan et al. (1994) Hartigan P., Strom K. M., & Strom S. E. 1994, ApJ, 427, 961
- Huélamo et al. (2010) Huélamo, N., et. al. 2010, A&A, 523, A42
- Ivezić et al. (2007) Ivezić, Z., et al. 2007, ASPC, 364, 165
- Kastner et al. (2004) Kastner, J. H. 2004, Nature, 430, 429
- Kenyon & Hartmann (1995) Kenyon S. J., & Hartmann L. 1995, ApJS, 101, 117
- Kirkpatrick et al. (1991) Kirkpatrick, J. D., Henry, T. J., & McCarthy, D. W. 1991, ApJS, 77, 417
- Kóspál et al. (2011) Kóspál, Á., et al. 2011, A&A, 527, A133
- Kun (2008) Kun, M. 2008, IBVS, 5850
- Kun et al. (1994) Kun, M. et al. 1994, A&A, 292, 249
- Kun et al. (2011) Kun, M. et al. 2011, MNRAS, in press (arXiv:1101.2329)
- Meyer et al. (1997) Meyer, M. R., Calvet, N., & Hillenbrand, L. A. 1997, AJ, 114, 288
- Muzerolle, Hartmann & Calvet (1998) Muzerolle, J., Hartmann L., & Calvet, N. 1998, AJ, 116, 2965
- Prosser et al. (1991) Prosser, C. F., Stauffer, J., & Kraft, R. P. 1991, AJ, 101, 1361
- Reipurth et al. (1996) Reipurth, B., Pedrosa, A., & Lago, M.T.V.T. 1996, A&AS, 120, 229
- Scholz et al. (2009) Scholz, A., Xu, X., Jayawardhana, R., Wood, K., Eislöffel, J., & Quinn, C. 2009, MNRAS, 398, 873
- Semkov (2006) Semkov, E. H. 2006, AN, 327, 328
- Stetson (2000) Stetson, P. B. 2000, PASP, 112, 925
- Turner et al. (2010) Turner, N. J., Carballido, A., & Sano, T. 2010, ApJ, 708, 188
- White & Hillenbrand (2004) White, R. J., & Hillenbrand, L. A. 2004, ApJ, 616, 998


missing\endcaptionFig_ir
| Date | MJDaaJD | Band | Mag | mag | SourcebbTelescope/instrument or data base for the magnitude |
|---|---|---|---|---|---|
| yyyymmdd | |||||
| 19991028 | 1480.5 | J | 16.49 | 0.13 | 2MASS |
| 19991028 | 1480.5 | H | 14.68 | 0.06 | 2MASS |
| 19991028 | 1480.5 | Ks | 12.92 | 0.03 | 2MASS |
| 19991208 | 1521.5 | IC | 18.55 | 0.05 | Schmidt/Photometrics |
| 20000927 | 1815.5 | IC | 16.05 | 0.05 | Schmidt/Photometrics |
| 20011017 | 2193.5 | V | 18.55 | 0.05 | RCC/Wright |
| 20011017 | 2193.5 | RC | 16.92 | 0.05 | Schmidt/Photometrics |
| 20011017 | 2193.5 | IC | 15.72 | 0.05 | Schmidt/Photometrics |