New optical reddening maps
of the Large and Small Magellanic Clouds
Abstract
We present new reddening maps of the Small and Large Magellanic Cloud based on the data of the third phase of the Optical Gravitational Lensing Experiment (OGLE III). We have used two different methods to derive optical reddening maps. We adopt a theoretical mean unreddened colour for the red clump in the SMC and LMC, respectively. We subdivide the photometric data for both Clouds into subfields and calculate the difference between the observed red clump position and the theoretical value for each field, which provides us with the reddening value in . Furthermore reddening values are obtained for 13490 LMC RR Lyrae ab and 1529 SMC RR Lyrae ab stars covering the whole OGLE III region of the MCs. The observed colours of the RR Lyrae stars are compared with the colour from the absolute magnitudes. The absolute magnitude of each RR Lyrae star is computed using its period and metallicity derived from Fourier decomposition of its lightcurve.
In general we find a low and uniform reddening distribution in both Magellanic Clouds. The red clump method indicates a mean reddening of the LMC of mag, while for the SMC mag is obtained. With RR Lyrae stars a median value of mag for the LMC and mag for the SMC is found. The LMC shows very low reddening in the bar region, whereas the reddening in the star-forming leading edge and 30 Doradus is considerably higher. In the SMC three pronounced regions with higher reddening are visible. Two are located along the bar, while the highest reddening is found in the star-forming wing of the SMC. In general the regions with higher reddening are in good spatial agreement with infrared reddening maps as well as with reddening estimations of other studies. The position-dependent reddening values from the red clump method are available via the German Astrophysical Virtual Observatory interface at http://dc.zah.uni-heidelberg.de/mcx
Subject headings:
(Galaxies:) Magellanic Clouds — dust, extinction – Stars: variables: RR Lyrae1. Introduction
The gas rich and star-forming Small Magellanic Cloud (SMC) and Large Magellanic Cloud (LMC) are the most massive galaxies orbiting the Milky Way. They are used in many ways as benchmarks, for instance, for studies of star formation at lower metallicity (e.g. Cignoni et al., 2009; Glatt et al., 2008b; Sabbi et al., 2009) and as calibrators for the cosmological distance scale (Freedman et al., 2001). Large optical and infrared imaging surveys of the Magellanic Clouds (MCs), such as the Optical Gravitational Lensing Experiment (OGLE, Udalski et al., 1992, 2008b, 2008a), the Magellanic Clouds Photometric Survey (MCPS, Zaritsky et al., 1997), the Massive Compact Halo Objects (MACHO) survey (e.g. Alcock et al., 2000; Cook et al., 1992), the Expérience pour la Recherche d’Objets Sombres (EROS, Aubourg et al., 1993) or the Two Micron All Sky Survey (2MASS, Skrutskie et al., 2006), have been completed in recent years. These surveys provide invaluable information about the stellar content of the MCs . But for interpreting the data of these surveys, for deriving star formation histories and for stellar population studies in general the knowledge of the reddening is crucial.
Reddening is caused by gas and dust located between the emitting object and the observer. This leads to dimmer observed magnitudes and redder colours than emitted by the object. The magnitude of absorption and scattering depends on the grain sizes of the dust and on the wavelength of the passing light. For different wavelengths the absorption by dust has a differing effectiveness. The resulting change of the observed colour of the star is defined as and is quoted in the literature as colour excess, selective extinction or reddening. The total extinction can be calculated by adopting an extinction law. Using stars from the local neighbourhood Cardelli et al. (1989) found that an extinction law can be introduced that depends on just one parameter: , which has a typical value of . Gordon et al. (2003) tested various lines of sight to test the local extinction laws for more distant fields in the Galaxy, in the LMC and the SMC. They found that for some fields the law is indistinguishable from the result by Cardelli et al. (1989), but many fields show considerable differences from the local extinction law. This is explained by the different environments probed by the authors. However, Gordon et al. (2003, their Figure 10) show that for the visual wavelength range, which is of interest in our current study, the differences in the extinction laws are quite small. For the visible wavelength range Zagury (2007) confirms that the MCs have a similar extinction law as the Galaxy, while he suggests that for regions with deviations other explanations than a differing reddening law might also be valid. Even though the dust content of the Galaxy is far from being understood these studies show that at optical wavelength adopting the extinction law by Cardelli et al. (1989) is generally a valid assumption.
Reddening maps of the MCs have been obtained by several groups. With infrared data from the 2MASS Dobashi et al. (2008, 2009, herafter D08 and D09) explored the dust content of the LMC and SMC, which can be translated into and compared with reddening maps. The optical data of the MCPS were analysed fitting photometric model predictions of stellar luminosity, effective temperatures and extinctions to apparent U, B, V and I magnitudes for the stars in the MCs. In Zaritsky (1999) an extinction map is constructed by finding the best match between the theoretical values and the observations for a fraction of the LMC field. The whole dataset of the MCPS results in wide area reddening maps of the MCs that are presented in Zaritsky et al. (2002, 2004, hereafter Z02 for the SMC and Z04 for the LMC).
For OGLE II (see Section 2) reddening maps from estimates based on red clump (RC) stars (Udalski et al., 1999a, b) were provided. A similar technique was adopted by Subramaniam (2005, hereafter S05) and Subramanian & Subramaniam (2009, hereafter S09). They measured the position and apparent shift of the RC in the colour magnitude diagram (CMD) with respect to the theoretically unreddened values to analyse the spatial distribution of the reddening in the V- and I-band of the LMC covered by the OGLE II and the OGLE III surveys.
Sturch (1966) introduced a completely different approach of measuring reddening values. He proposed to use the difference between the observed colour and the intrinsic colour of RR Lyrae stars as an indicator for the reddening towards these stars. RR Lyraes are standard candles with distinct relations to calculate absolute magnitudes from the observable parameters apparent magnitude, period and metallicity. These can be used to obtain the intrinsic colour. Pejcha & Stanek (2009, herafter PS09) used this technique for RR Lyrae stars observed by OGLE III to derive a reddening map of the LMC. For their computations they assume that that all RR Lyrae stars share a common metallicity.
Here we present new optical reddening maps for the MCs derived via two different methods. In Section 2 we present the data. In Section 3 we describe the RC method and the resulting reddening maps of the MCs. We use the method of measuring the red clump, introduced by Wozniak & Stanek (1996), in small subfields of the MCs to determine new reddening estimates for both Clouds. As mentioned earlier, in OGLE II the reddening was derived using the RC method (S05 and Udalski et al. (1999a)), while OGLE III leaves this task to the user. Since S09 sample the OGLE III area with a grid of constant subfield size and then apply the RC method in each subfield, some fields are not sufficiently populated to yield a reddening value. The individual reddening values of S09 are not available in tabular form. Using an adjusting field size we are able to circumvent the undersampling problem.
In Section 4 we present the method and results for the RR Lyrae reddening. We calculate the absolute magnitudes of the RR Lyrae taking their metallicity into account, which we obtain from Fourier decomposition of their light curves.
The discussion of the reliability of our reddening determinations and the comparison to other reddening maps are presented in Section 5. Section 6 summarises all results.
2. Data
The OGLE collaboration has been taking data since 1992. In the first phase of OGLE the 1m Swope telescope at Las Campanas Observatory, Chile, was used. With the start of phase II in 1995 OGLE’s own 1.3 m telescope at Las Campanas became operational. In the first two phases OGLE used a pixel camera with a field of view of . The data were taken preferentially in the I-band. In total 2.4 square degrees in the SMC and 4.5 square degrees in the LMC (Udalski et al., 1992, 1997) were covered. In 2001 the third phase (OGLE III) began and ran until mid 2009. With a mosaic of 8 CCDs with a total of pixels a field of view of was observed at once (Udalski, 2003). Overall the fields cover 14 square degrees for the SMC and nearly 40 square degrees for the LMC. These observations provide photometry and astrometry in the I- and V-band for 6.2 million stars in the SMC and for about 35 million stars for the LMC (Udalski et al., 2008a, b). The point source catalogues111The catalogues are available and downloaded from http://ogle.astrouw.edu.pl/ are divided into 40 fields for the SMC and 116 fields for the LMC. The 41st SMC field targets the massive Galactic globular cluster 47 Tuc and is ignored in our study.
3. Reddening based on the red clump
3.1. Method
Our goal is to infer a reddening map for both Clouds using the mean position of the RC in a CMD.
For this purpose we define a selection box in colour-magnitude space. All stars between mag and mag are taken into account for the determination of the mean locus of the RC in the LMC fields (see Figure 1). These boundaries correspond to the selection box used by S05 (S09 adopts the methods and specifications of S05). For the SMC the limits in colour are chosen as in the LMC, but due to the greater distance, the box is shifted by 0.3 mag towards fainter I-band magnitudes.
To find an adequate number of stars the size of each field has to be carefully chosen. With a low number of stars the uncertainty in determining the mean colour would increase, while too large a number of stars prevents a map with details on smaller scales. We want to define a grid that allows us to obtain reddening information on scales as small as possible across the OGLE III field. Due to the density differences between the central parts and the outskirts of the Clouds we have to adjust the subfield sizes in dependence of the absolute number of stars in a given area. Our angular resolution is therefore variable and only driven by the available number of stars as listed in Table 1.
The individual fields of the SMC and LMC defined by the OGLE collaboration are large and contain many more stars than needed to find a significant red clump in the colour-magnitude diagram. Therefore our first step for both galaxies is to divide each OGLE field in three, nearly quadratic, subfields. Due to the very different numbers of stars in these subfields we make further subdivisions dependent on the stellar density. If the total number of stars in the selection box in a subfield exceeds a certain threshold, this field is divided further, taking care that the number of RC stars per field does not drop below a few hundred stars. If a quadratic subfield of contains for example more than 40,000 RC stars this field is cut into 64 equally sized fields with an average size of . For different stellar densities Table 1 lists the number of stars of the quadratic subfield in the first column, while the number of equally sized subfields and the dimensions of the finally evaluated fields are given in the second and third column, respectively.
| of Stars | of subfields | size [arcmin] |
|---|---|---|
| 40,000 | 64 | 4.5 4.5 |
| 12,000 | 16 | 9 9 |
| 3,000 | 4 | 18 18 |
| 3,000 | 1 | 36 36 |
In total we divide the LMC into 3174 subfields, while the SMC reddening is examined in 693 subfields. The number of RC stars in each examined subfield varies in the LMC from 260 to 4046, with an average number of 1257 RC stars in each field. For the SMC the least populated field has 477 RC stars, while the population reaches its maximum at 3635. On average 1318 RC stars are located in each field.

In theory all RC stars have a well-defined mean colour . This colour only depends on the mean metallicity and the age of the population. Girardi & Salaris (2001) examined theoretical RC colours in dependence of metallicity and computed mean values for . For the LMC we adopt mag () from the work by Olsen & Salyk (2002), who inspected red clump stars to test for a warp in the LMC. For the SMC, due to the lower metallicity (; Cole, 1998; Glatt et al., 2008a), mag is used. In Udalski et al. (1998) a similar value for the unreddened RC of the SMC was used.
Due to reddening effects by interstellar dust and gas the mean colour of the clump is shifted redwards, which we denote as . By calculating the difference between the theoretical value and the observed colour of the field the reddening can be obtained with .
To find the mean colour of the RC the histogram of the RC colour distribution (Figure 2) is fitted with a Gaussian plus a second order polynomial. The maximum of this function is assumed to be the mean colour of the clump. Different effects contribute to a broadening of the peak, such as the intrinsic scatter around the mean locus, photometric errors, the range of ages, differential reddening, the presence of binaries or differences in metallicity as well as contributions of red giants and red horizontal branch stars.

The mean reduced of the fits is 1.03 for the LMC, indicating that a Gaussian provides a good approximation to the data. Fields with a reduced were removed from the sample and then inspected by eye to check whether the mean location of the RC was correctly identified. Only 4 of the 3174 subfields in the LMC needed further inspection. For the SMC 34 out of 693 fields had a reduced , while the is 1.52. The deviant LMC and SMC subfields are mostly affected by a strong red giant branch, which leads to a second bump in the histogram. The small displacements of the mean colour are taken into consideration in the calculation of the uncertainties and hence no fields were rejected.
3.2. Results for the LMC
.
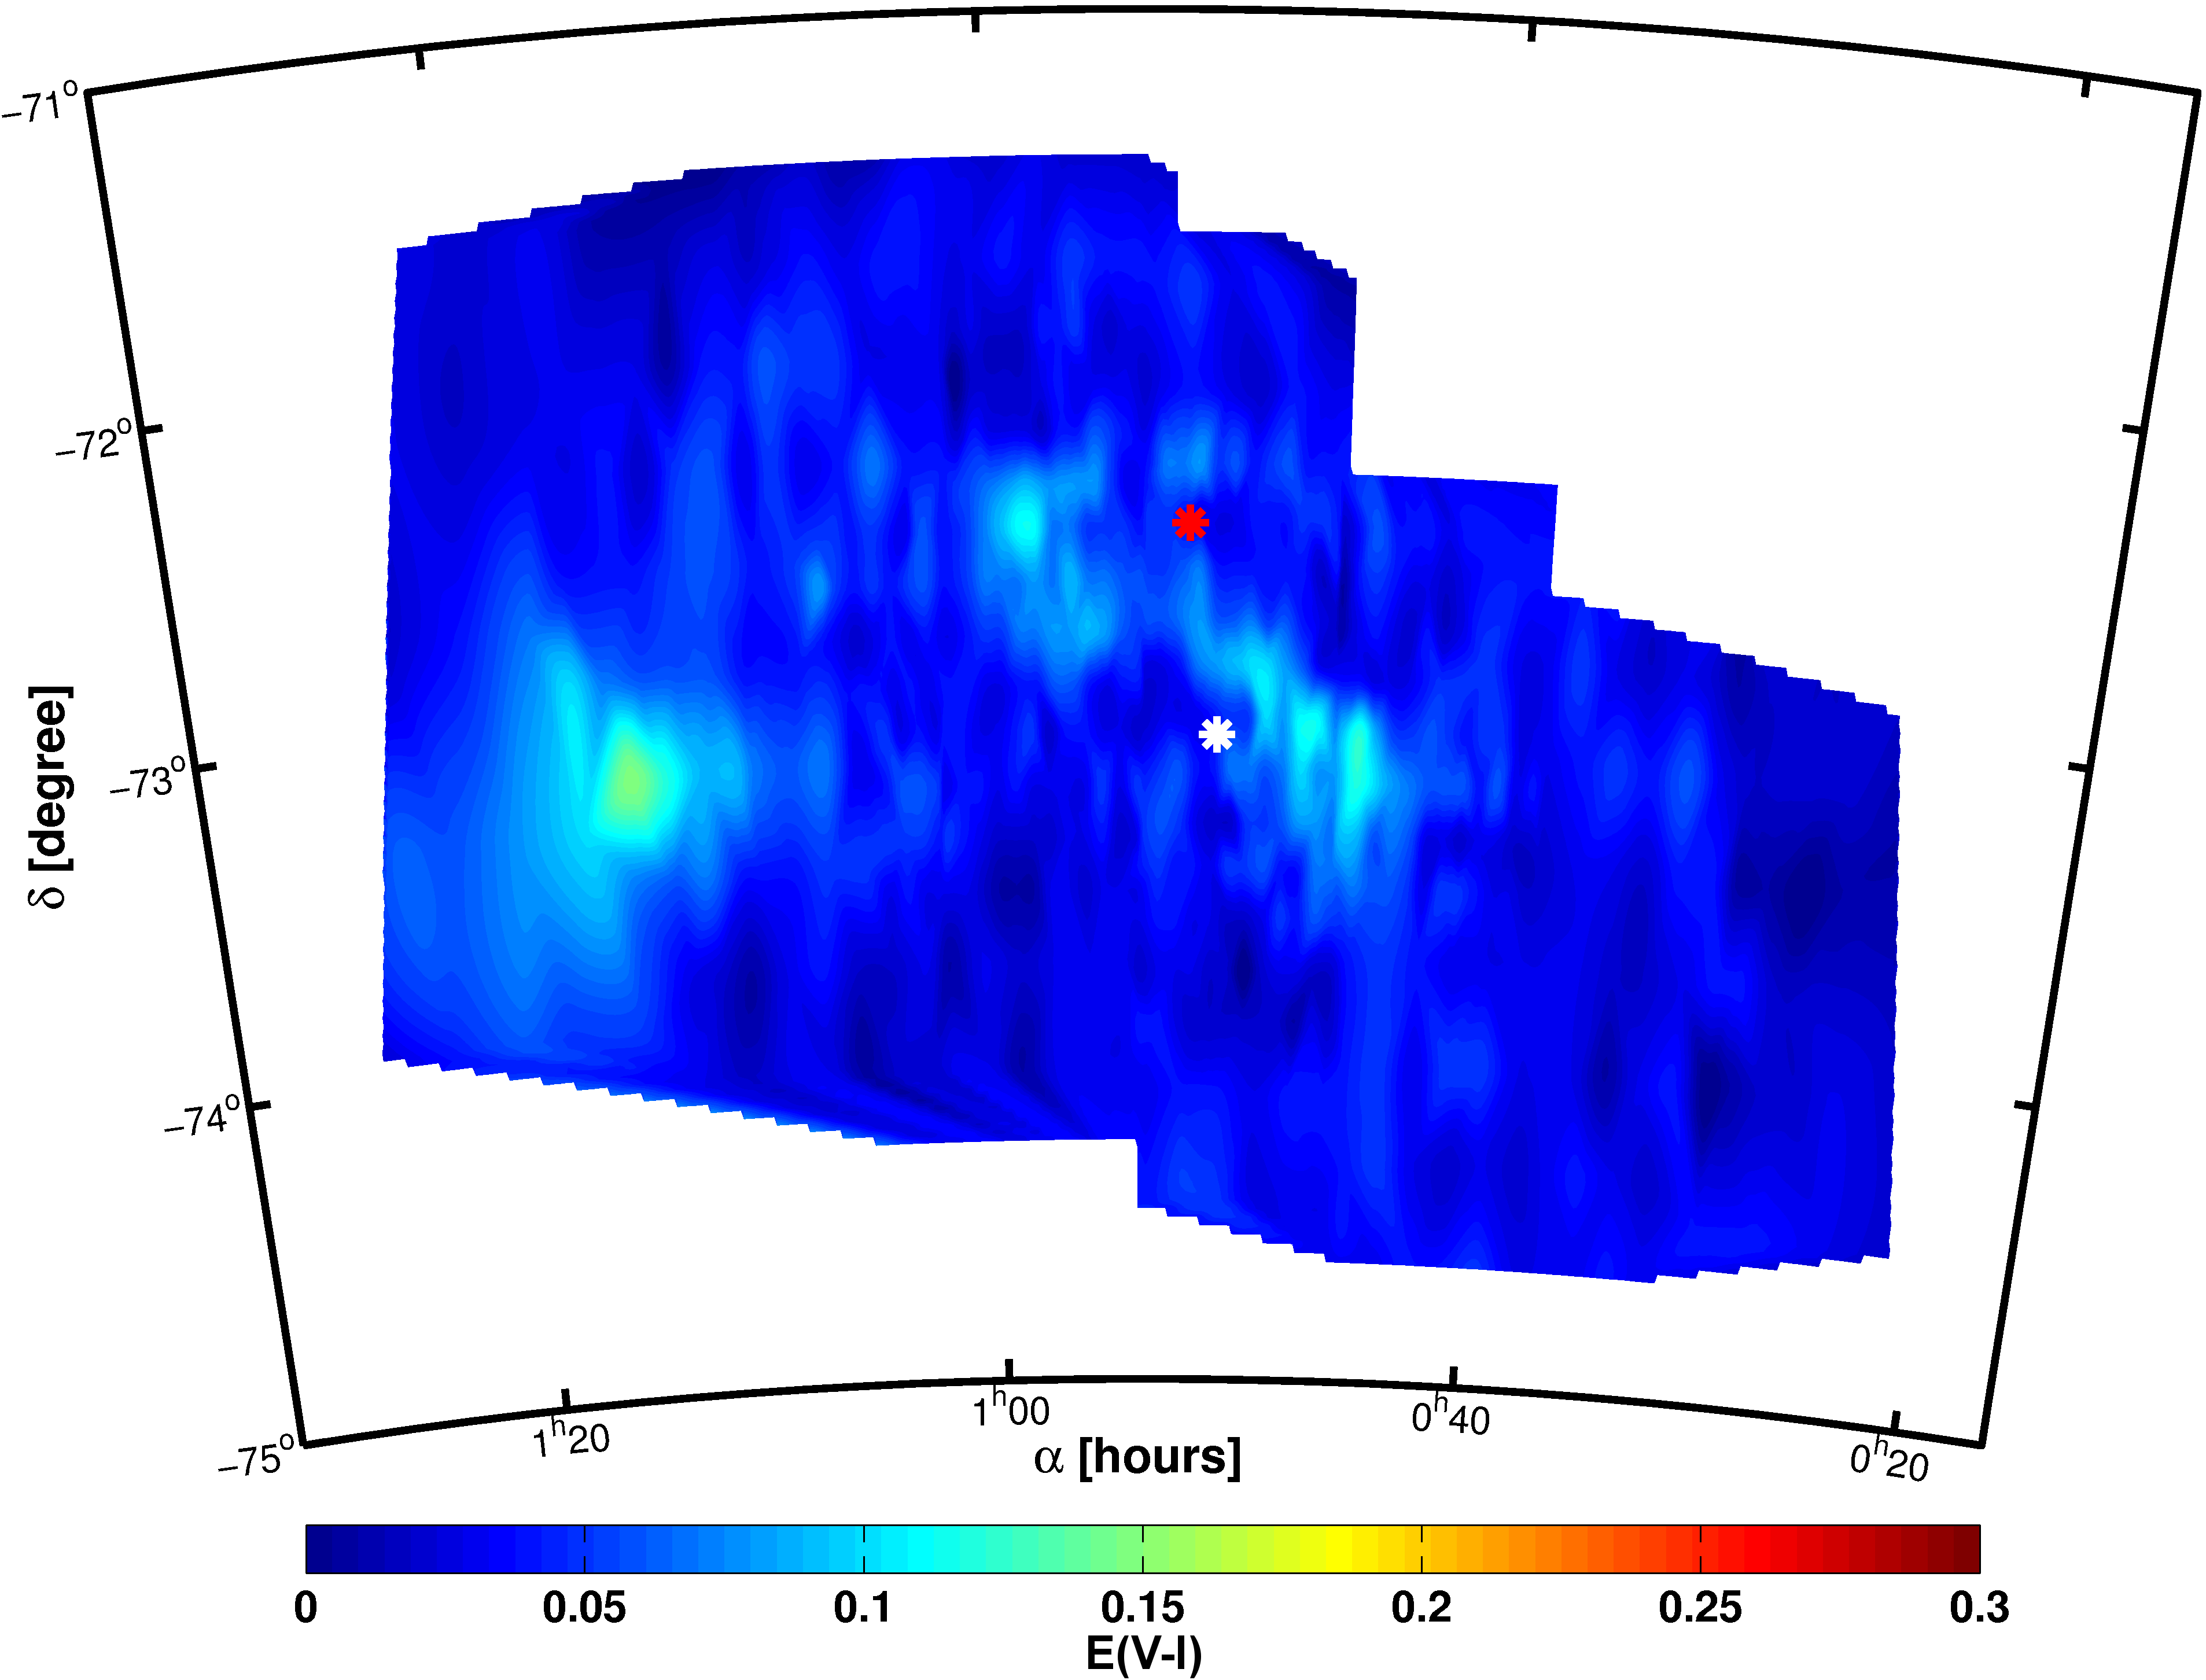
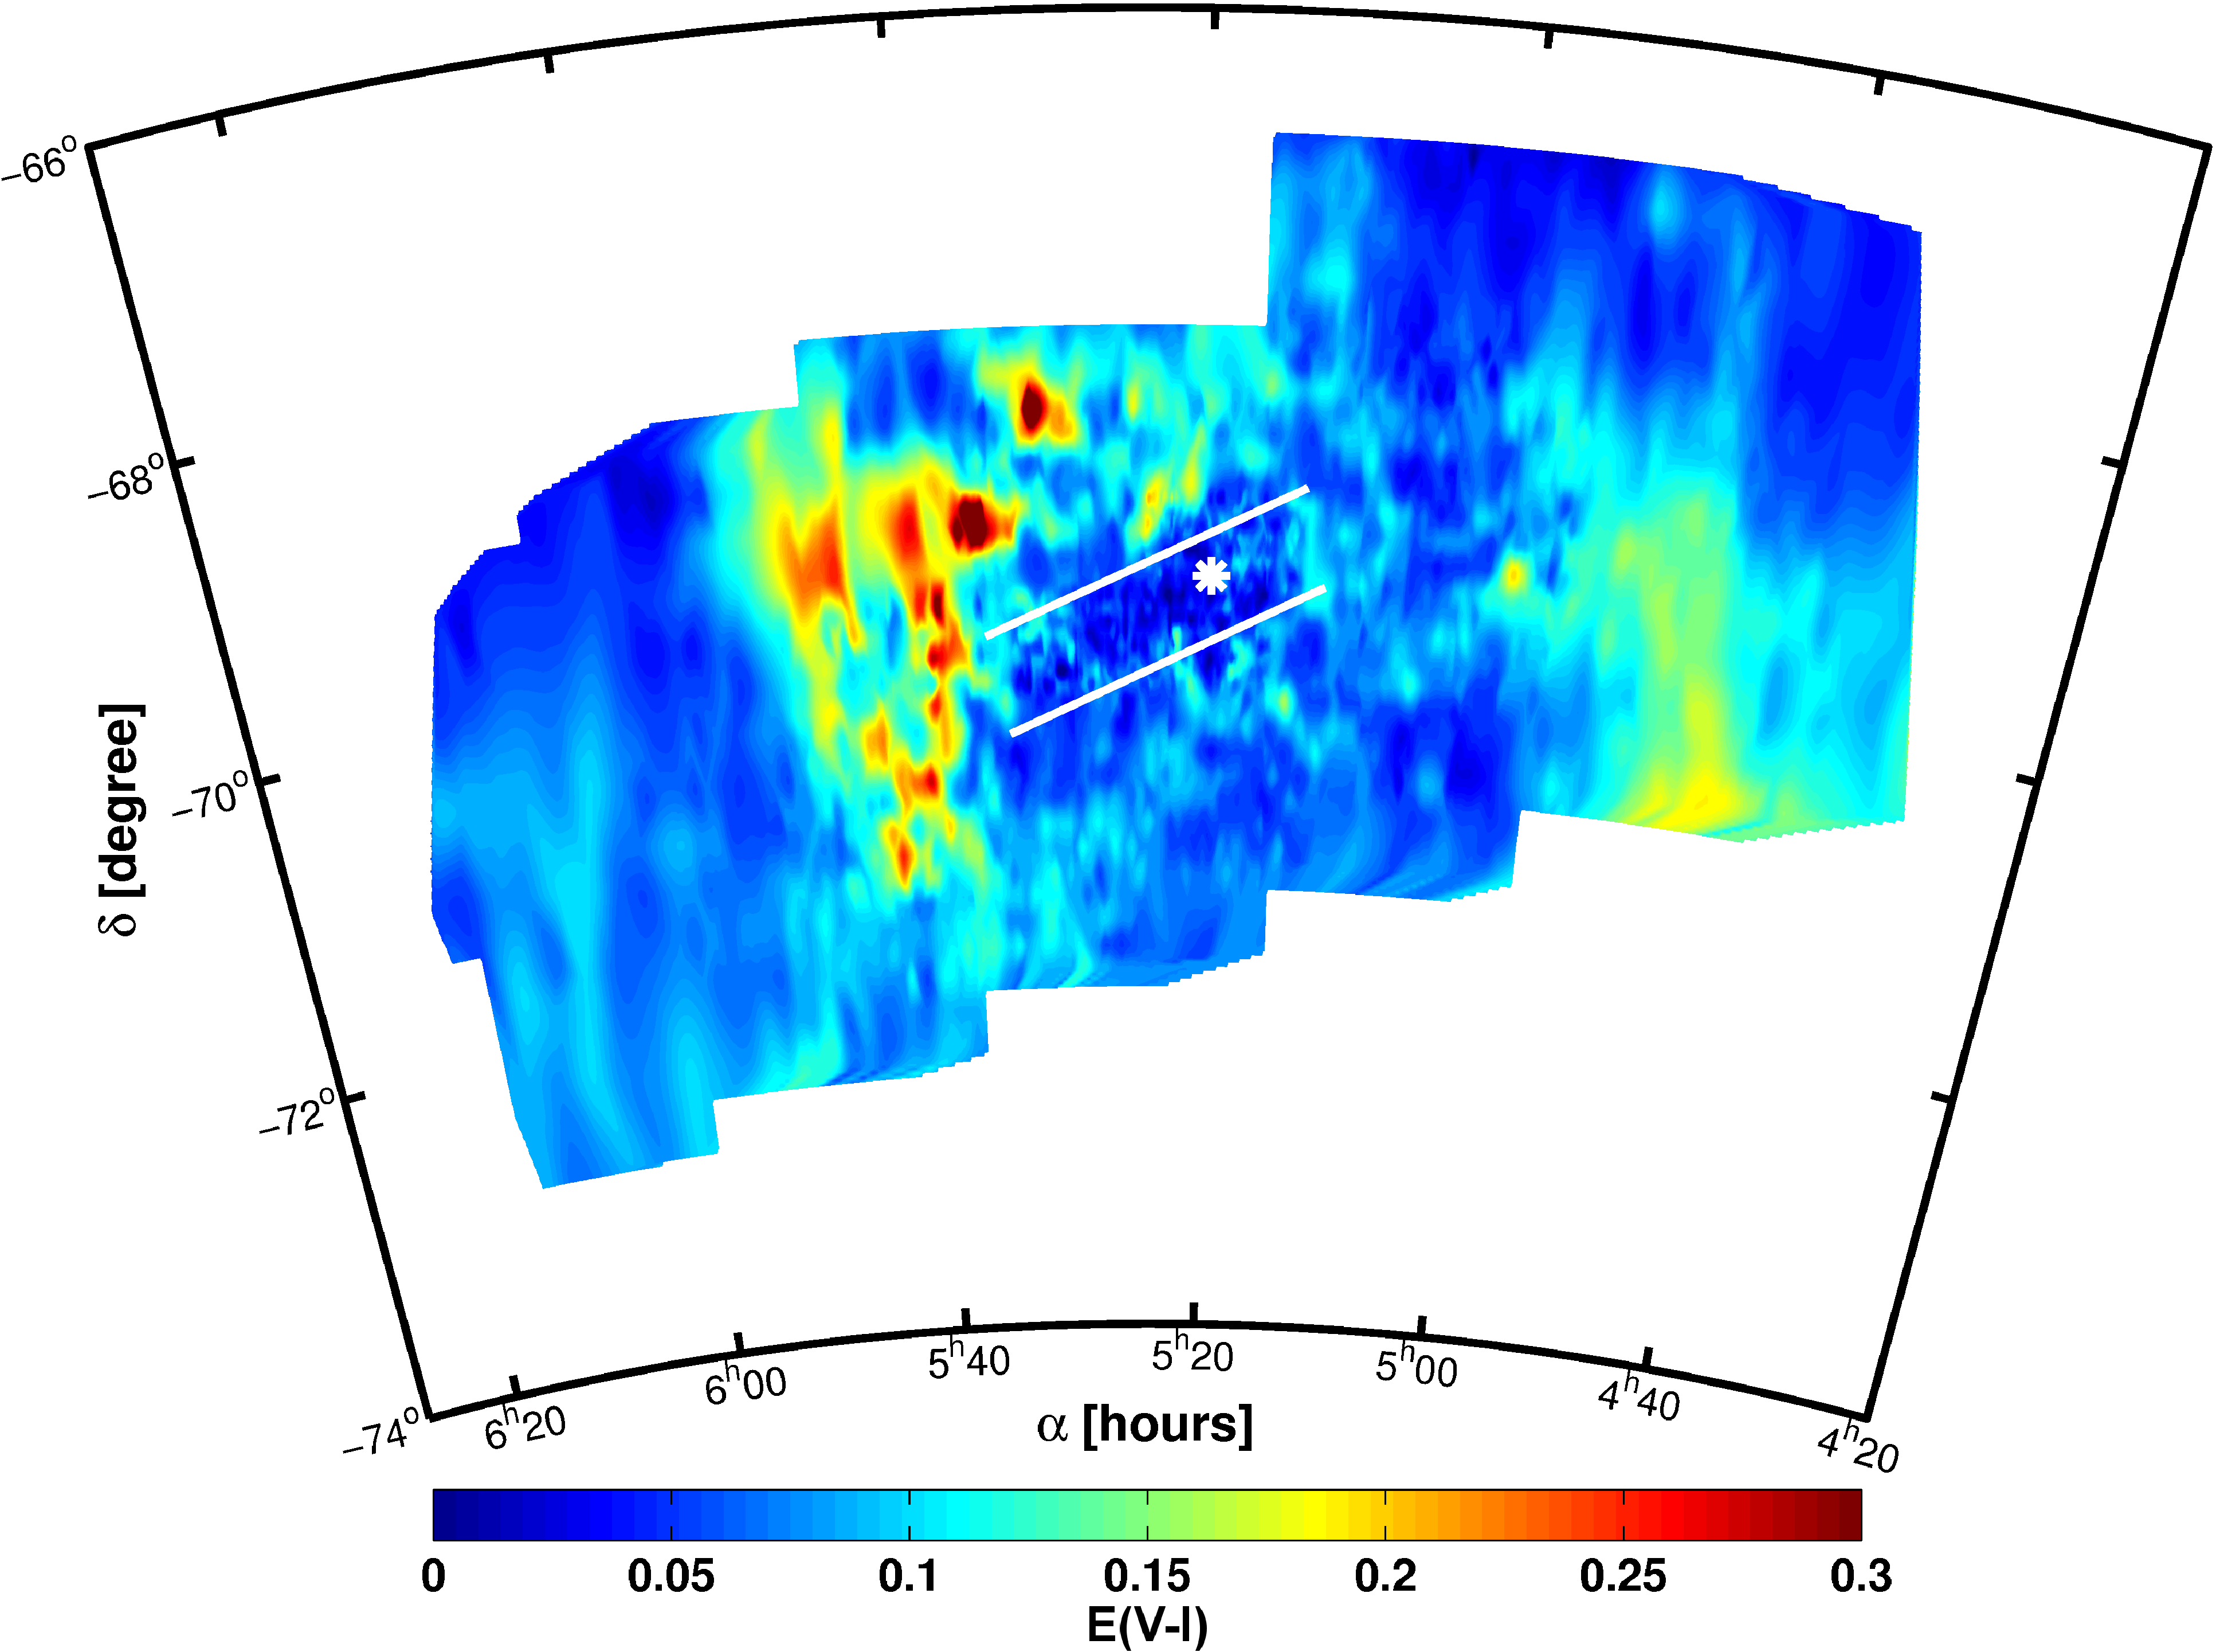
The unreddened value was subtracted from the estimated mean RC colours of each of the 3174 subfields in the LMC. The difference corresponds to the mean reddening value . These reddening values are plotted in spatially resolved contour maps (Figures 4 and 4).
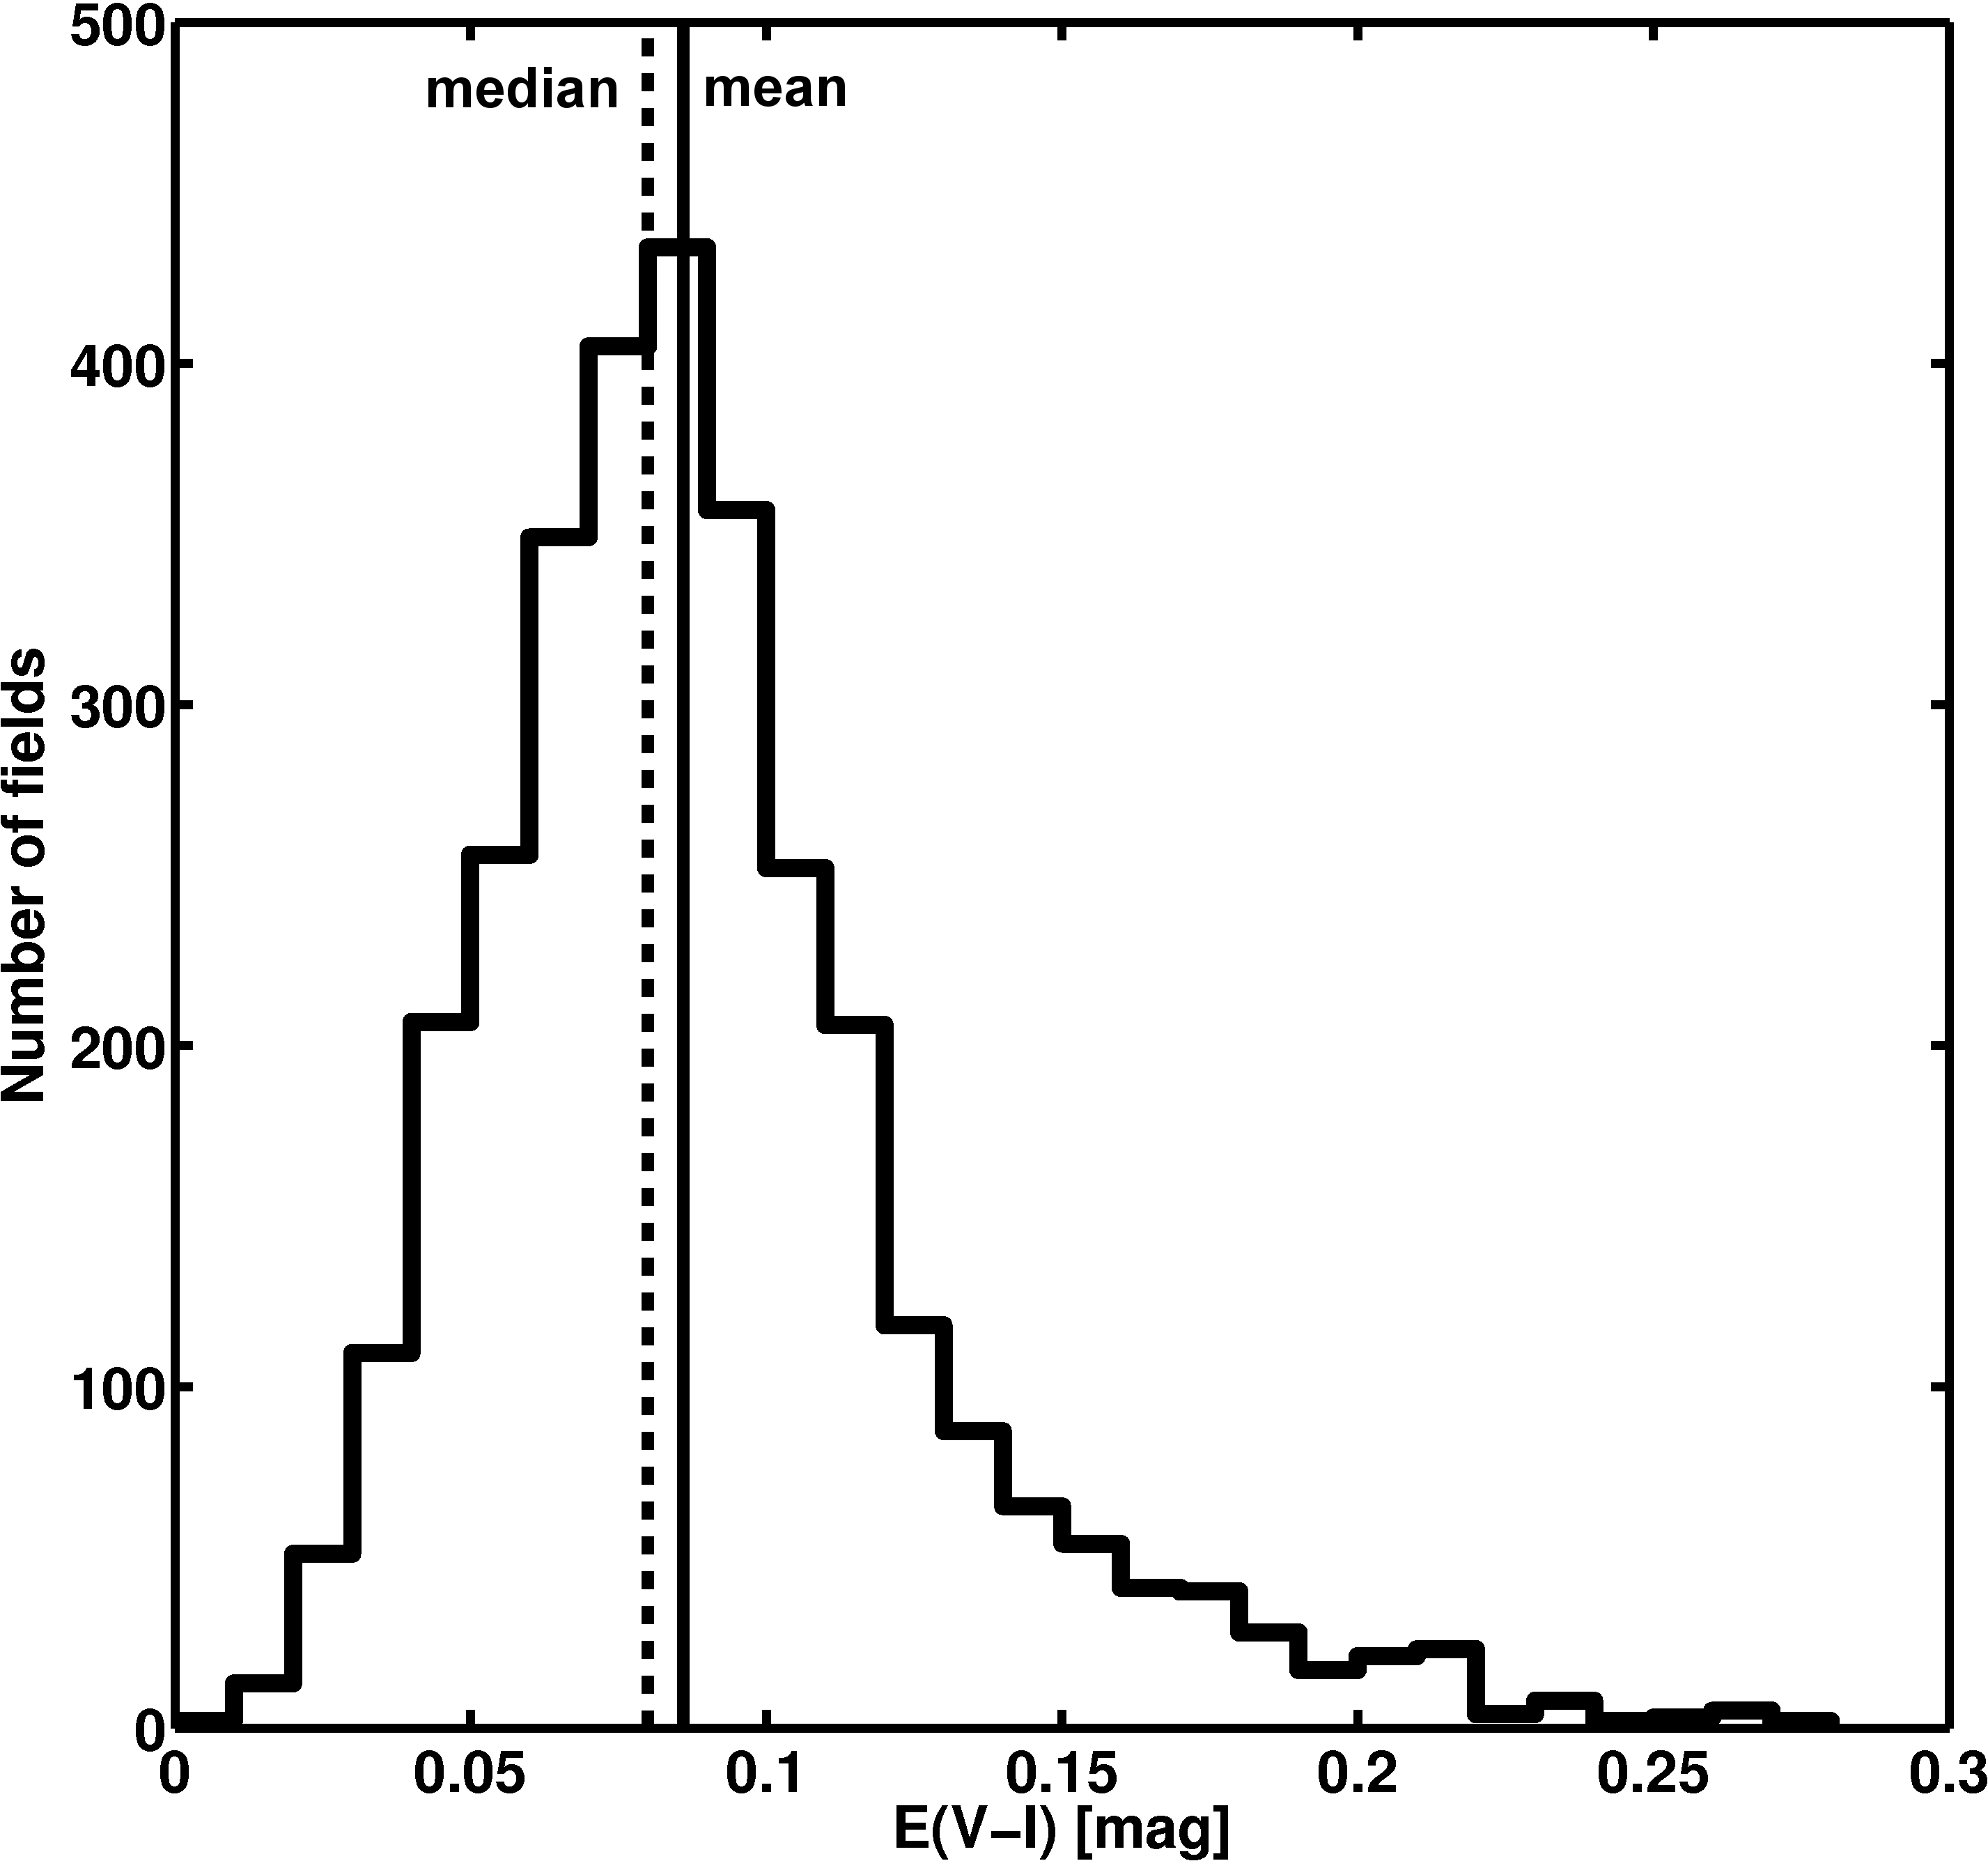
In the LMC we find a mean reddening of mag and a median value of mag (see Figure 5). In the central regions, which correspond to the bar, the reddening is quite low. Towards the leading edge of the LMC the reddening increases and reaches its highest values with mag close to the centre of 30 Doradus. Its centre is located at and (Høg et al., 2000). In the southwestern part of the observed field ( and ) there is a second area with higher reddening visible. There is only one field with a negative reddening in the dataset. But within the uncertainties this value is consistent with zero.
The uncertainty of the reddening values is determined by calculating the of the gaussian distribution of the stars within the selection box. This represents the broadening of the RC due to metallicity effects, binaries and differential reddening. For the LMC the mean error is mag. The photometric errors of the observed magnitude of the stars are low due to the large number of repeat observations in the OGLE III survey. This leads to a very precise photometry with an average uncertainty of mag for each star. Each field contains a large number of stars, therefore this error can be neglected.
Since the central regions contain many more stars than the outskirts of the LMC, the subfields for the determination of the reddening are much smaller than in the outer regions. Therefore, a lot more substructure can be seen here in the reddening map in Figure 4.
Regions with high reddening

A minor fraction of of the LMC fields show considerable reddening with values of mag. These 60 fields are inspected by eye and only 23 fields with reddening values of mag suffer from a very extended red clump, which is caused by differential reddening (Figure 6). The reddening results in these regions are reanalysed by shifting the RC box to mag and mag and refitting the distribution of stars as described above. The results are shown in Table 2. While the peak of the reddening distribution of the field is only marginally shifted, we find a considerable amount of differential reddening for most of the fields. This differential reddening does not follow a Gaussian distribution, but instead typically shows a rapid rise from low reddening to the peak of the distribution, whereas there is a much more shallow and much wider tail towards higher reddening. To determine an estimate for the width of the distribution we calculate the mean of each distribution. To each side of the mean of the RC we include 34.1% of all stars and determine the colour of the star just outside this border (vertical lines in Figure 7). This corresponds to a width of .

| fieldsize | ||||
|---|---|---|---|---|
| 82.717 | -68.428 | 0.26 | ||
| 82.856 | -68.428 | 0.35 | ||
| 82.995 | -68.428 | 0.43 | ||
| 83.659 | -69.174 | 0.26 | ||
| 83.802 | -69.174 | 0.31 | ||
| 83.802 | -69.020 | 0.25 | ||
| 83.839 | -69.172 | 0.38 | ||
| 83.839 | -69.018 | 0.34 | ||
| 83.982 | -69.172 | 0.38 | ||
| 83.982 | -69.018 | 0.33 | ||
| 84.125 | -69.172 | 0.28 | ||
| 84.125 | -69.018 | 0.34 | ||
| 84.268 | -69.172 | 0.32 | ||
| 84.268 | -69.018 | 0.26 | ||
| 85.055 | -69.095 | 0.27 | ||
| 84.687 | -69.918 | 0.27 | ||
| 84.687 | -69.611 | 0.32 | ||
| 84.834 | -69.918 | 0.28 | ||
| 84.981 | -69.611 | 0.26 | ||
| 84.824 | -70.201 | 0.26 | ||
| 84.975 | -70.661 | 0.28 | ||
| 85.605 | -71.099 | 0.25 | ||
| 86.397 | -69.401 | 0.25 |
Differential Reddening
For every subfield the mean reddening of all RC stars is measured. Therefore we do not take into account that the dust content may not be evenly distributed within a given subfield. By including of all stars on both sides from the maximum, we define the width of the distribution, which we use as a measure of the amount of differential reddening.
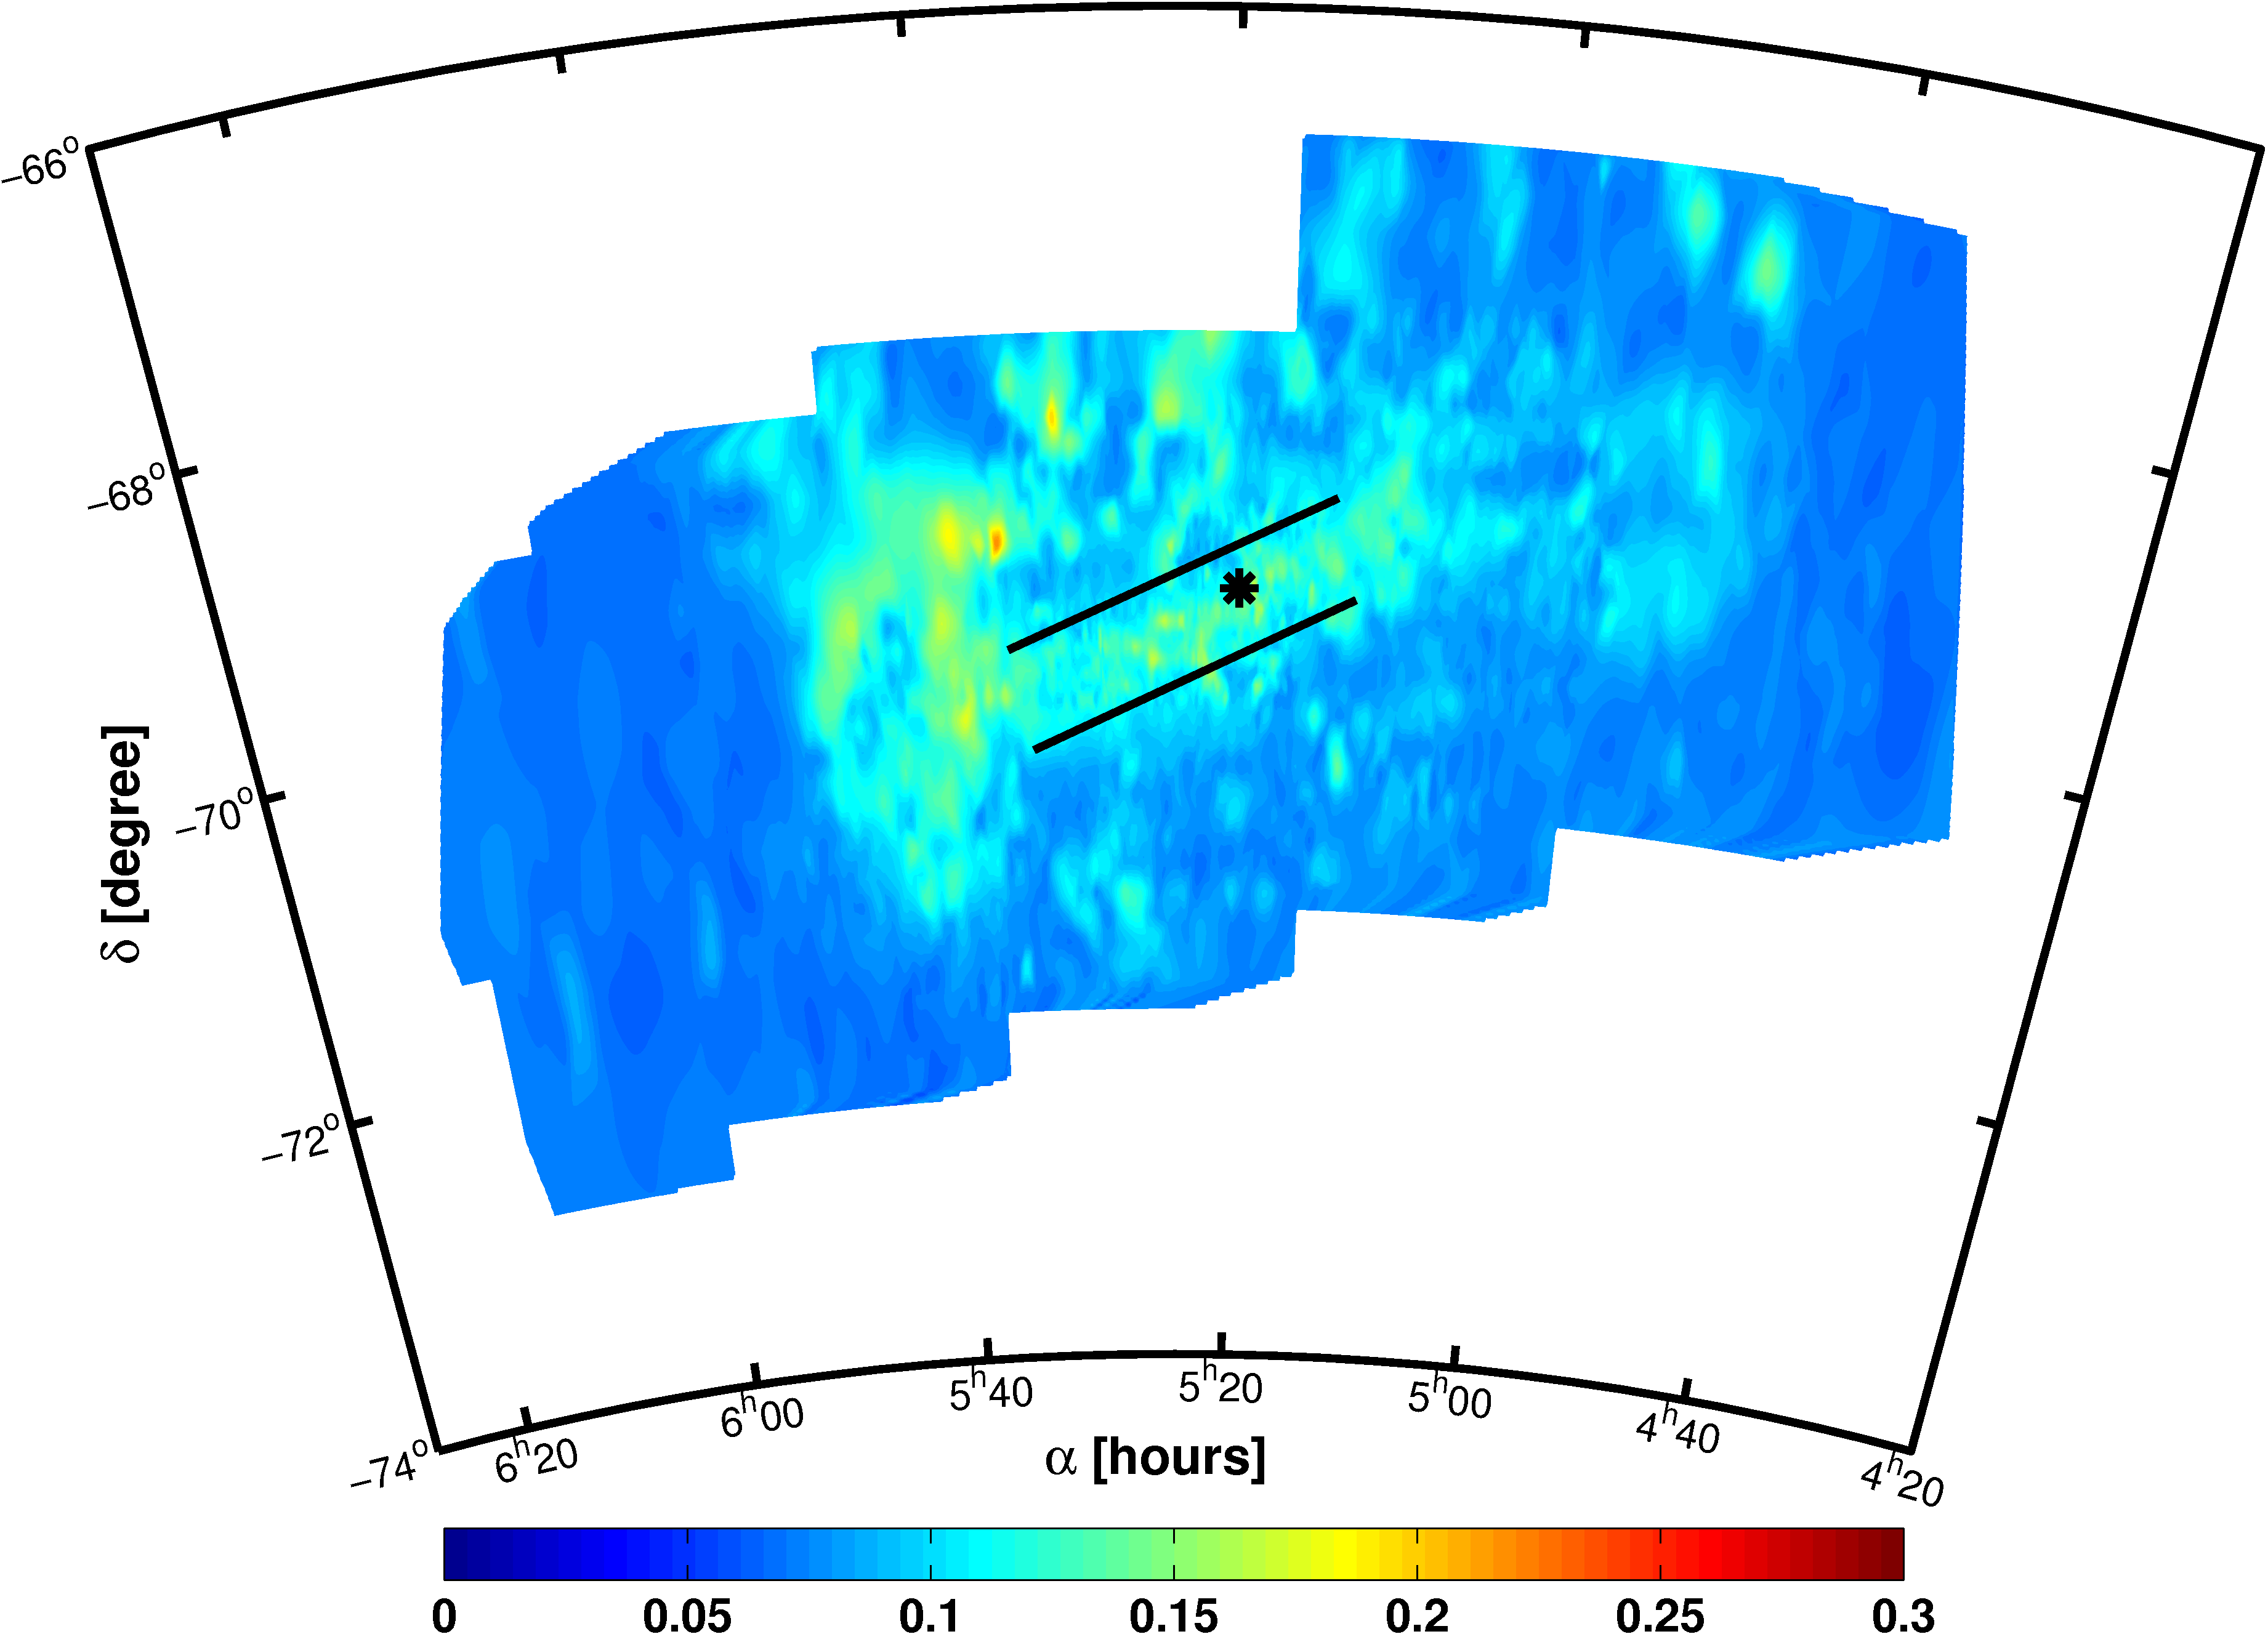
Figure 8 shows the distribution of differential reddening in the LMC. The regions with high reddening from Figure 4 are prominent in the differential reddening map as well. Another region with a considerable spread of the distribution is the bar. Interestingly, the region of increased reddening in the southwestern part of the LMC does not show up as having higher differential reddening.
3.3. Results for the SMC
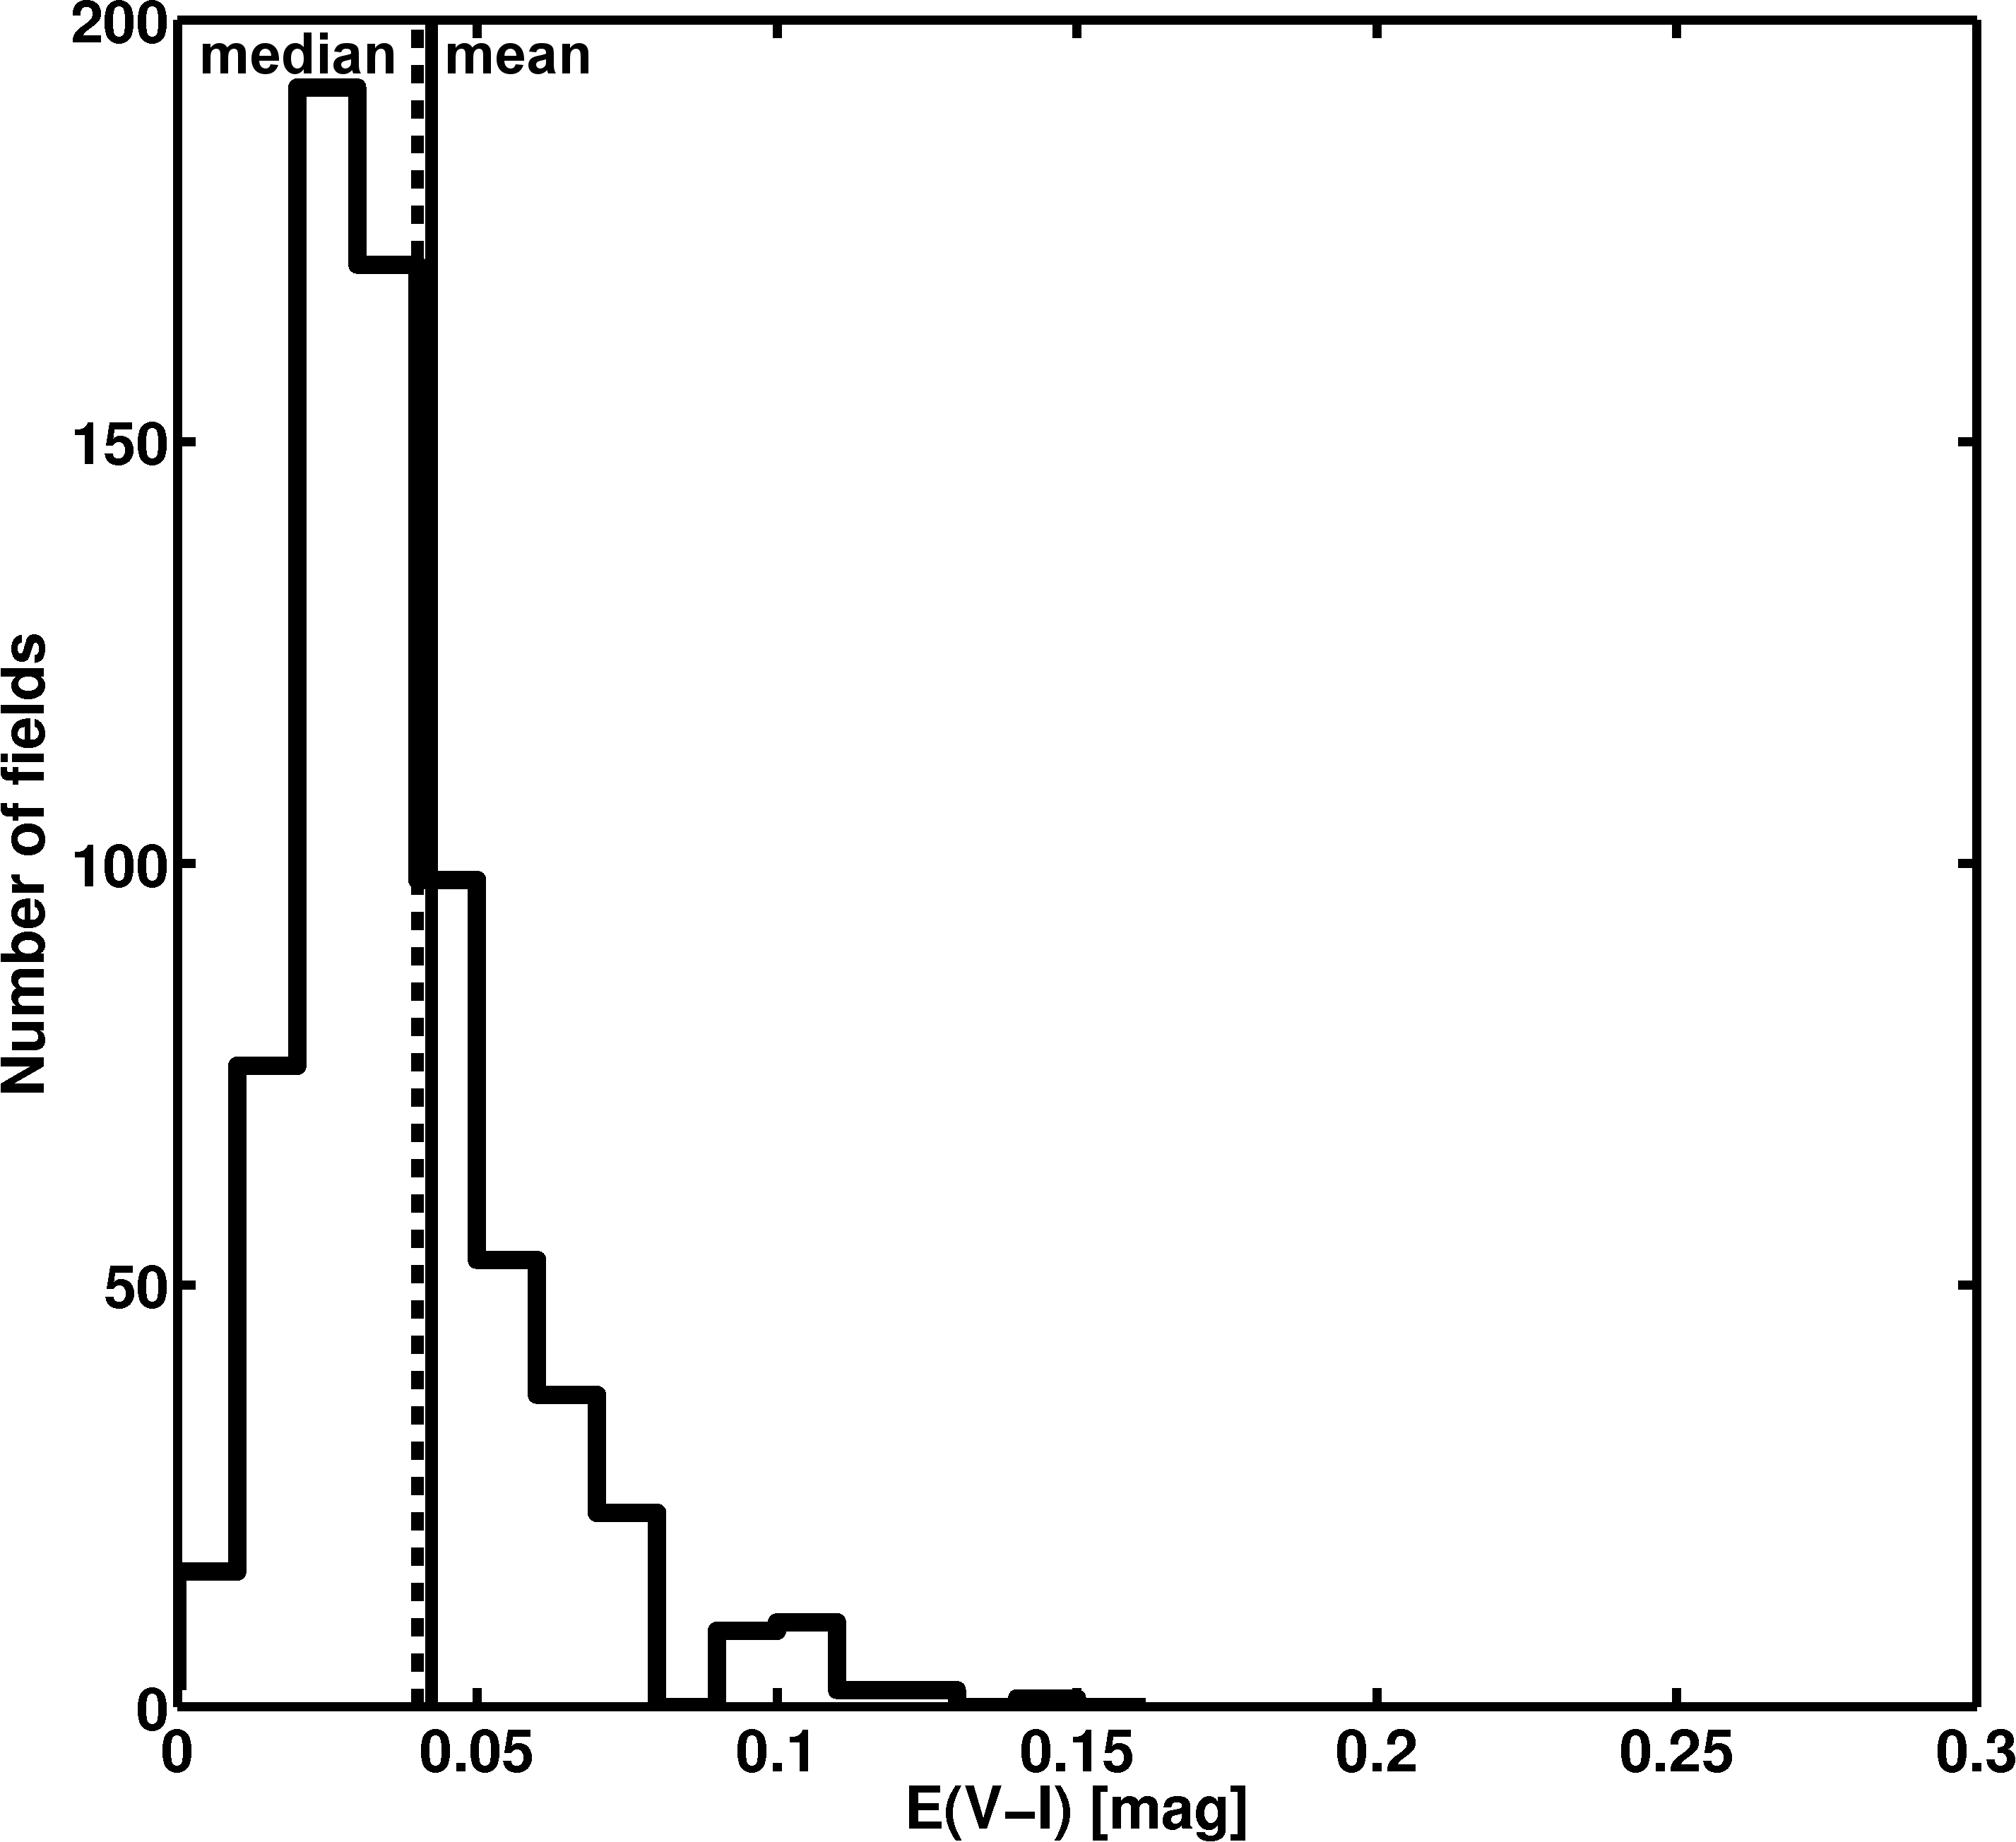
On average the SMC is less reddened than the LMC. For the 693 fields evaluated in the SMC we find the mean and median value to be mag (see Figure 4 and 5). Three main concentrations of higher reddening are revealed in Figure 4. Two of the concentrations are found at and and at and , which coincides with the southwest part and the northern part of the bar, respectively. The overall density of stars is enhanced in these regions. The third area with high reddening is the well known wing of the SMC ( and ). In this region the reddening reaches its maximum with a value of 0.16 mag. In all regions with high reddening multiple H II regions are located (Livanou et al., 2007). The lowest calculated reddening is 0.00 mag. The uncertainty is calculated in the same manner as for the LMC. The same error sources are present and the photometry is as good as for the LMC. We find a mean uncertainty of 0.06 mag.
We measure the differential reddening of the SMC in the same manner as for the LMC. For most fields the differential reddening is quite low and only the bar and the wing show considerable differential reddening.
3.4. Data access
We are making the coordinates of the subfields and the derived RC reddening values for both LMC and SMC available via the German Astrophysical Virtual Observatory (http://dc.zah.uni-heidelberg.de/mcx). Using the transformation relations published by Schlegel et al. (1998) the webpage has the capability to calculate extinctions for 19 different filters in four photometric systems.
3.5. Use of the RC reddening data
The reddening maps from the red clump stars cover the complete area of the OGLE III survey. They average the reddening within distinct subfields. For all stars in such a field this value can be used as a reliable indication for the average reddening that these stars are experiencing.
Since RC stars are quite red and cool they may not be the first choice for the dereddening of very young and hot stars (see Grebel & Roberts (1995) who discuss the dependence of heterochromatic extinction on stellar parameters such as temperature and Zaritsky et al. (2002), who discuss variations in reddening maps in dependence of stellar population age). Furthermore the reddening in regions with high dust and gas densities, such as star forming regions, might differ significantly with depth. Our method is not able to account for differential reddening along the line of sight, but averages along the sight line, similar as the Schlegel et al. (1998) maps do for our Milky Way.
Our RC reddening maps are thus useful for applications in which the bulk properties of stellar populations in the MCs are studied. They are also useful for applications where objects are studied whose properties make the derivation of individual reddening difficult (e.g. individual RC stars or individual red giant branch stars). In studies of individual stellar objects (instead of entire stellar populations), users of the reddening maps should be aware of the afore mentioned caveats of using average (as opposed to individual) reddening values.
4. Reddening based on RR Lyrae ab stars
4.1. Method
RR Lyrae stars provide an independent means of deriving reddening values. For the MCs the OGLE collaboration presents lightcurves and photometry of RR Lyrae covering most of the main bodies of these galaxies (Soszyński et al., 2009, 2010). PS09 used these data to infer a reddening map of the LMC. They assumed one single metallicity for all RR Lyrae stars in the LMC, dex (Cohen & Meléndez, 2005), which results in a theoretical intrinsic colour of , with a mean period of 0.57 days for all RR Lyrae in the LMC. However, the spectroscopic studies of RR Lyrae stars in the LMC by Borissova et al. (e.g. 2009) show that a range of metallicities is present. Moreover, Guldenschuh et al. (2005) showed in their work that the metallicity of the RR Lyrae is negligible only if the colour is measured during minimum light. The OGLE collaboration on the other hand has released mean magnitudes. Hence we decided to extend the work of PS09 by calculating the theoretical value of the colour taking the metallicity of each single star into account.
Using the photometric method established by Kovács & Zsoldos (1995); Jurcsik & Kovács (1996); Kovács & Jurcsik (1996) we use the Fourier coefficient and the period to calculate the metallicity of each RR Lyrae star of type ab. This metallicity is independent of reddening. As shown in the studies quoted above, the V-band light curve of the RR Lyrae stars can be decomposed with a Fourier series. The phase parameters can be used to calculate the property . It was shown in the studies cited above that the metallicity can be determined with the knowledge of and the period. Since the light curve properties are different in different photometric bands a separate calibration of and the period has to be carried out if the data are not taken in the V-band. This is relevant for the OGLE data, where the light curves are best sampled in the I-band. Smolec (2005) provides a relation valid when is computed from the I-band instead of V-band magnitudes. We use Smolec’s relation to infer the metallicities of the RR Lyrae from OGLE’s I-band . Then we use the metallicity dependent relations for the V- and I-band, found by Catelan et al. (2004) by theoretical modelling of lightcurves, to infer the absolute colour of each star. Further details on the results for the RR Lyrae ab metallicities are presented in a separate paper (Haschke et al., in prep.).
The measurements of the RR Lyrae have the same photometric uncertainties as the RC stars: mag. For the observed colour this is the only source of uncertainty taken into account. In the I-band the absolute magnitude depends on the period and on the metallicity of the RR Lyrae star, while the V-band magnitude only depends on metallicity. For the metallicity derived via Fourier decomposition Smolec (2005) states an uncertainty of dex, while the uncertainty of the periods, measured by the OGLE collaboration, is negligible. The uncertainty of the reddening is therefore determined to be mag. Many relations for calculating the absolute magnitudes of RR Lyrae stars have been published (see Sandage & Tammann, 2006, for a review).
PS09 found that imposing certain colour and magnitude constraints ensures a reliable selection of RR Lyrae stars of type ab that are likely members of the LMC. We adopt similar constraints: periods between 0.45 days P 0.80 days, amplitudes between 0.30 mag 0.85 mag, observed magnitudes of V 18 mag, observed colours larger than mag and metallicities between . The 17693 RR Lyrae ab found in the LMC are reduced to 13490 stars. In the SMC the number of stars is reduced from 1864 to 1529 RR Lyrae ab.
4.2. Results for the LMC
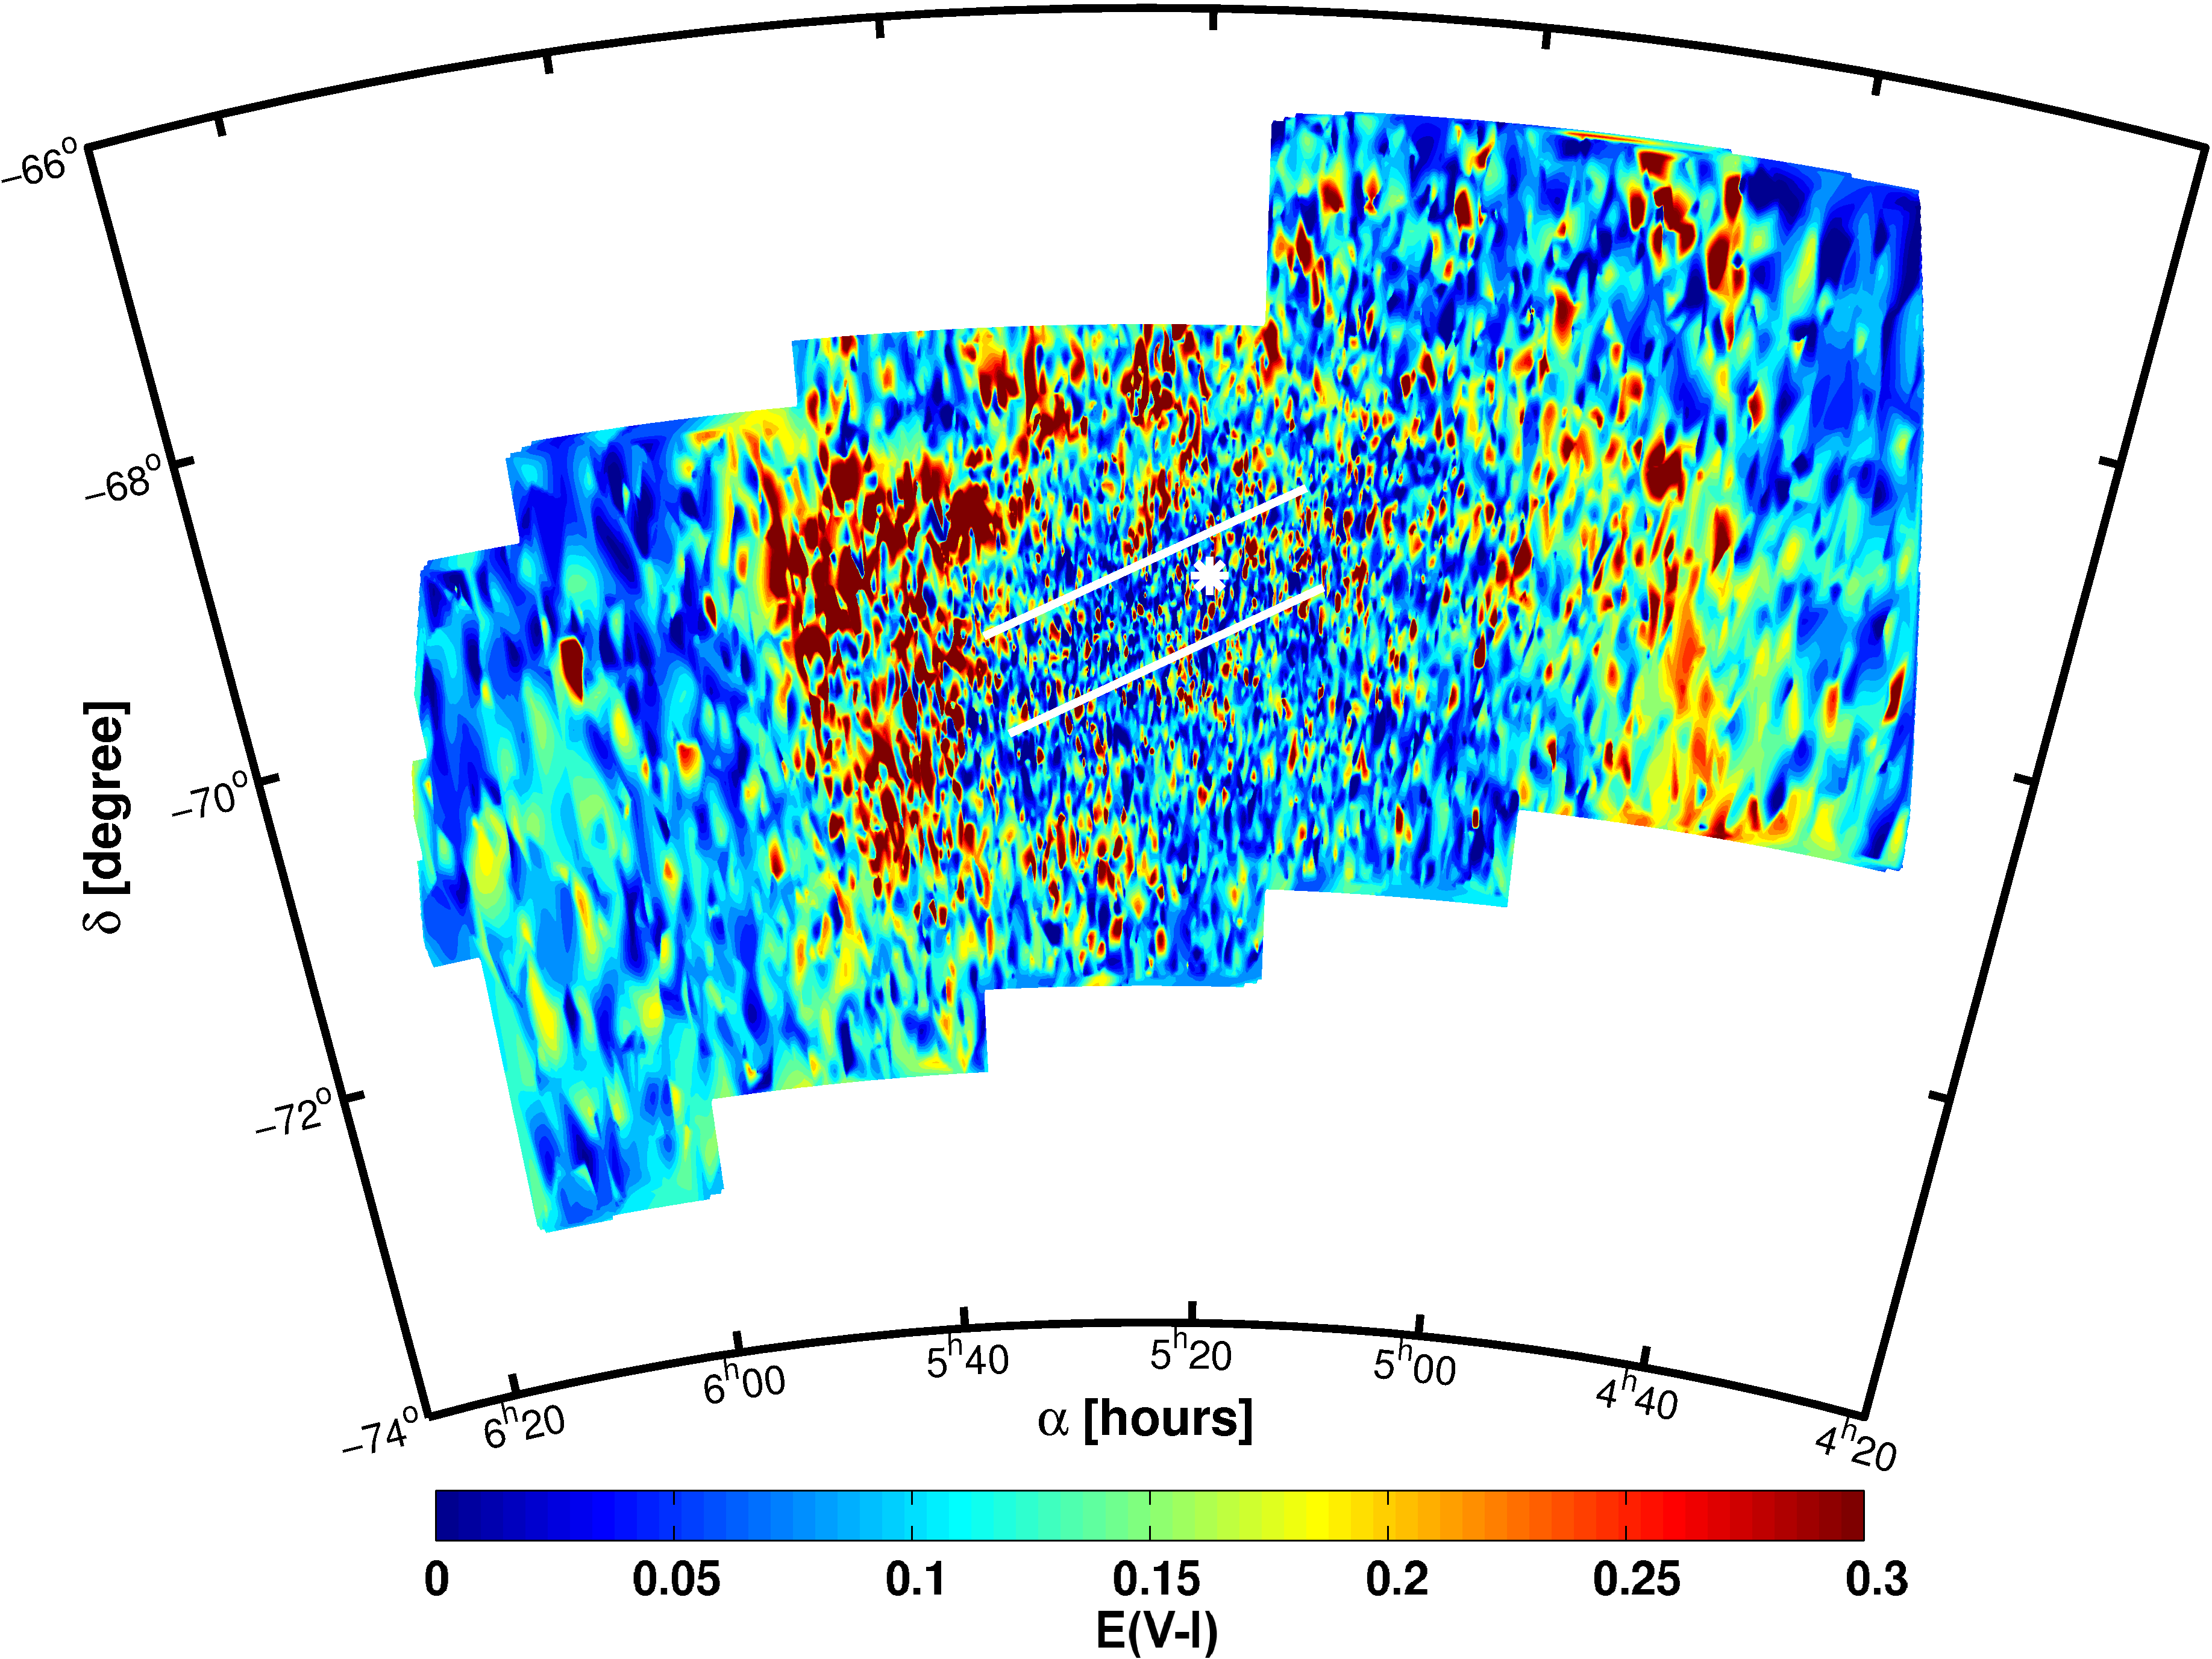
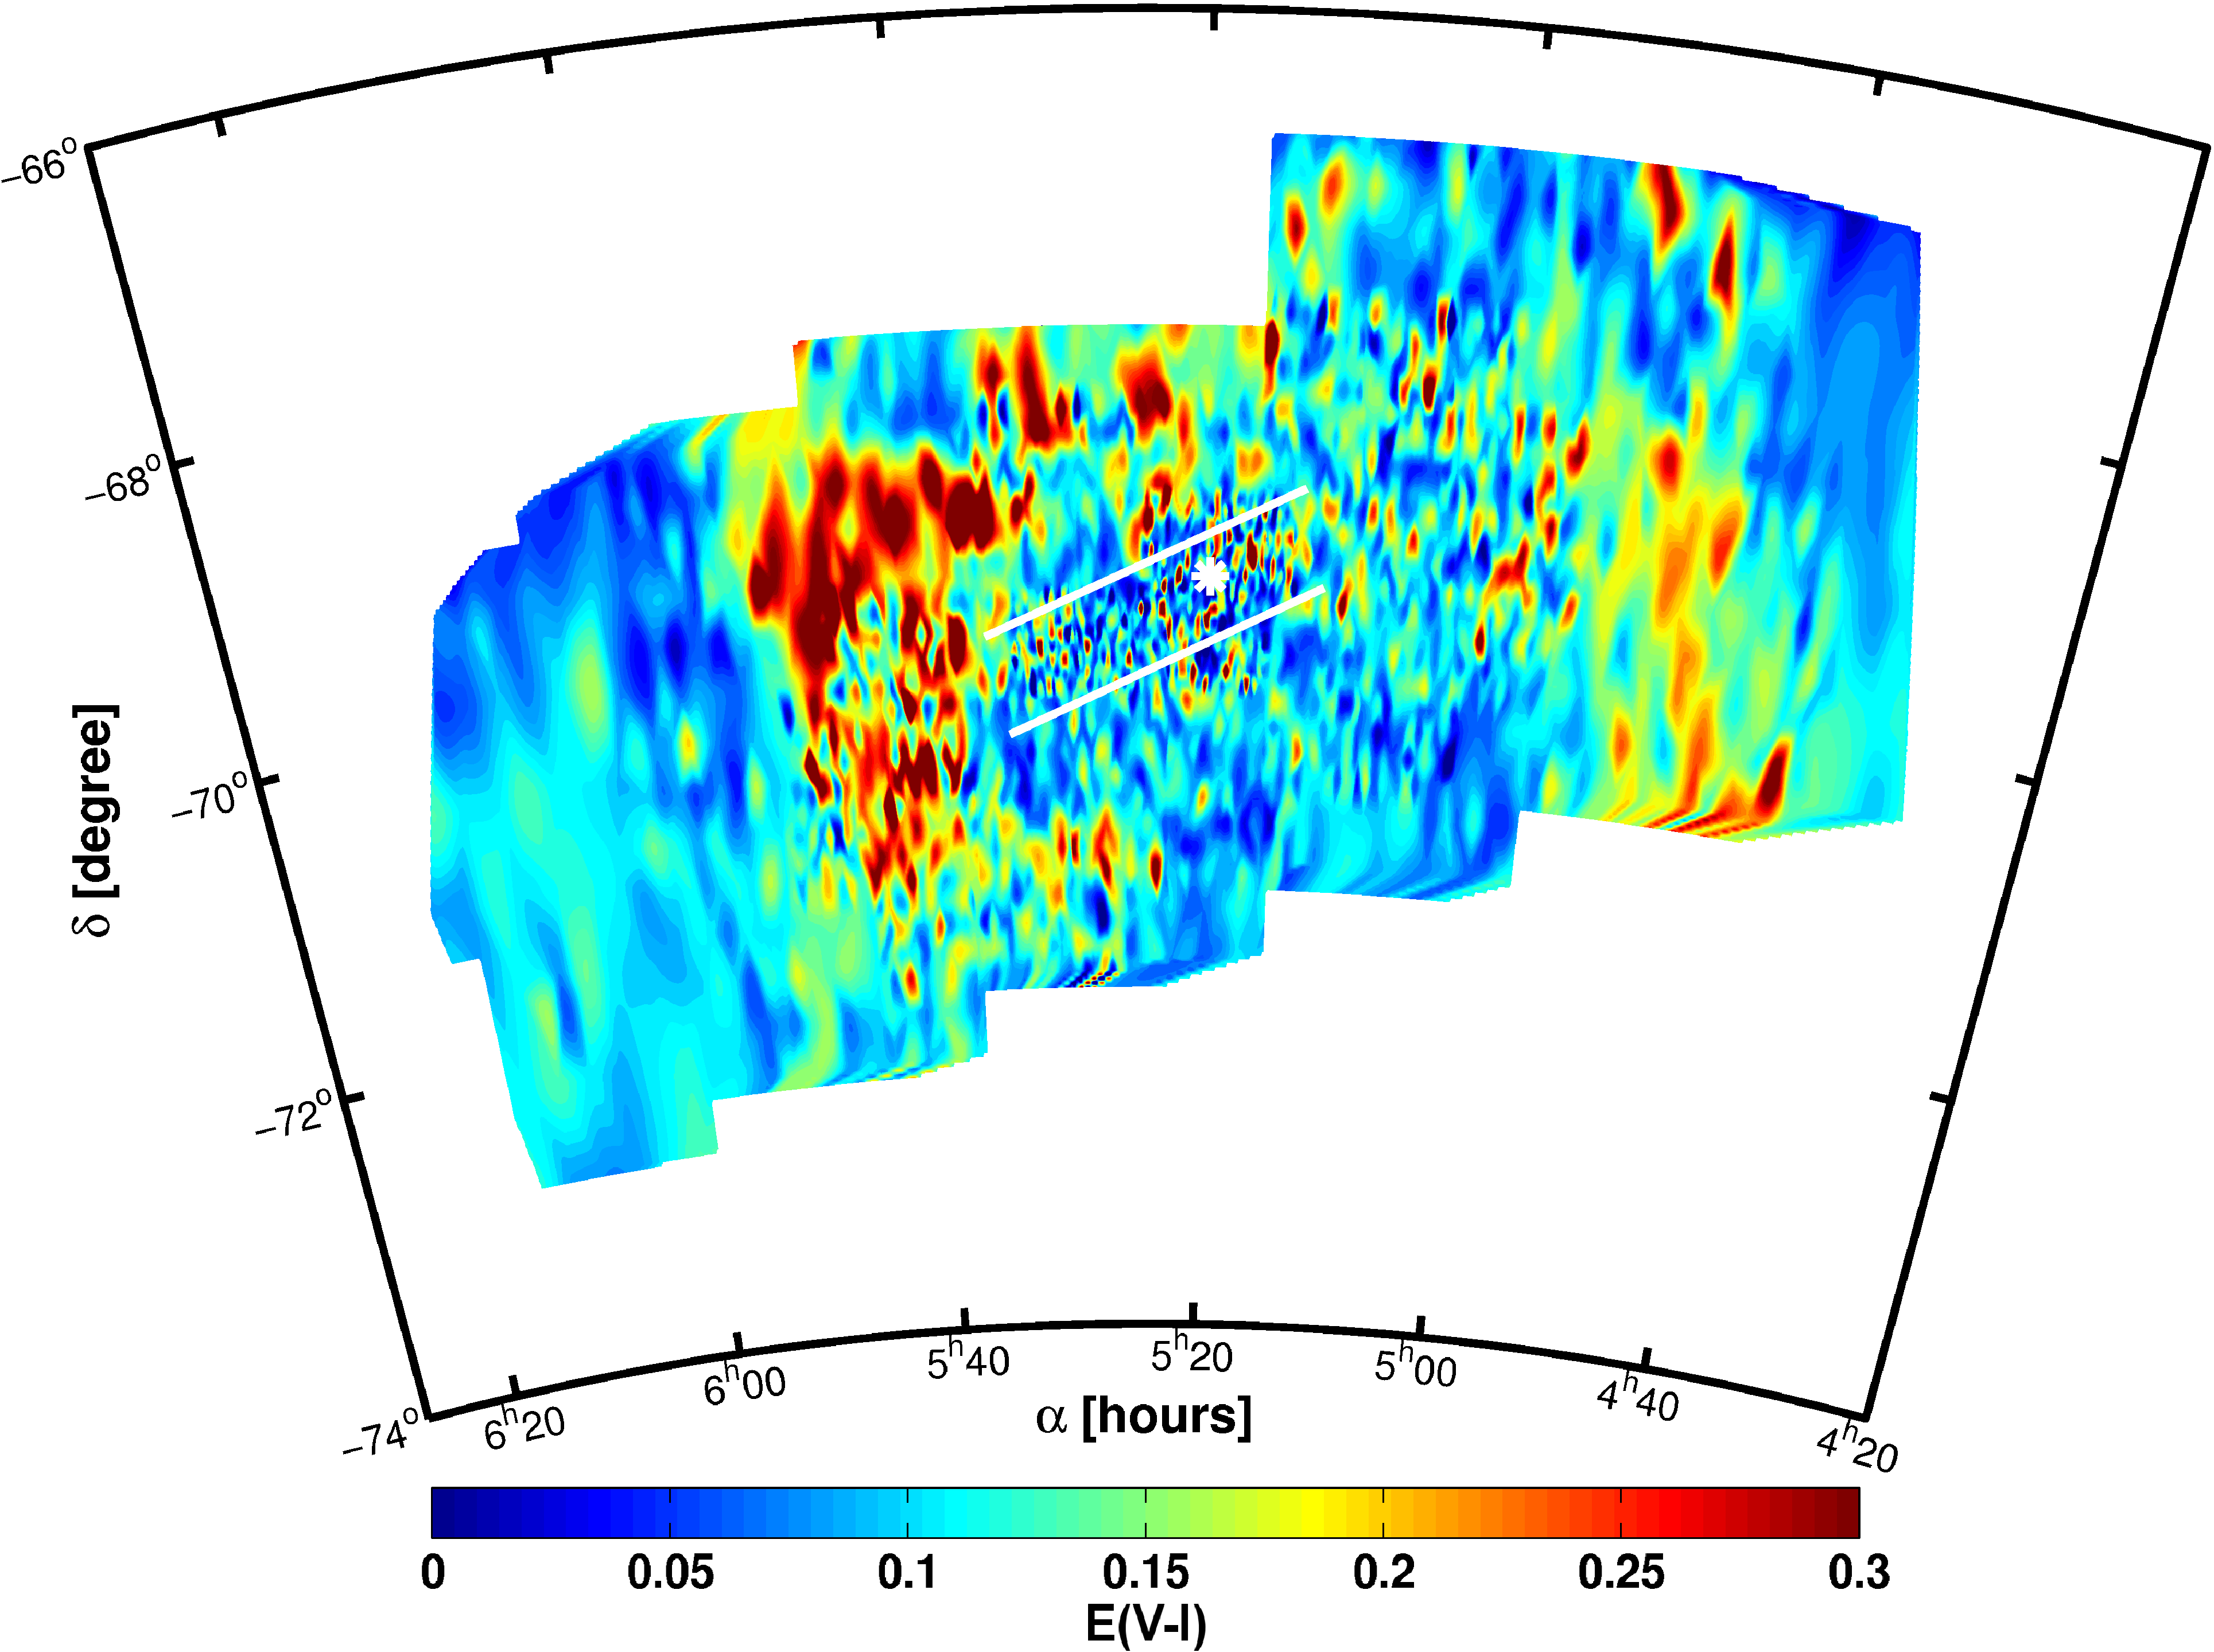
For each of the 13490 remaining LMC RR Lyrae a reddening value is calculated. The resulting values are plotted in Figure 10. To reduce the fluctuations due to the varying reddening values of the individual RR Lyrae stars we obtain a new reddening map of the LMC by averaging over the individual RR Lyrae reddening values in the same subfields chosen for the RC reddening. The mean reddening of all RR Lyrae stars located in each field is adopted in the reddening map shown in Figure 10. 120 fields are returned with no star allocation since the RR Lyrae are much more sparsely distributed than the RC stars. For each of these empty fields the mean reddening of the neighbouring fields is assigned as reddening.
The reddening map of the LMC obtained from RR Lyrae stars reveals a lot of structure. The highest reddening values are obtained in the leading edge, containing the spur and 30 Doradus. The highest value of a single RR Lyrae star is mag, while seven stars have a reddening of mag. The highest averaged field reddening value is mag. Another region with high RR Lyrae reddening values is found in the southwestern part of the OGLE III field ( and ). In the bar region the reddening is quite low and overall we find a mean reddening of 0.13 mag for the individual stars and the fields. The median reddening is slightly lower, namely mag. We find a standard deviation of 0.06 mag, a value of the same order of magnitude as the error for the RC method. While Figure 10 contains only a few spots of high reddening fluctuations between neighbouring areas, these are much more striking in Figure 10, which is to be expected since we are considering individual stars here. These fluctuations may be indicative of differential reddening along the line of sight.
Overall we find 635 stars (which corresponds to 5% of the whole sample) with a negative reddening down to mag. These lead to 33 fields (1% of all fields) with negative values. The field with the lowest mean RR Lyrae reddening has mag. The mean for the individual stars as well as for the fields with these negative values is mag. We inspect the lightcurve of every star with negative reddening. As one would expect, the shape of the light curves differs from star to star, but is well within the expected variations. The mean period of the RR Lyrae with negative reddening is higher by than that of the bulk of the RR Lyrae stars. With a mean of the metallicity of these stars is lower than the overall mean of . But there is no clear trend in the sense that most low metallicity stars or most high period stars have too low a reddening. The details of the metallicity distribution function will be discussed in a separate paper. The origin of the negative reddening remains unclear. If we set all negative values to zero, the resulting mean reddening of the LMC increases by just .
4.3. Results for the SMC
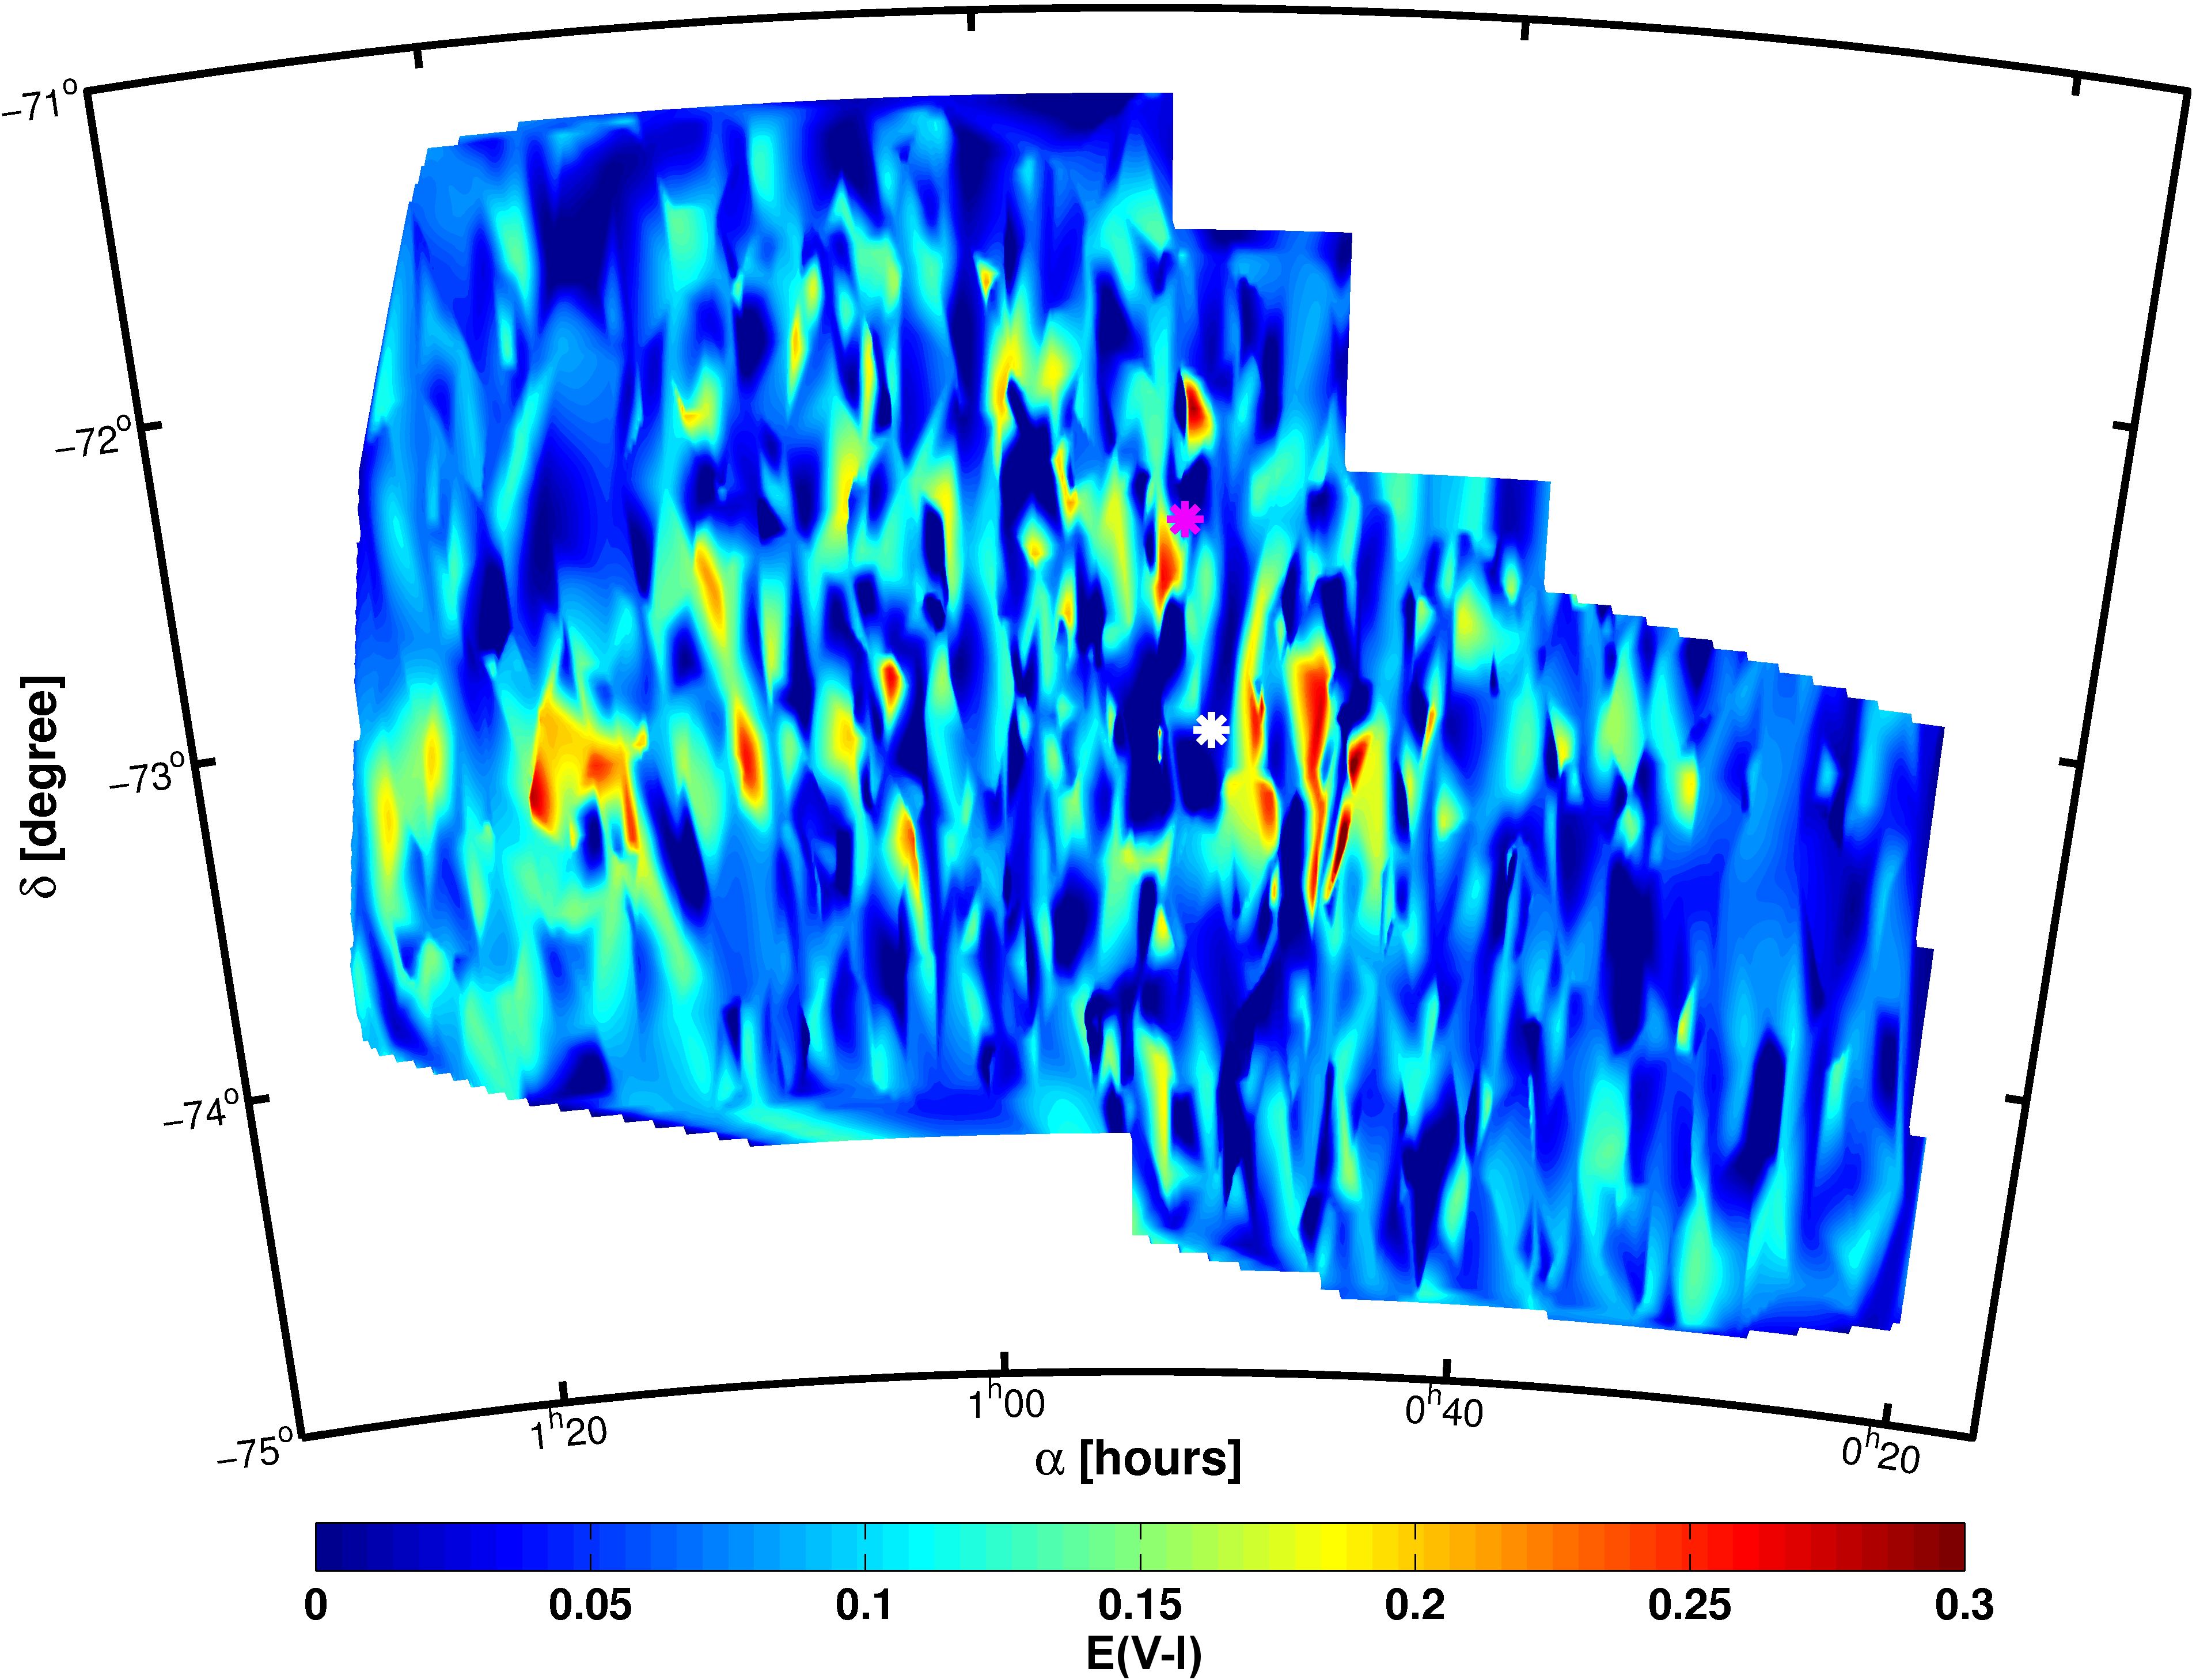
Using the same procedure, we calculate reddening values for the SMC 1529 RR Lyrae ab stars. The resulting reddening is shown in Figure 11.
Even though much more substructure is visible in Figure 11 than in Figure 4 the overall patterns are similar. The bar and the wing have the highest reddening values. The differences on small scales are, as for the LMC, interpreted as differential reddening. The highest reddening value in the SMC with mag is located in the southwestern bar region. Overall we find that the mean reddening has a value of mag, with a standard deviation of 0.06 mag.
Negative reddening is found for 114 stars or 7% of the sample. The lowest reddening for an individual star is mag, while the mean of all stars with negative reddening is mag. If all negative reddening values are set to 0 the mean reddening increases by . The mean metallicity of the stars with negative reddening is lower than for the whole sample of stars, i.e. we see the same trend as in the LMC. While the entire sample has a mean metallicity of , for the negative reddening stars a metallicity of is obtained. The details of the metallicity distribution will be discussed in a separate paper. The period of the RR Lyrae stars with negative reddening is increased by 5% compared to the mean of all stars. Nevertheless, a clear trend that most of the metal-poor stars have a lower reddening is not apparent.
The intrinsic uncertainties of the parameters used for the reddening estimates are the same in the SMC as in the LMC. The uncertainty of the SMC RR Lyrae reddening is calculated to be mag. This is comparable with the uncertainty of the RC method.
4.4. Use of the RR Lyrae reddening data
Using the RR Lyrae stars of the MCs we determine reddening values for lines of sight to individual stars. These values are strictly only valid for these particular RR Lyrae stars. We are not able to constrain the stars’ distance independently of the reddening measurement. Therefore we are not able to distinguish between objects located at varying depth that might be affected by different amounts of differential reddening.
The RR Lyrae reddening maps are not necessarily useful for the reddening correction of other types of stars close by in projection. Therefore we do not provide the reddening values via the virtual observatory. Nonetheless, these data provide a detailed account of the reddening experienced by the old population of the MCs and are interesting to compare to reddening maps presented in Zaritsky et al. (2002, 2004) as well as to our RC reddening maps. We can obtain insights into the differential reddening which is of interest for a broad variety of subjects such as, e.g., gravitational lensing. Moreover these data are useful for comparison with the structural and geometrical properties of the MCs.
5. Discussion
5.1. The zeropoint of the RC colour
The crucial point in our RC reddening determinations are the unreddened theoretical colours, which depend on the metallicity and the age of the stellar population (see Section 5.2). In S05 and in our work the value for the RC colour was adopted from the work of Girardi & Salaris (2001). Both studies assume a metallicity of , which corresponds to a RC colour between 0.90 mag and 0.95 mag for stars with an age of Gyr. Other works, such as Cole et al. (2005) with spectroscopic measurements of red giants, find similar metallicities as assumed in these studies. Based on the photometric measurements of RC stars by Olsen & Salyk (2002) we adopt the value .
The reddening values obtained by Udalski et al. (1999a, b) with the RC method are much higher ( mag) than the reddening in S05 and in this study. S05 suggest that this discrepancy may be resolved by adopting a much lower metallicity of for the LMC RC population, which would result in a bluer colour for the RC. Since neither the concrete method, nor the adopted metallicity is mentioned in Udalski et al. (1999b) we can only speculate about the cause(s) of the differences.
The overall metallicity of the SMC is lower than that of the LMC. Matteucci et al. (2002) showed that the red clump in the SMC is shifted to bluer colours as compared to the LMC. Girardi & Salaris (2001) provide a RC colour of mag for , while their models lead to a colour between mag and mag for . We assume that the metallicity of the SMC RC lies a bit below the metallicity value of the LMC and choose a RC colour of mag. The metallicities of the intermediate age populations show a considerable spread at any given age (Glatt et al., 2008a). The mean metallicities found by Cole (1998) and Glatt et al. (2008a) agree with our assumption of a metallicity between and .
5.2. Possible caveats of the methods used
For the RC method different effects lead to a broadening of the clump, such as metallicity and age spreads, binaries, and differential reddening.
A lower metallicity would lead to a bluer colour of the RC and therefore enhance the overall reddening of all fields. The existing measurements of the metallicity of RC stars make this effect unlikely. An age spread among RC stars is present in all fields, but the effect on the colour is quite small as long as the metallicity does not change dramatically.
For the RR Lyrae stars we have derived the metallicity of each star individually in a separate paper (Haschke et al., in prep.). We take these different metallicities into account while calculating the absolute colours of each RR Lyrae star. The uncertainties of the metallicity are about 0.2 dex, which corresponds to a colour difference of mag.
The RR Lyrae stars are up to a few Gyr older than the RC stars, hotter by about 2000K (Puzeras et al., 2010; Smith, 2004), and bluer by about mag. The absolute magnitude of RR Lyrae and RC stars are similar. As discussed in Section 5.4 these differences are not expected to have a significant effect on the reddening obtained for these stars. Assuming that the spatial distribution of RC and RR Lyrae stars is similar, differences are mainly expected due to differential reddening, which gets averaged out in the RC method, while fully affecting the individual RR Lyrae measurements.
5.3. Assumptions on the Geometry
If we make the simplified assumption that the dust forms a thin, equidistant sheet across the LMC (or SMC), then the amount of reddening suffered by a particular region can be directly translated into the geometry of that region: The more reddened a region is, the farther it is behind the sheet; the less reddened it is the more stars are in front of the sheet. However, this reasoning becomes more difficult if the dust is not evenly distributed (as we know it isn’t; see, e.g., the Spitzer dust maps). Moreover, the dust properties vary across the face of the Magellanic Clouds as traced by, e.g., the varying appearance at 8 microns and 160 microns. Ideally, one would like to use an independent distance determination method in order to infer the 3-D geometry of the Clouds. We attempt to do this in a forthcoming paper.
5.4. Comparison of our two approaches
LMC
In order to compare the RR Lyrae reddening with the RC reddening, the same field selection as in Section 3 is used in the LMC to find average values of RR Lyrae reddening.
As shown by Grebel & Roberts (1995), reddening varies as a function of temperature (or colour). However, in the colour range of RC stars and RR Lyrae hardly any variations are to be expected (see, e.g., Fig.3 in the above reference). Hence, theoretically both the RC and the RR Lyrae approach should yield fairly similar results if the reddening suffered by both types of stars is comparable.
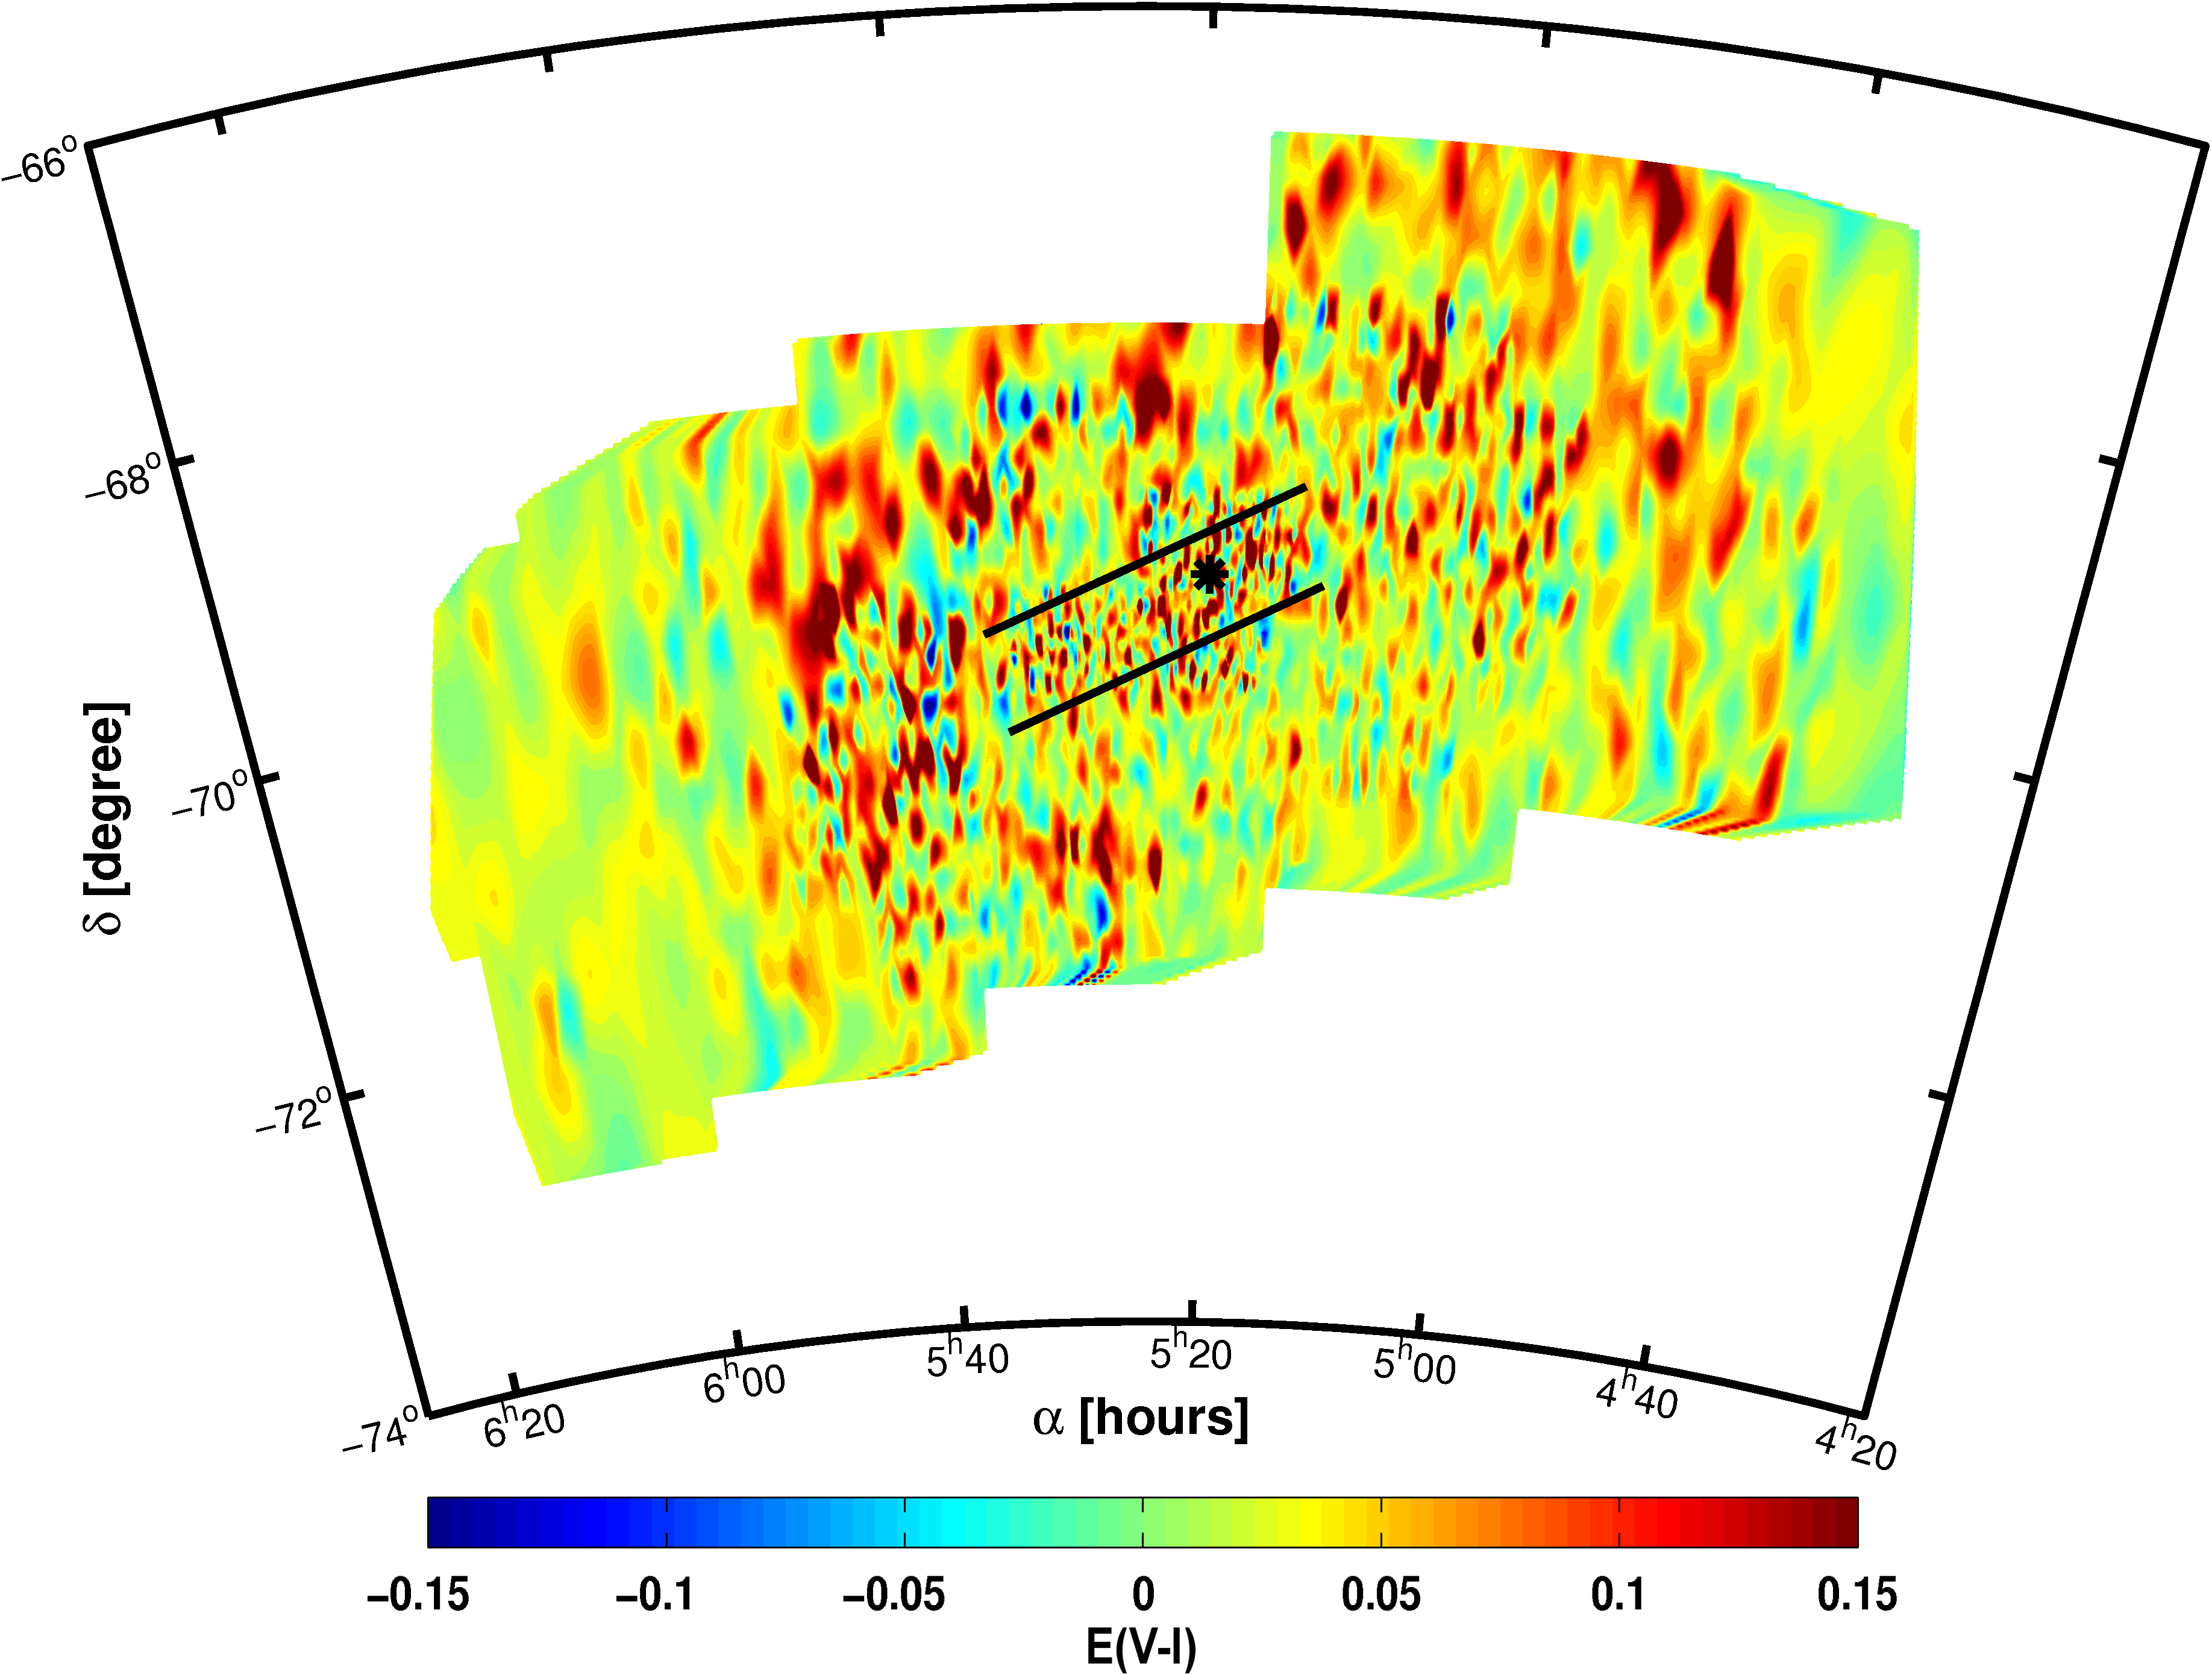
For the LMC the overall agreement between the RC and the RR Lyrae map is striking, although the northwestern regions ( and ) have on average a higher reddening in the RR Lyrae map (Figure 12). In general we find a mean difference between the mean RC and the mean RR Lyrae reddening of mag when subtracting the RC map from the mean reddening map of the RR Lyrae. This is a difference of less than 1. We find a few regions with reddening values up to mag higher in the RR Lyrae determination as compared to the RC map at the same location. Some fields have higher reddening values from the RC method than from the RR Lyrae estimates. The field with the highest difference is found with mag. But in general only very few fields deviate strongly from each other. In only about of the fields the variation exceeds a difference of more than mag or . We attribute these differences primarily to differential reddening and small number statistics affecting the RR Lyrae values.
At the spatial position of 30 Doradus the reddening is highly dependent on the location of a given star with respect to the star-forming region. Westerlund (1997) and van der Marel (2006) mention that 30 Doradus seems to be located on the far side of the LMC as seen from us. If that were true the dust and gas of 30 Doradus would have an effect on only a minority of the much older RC stars. Therefore the (mean) reddening estimate of this region would be biased towards lower values and a long tail of higher reddening values would be measured (see Figure 7). For the RR Lyrae stars we compute a reddening value for every star. This results in a substantial differential reddening, due to the differing distances of these stars, and in a spread of the estimated reddening values in each subfield. Averaging these values for a given subfield does not reduce the contribution of highly reddened stars behind 30 Doradus, as much as it might be the case for the RC method. We obtain higher average values for the same subfield by using the RR Lyrae stars than for the RC stars, which leads to the assumption of 30 Doradus being at the far side of the LMC.
The RR Lyrae stars are located at different distances throughout the LMC. In addition the dust content in the body of the LMC leads to differential reddening. In Figure 10 the effects of differential reddening are obvious. Fields very close to each other may have very different reddening values. For 958 stars, or 7%, of all RR Lyrae stars the reddening values of the individual stars differ by more than mag or , from the corresponding mean value of the RC reddening. The effect of differential reddening therefore affects only a minor number of stars.
The adopted mean colour of the RC is crucial for the reddening computation. The very good overall agreement of RC and RR Lyrae maps in areas with very low reddening leads us to the conclusion that the theoretical colours are well chosen. For regions with mag a mean difference of only 0.004 mag is found calculating .
SMC
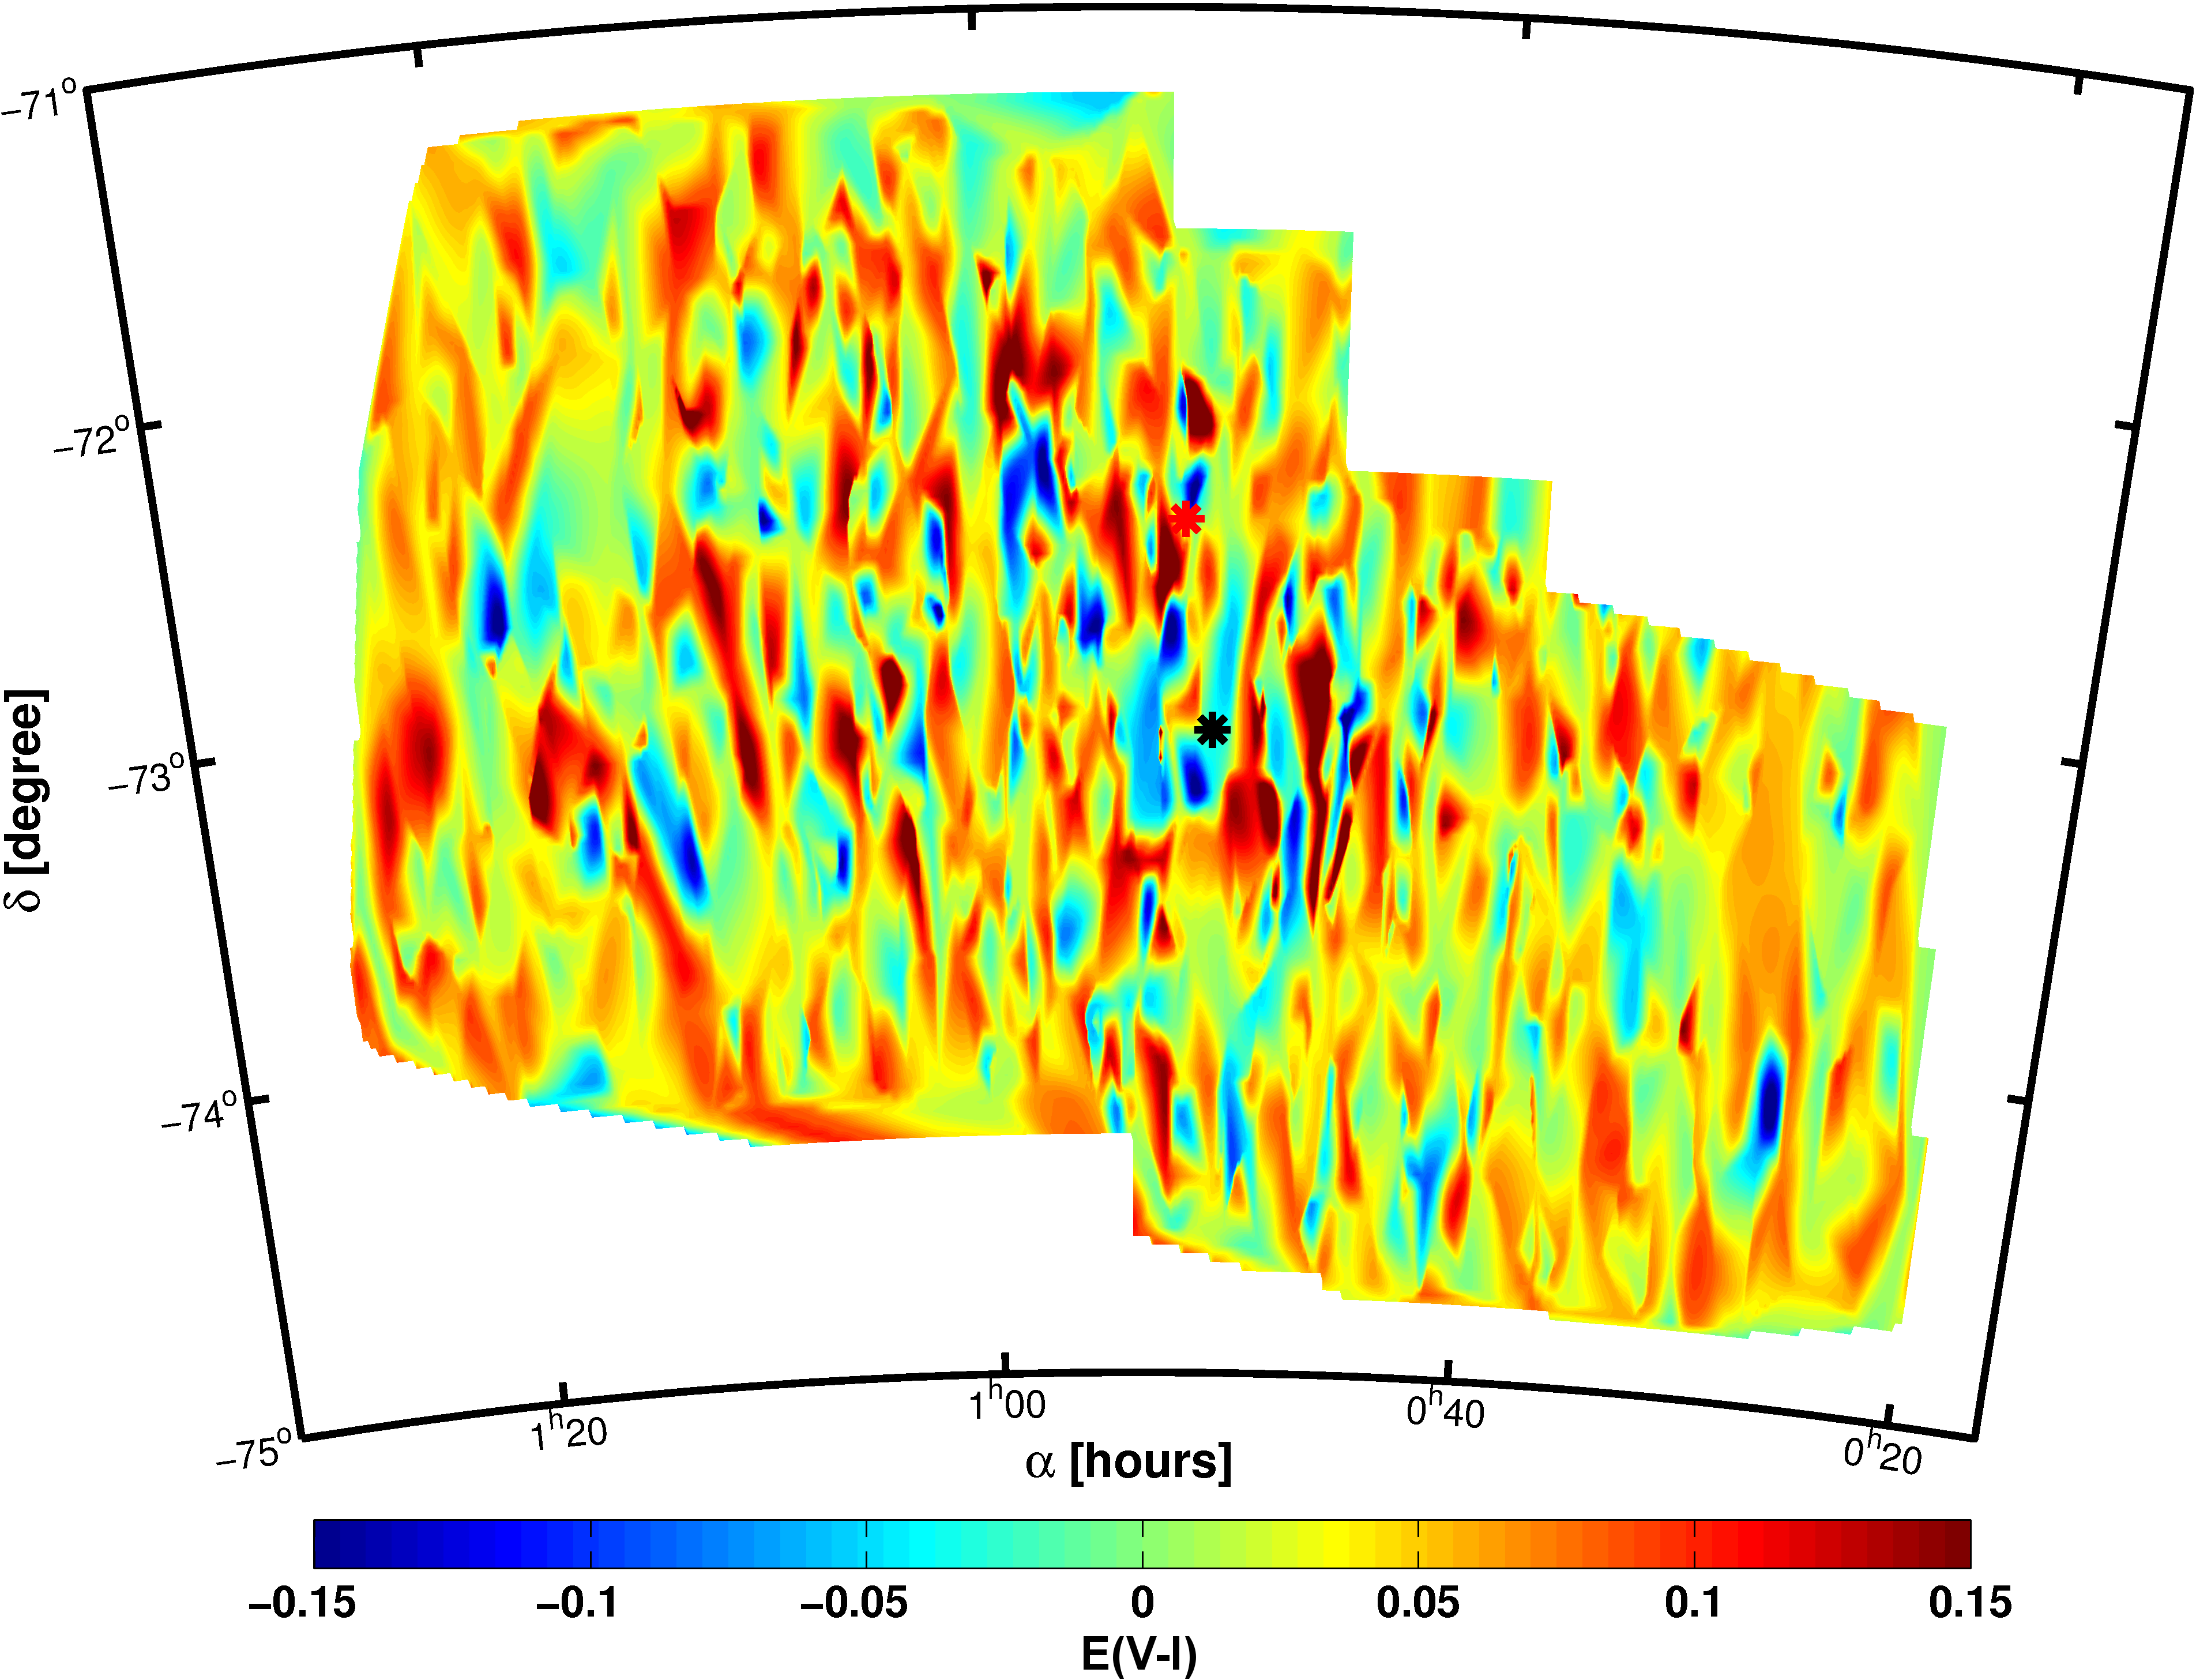
The SMC is populated much more sparsely in RR Lyrae stars, thus many fields defined earlier when using the RC method contain less than three RR Lyrae stars. Therefore we decided to compare the individual values of the RR Lyrae stars with the RC reddening (see Figure 13).
On average the RR Lyrae stars have a reddening that is higher by than the corresponding RC field. The differences between the two approaches vary between mag and mag. 348 stars (23%) have lower reddening with the RR Lyrae method than the corresponding RC reddening value. Only 48 stars, or 3%, of the RR Lyrae deviate by more than from the mean reddening of the field obtained by the RC method.
Even though the mean differences are small Figure 13 reveals that the RR Lyrae reddening map is much more patchy than the very smooth RC map. While we inspect and average over fields of a certain size with the RC method, the RR Lyrae measure just the line of sight reddening of individual objects. We find only 13 stars, which is less than of the sample, where the reddening value of the RR Lyrae deviates by more than , or mag, from the average value of the corresponding RC field. Hence we conclude that the poor sampling of the field is the major contribution for this patchy behaviour of the RR Lyrae reddening map.
The mean colour of the RC method for the SMC was adopted from Udalski et al. (1998) and was compared with the model predictions by Girardi & Salaris (2001) for a metallicity of . Investigating the stars with mag we find a very small difference of mag between the RR Lyrae reddening values and the RC method. Thus, within the uncertainties, the RC and RR Lyrae reddenings agree very well for regions with low reddening.
5.5. Comparison with other studies
Previous studies of the reddening of the MCs concentrated mostly on the LMC. Below we compare our results for the LMC with the reddening maps inferred from OGLE II data by S05 (S09 is not publicly available), with PS09, who used RR Lyraes from the OGLE III survey, with the cool stars reddening map of Z04, and with CO and infrared maps from D08. For the comparison with the SMC we will concentrate on the reddening maps of Z02 and the CO and infrared measurements by D09.
5.5.1 Dobashi et al. (2008, 2009)
D08 and D09 have used infrared data from 2MASS to derive reddening maps of both MCs. The absolute reddening values are not published, but the images of the maps can be visually compared to the results of our study. The qualitative consistency between the overall appearance of the maps derived from infrared data and our maps is very good. All regions with high reddening values in the infrared are well reproduced by the maps of our work (Figure 5 of D08 and D09, respectively).
As expected the very active star-forming region in the wing of the SMC, with many H II regions, is the area with the highest reddening, having reddening values up to mag in our map. This region is very prominent in the infrared maps of Wilke et al. (2003, their Fig.1) as well. In the SMC bar the region in the southwest corner has the highest reddening values (up to mag in our work) in each of the inspected maps.
In the LMC the 30 Doradus region is the most prominent heavily reddened feature in each map. The location of the regions with high reddening is very similar. Additionally, the very low reddening of the LMC bar region found in our analysis is reproduced very well by the infrared maps of D08. Only one area of the LMC is not reproduced in D08. In the southwest corner of the observed OGLE III field a region with higher reddening is visible in the maps from our study, but not in the infrared data. Searching for extended gaseous features in this part of the sky we can only identify a higher concentration of HI clouds (see Kim et al., 1998). However, there is very good agreement of our data with the reddening maps from the 2MASS catalogue.
5.5.2 Subramaniam (2005)
The differences in the photometry between OGLE II and OGLE III are marginal (Udalski et al. (2008a) quote mag). Hence we do not expect that the use of OGLE II or OGLE III data within the same area will introduce differences.
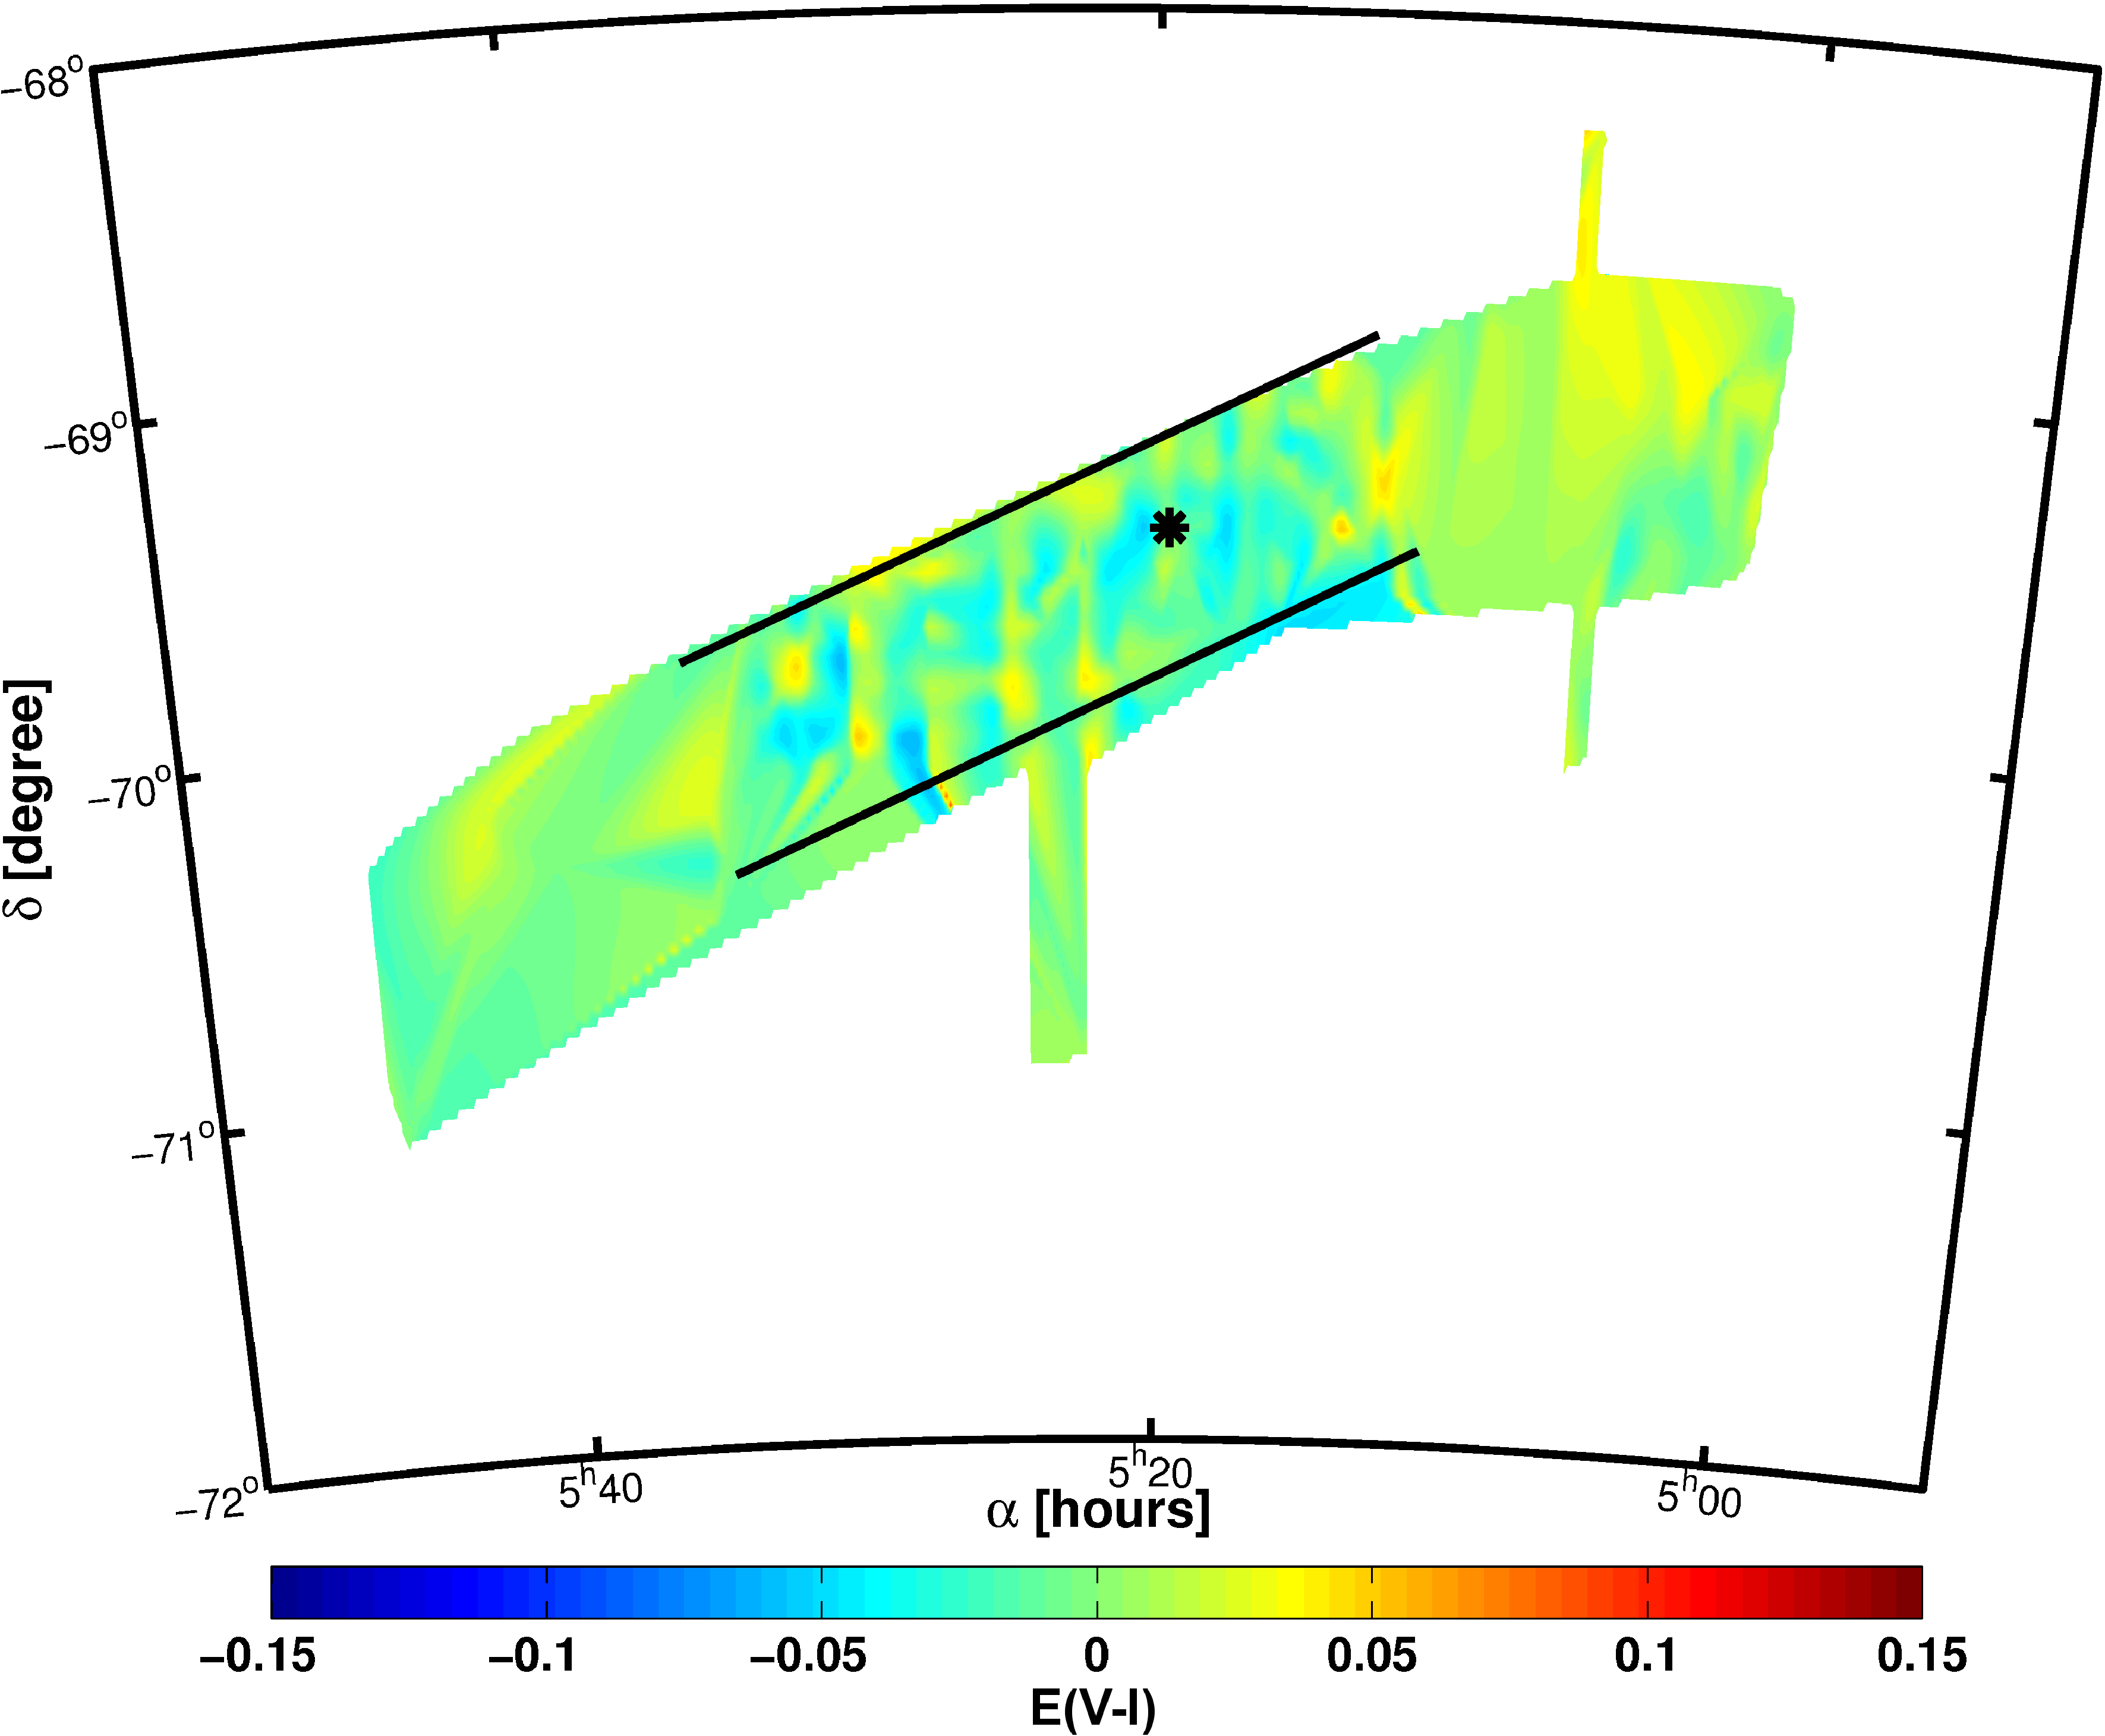
The comparison between S05 their Figure 1 and Figure 17, from OGLE II data, and our study shows very good agreement (see Figure 14). The mean difference of the RC reddening values is mag and therefore much smaller than the uncertainties. The fluctuations in the central parts are most likely caused by different subfield sizes. S05’s spatial resolution is a bit higher, hence the differences could be generated by variations on very small scales. For the northwestern area of the S05 reddening map our RC reddening values are lower. While S05 is limited by the OGLE II field our selection box includes many stars previously not observed. This difference in field selection might be the reason for the trend of slightly higher reddening in this region and in S05 in general. Overall the differences are very small and our results are in very good agreement with the data of S05.
5.5.3 Pejcha & Stanek (2009)
Based on RR Lyrae stars from the OGLE III survey PS09 use the period-colour relation of the unreddened cluster M3 to infer the of the LMC RR Lyraes. M3 has a metallicity of dex (Cohen & Meléndez, 2005), similar to the mean metallicity of the LMC RR Lyrae (Borissova et al., 2009). The difference between the theoretical and the measured colour yields the reddening. PS09 subdivided the OGLE area and calculated a mean reddening for every field with at least two RR Lyrae stars. With this method PS09 construct a map for nearly the whole LMC OGLE field of view.
While we used the same stars as PS09, there are two main differences in actually calculating the reddening values. First we accounted for the intrinsic metallicity of the RR Lyrae in our colour estimation. For different metallicity bins the mean colour varies significantly. The metallicity bin with the densest population and values between has a mean colour of mag. All other metallicity bins have a redder colour (see Table 3).
| metallicity bin | colour |
|---|---|
| 0.52 | |
| 0.48 | |
| 0.51 | |
| 0.54 |
The other major difference is the formula used for calculating the colour of each RR Lyrae star. With a mean period days and mean metallicity of dex for all RR Lyrae stars we obtain a mean colour of mag. The relation (Equation 1 in PS09) leads to a mean colour of mag when using the same mean period. Compared with Figure 1 this would place the RR Lyrae stars redwards of the red clump.
PS09 transformed their reddening values to extinctions , which they made publicly available. We reverse the transformation and compare the reddening values of PS09 with our mean reddening values of the RR Lyrae that are observed in each field via .
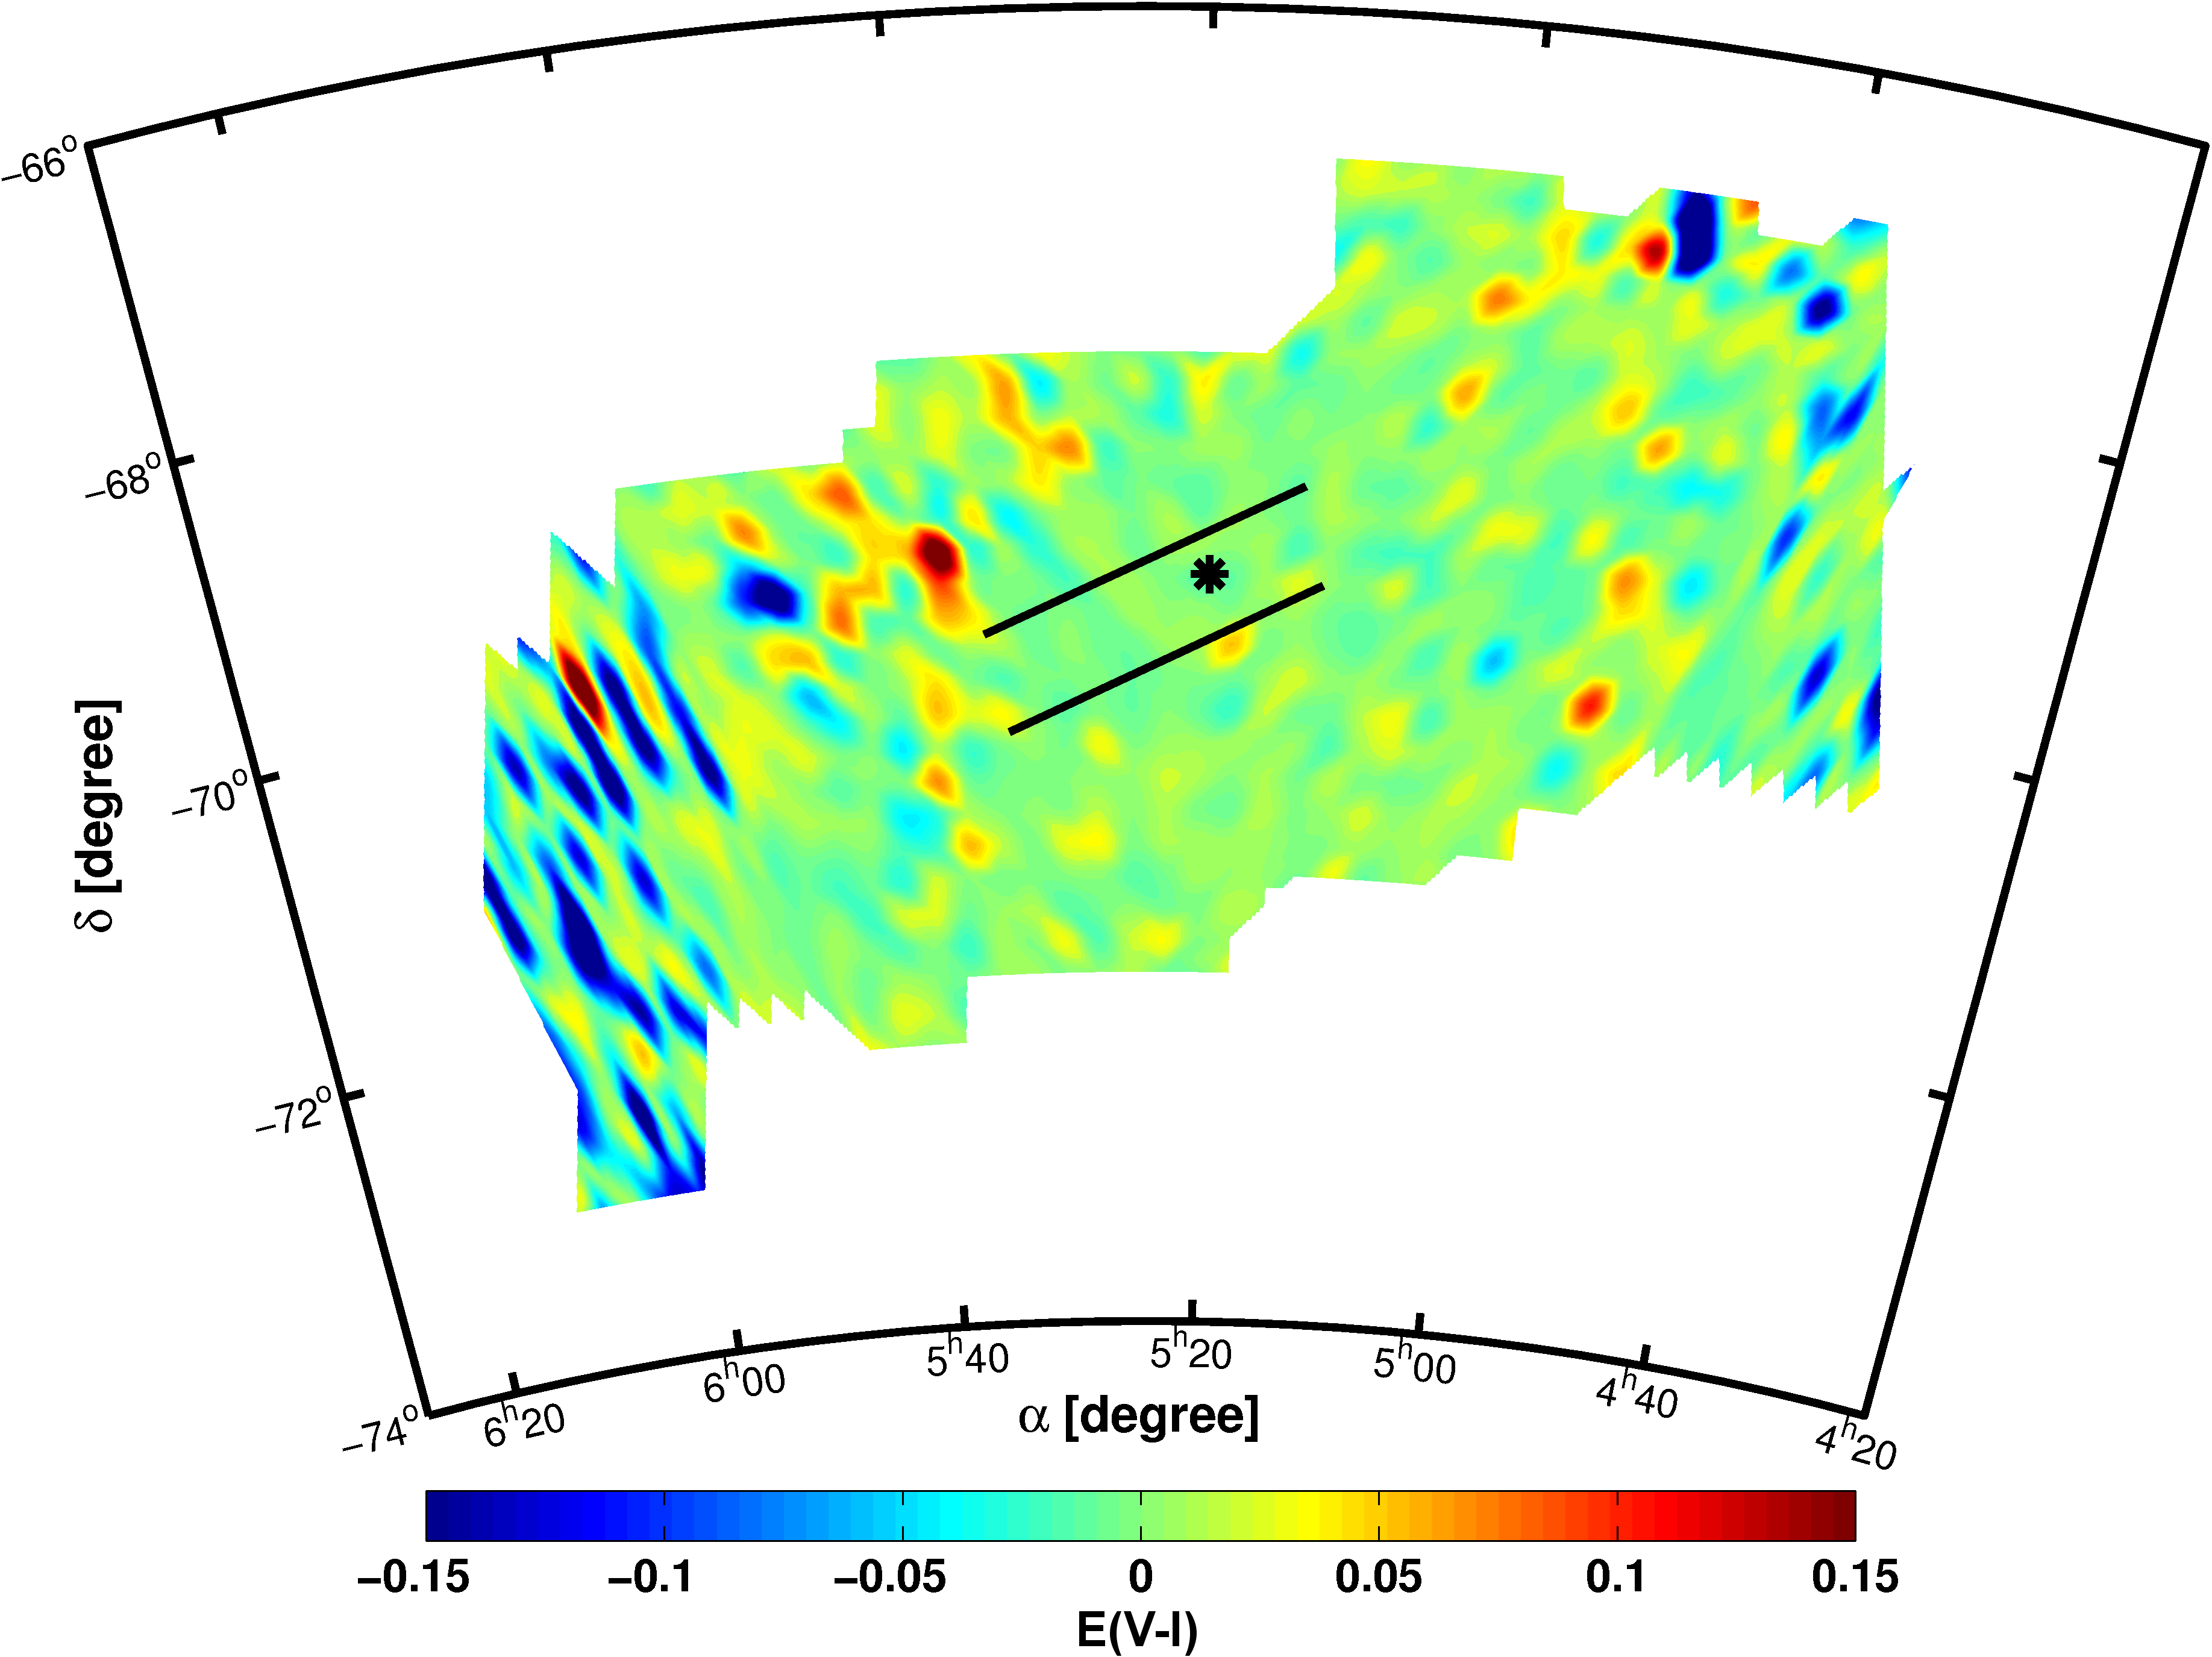
On average we find that our reddening values agree very well with the reddening map presented by PS09 (see Figure 16). The mean difference is just mag, with deviations ranging from to mag. For of all PS09 fields a deviation of more than 0.06 mag or is found. The eastern regions of the LMC () are only sparsely populated and due to the selection criteria of PS09 these regions are not very well covered. Therefore the comparison in these regions is not reliable.
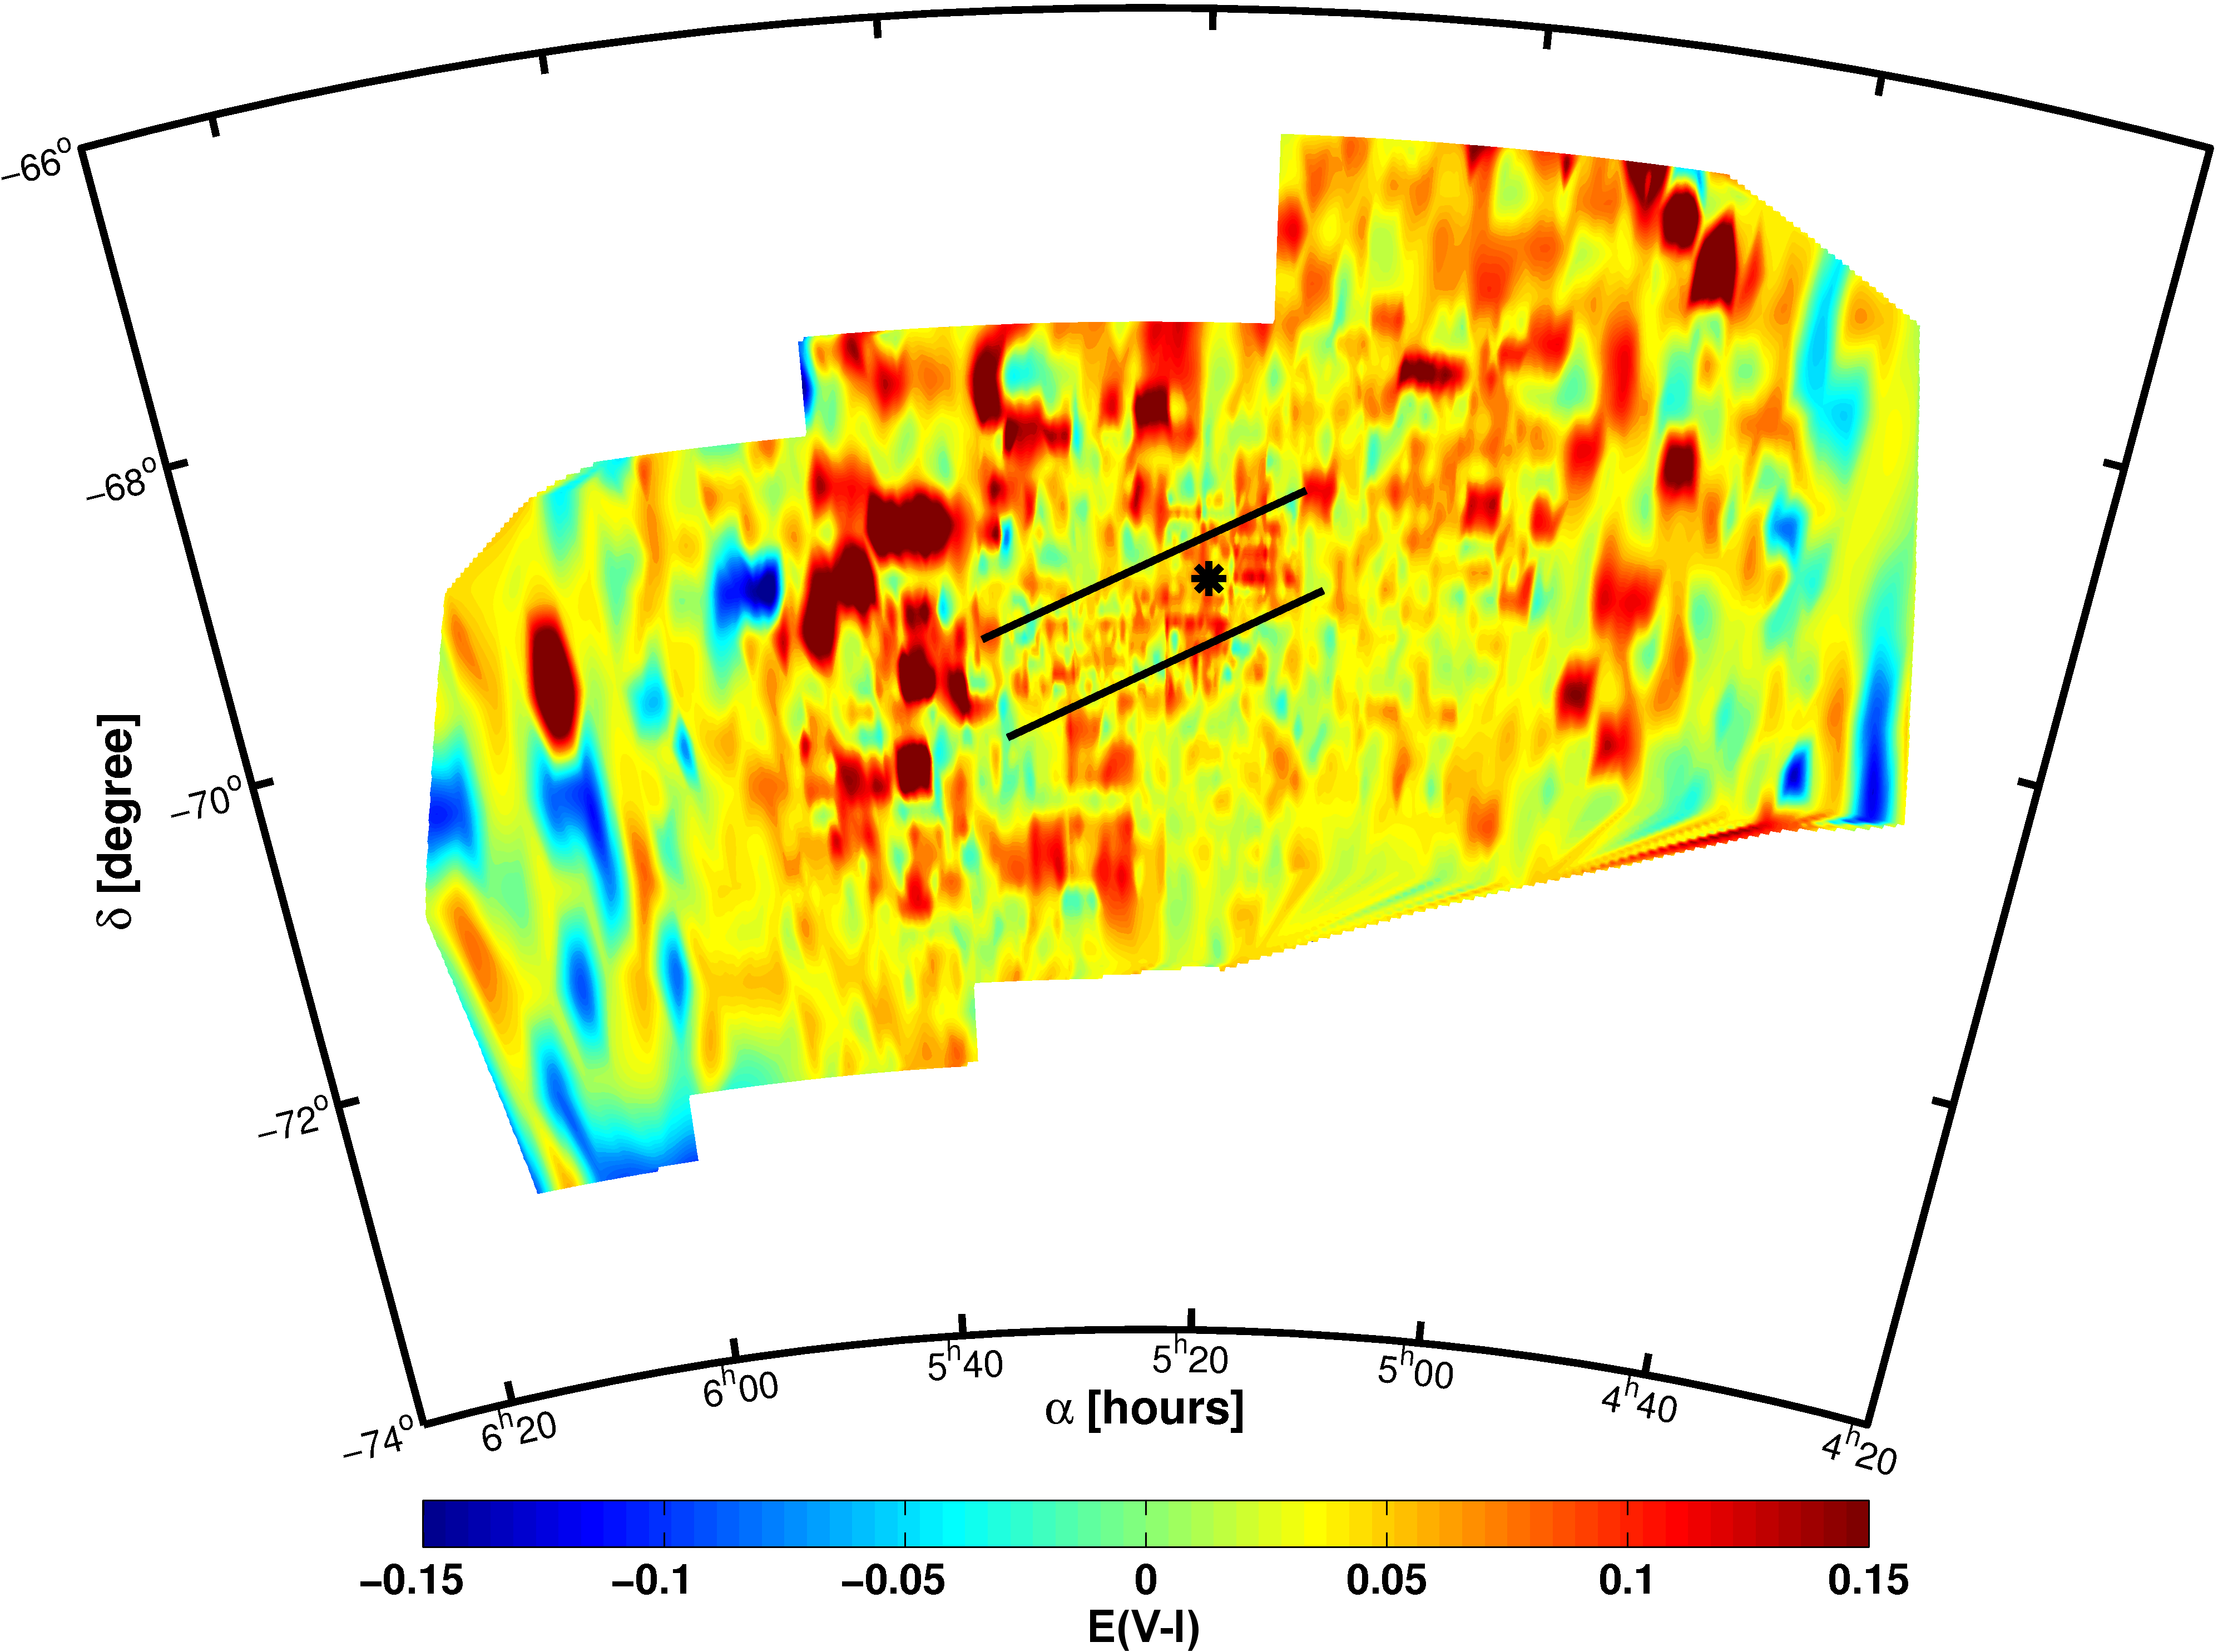
In addition to comparing the reddening values resulting from the different implementations of the RR Lyrae methods of PS09 and our work, we compare the values of PS09 to our reddening values from the RC method. We use the values of computed above from the work of PS09 and subtract our reddening estimates of the RC method for the corresponding field. The field sizes of the two approaches differ significantly. We therefore recalculate the values of PS09 to fit into the spatial grid set by our RC method. The differences are evaluated using this grid and are shown in Figure 16. This leads to a mean difference in reddening of mag. The differences for individual fields range from to mag, but only of all fields have deviations of more than mag or .
Especially the region of 30 Doradus reveals much higher reddening values in the maps of PS09. Comparing the two RR Lyrae methods the same result is found, see Figure 16.
The northwestern region is higher in reddening as well in PS09. This result is also visible in the comparison of our RR Lyrae reddening estimates and the RC method (see Figure 12).
Most regions with higher reddening values from the PS09 map show indications of considerable differential reddening (compare with Figure 2 in PS09, ). As before we suggest that the most likely explanation is the differential reddening with its resultant asymmetric distribution of reddening values. Taking the mean of such a distribution yields higher values than the use of the peak of the distribution, as done for the RC stars. In addition, the sparser sampling of RR Lyrae stars as compared to the RC stars increases the scatter (see Section 5.4).
5.5.4 Zaritsky et al. (2002, 2004)
Z02(SMC) and Z04(LMC) used hot () and cool () stars to produce reddening maps of both MCs. These maps are based on the multi-colour data of the MCPS (Zaritsky et al., 1997) and cover 64 square degrees in the LMC and 18 square degrees in the SMC 222The fits files containing the reddening data of the MCPS can be found at: http://ngala.as.arizona.edu/dennis/mcsurvey.html. For each hot and each cool star in the field a reddening value is estimated, but we only use the data of the cool stars, which are much closer to the characteristics of the RC, with K (Bragaglia et al., 2001) and RR Lyrae stars, with K (Barcza, 2010) at minimum light, used in our work. These reddening values are compared with all data sets evaluated by us.
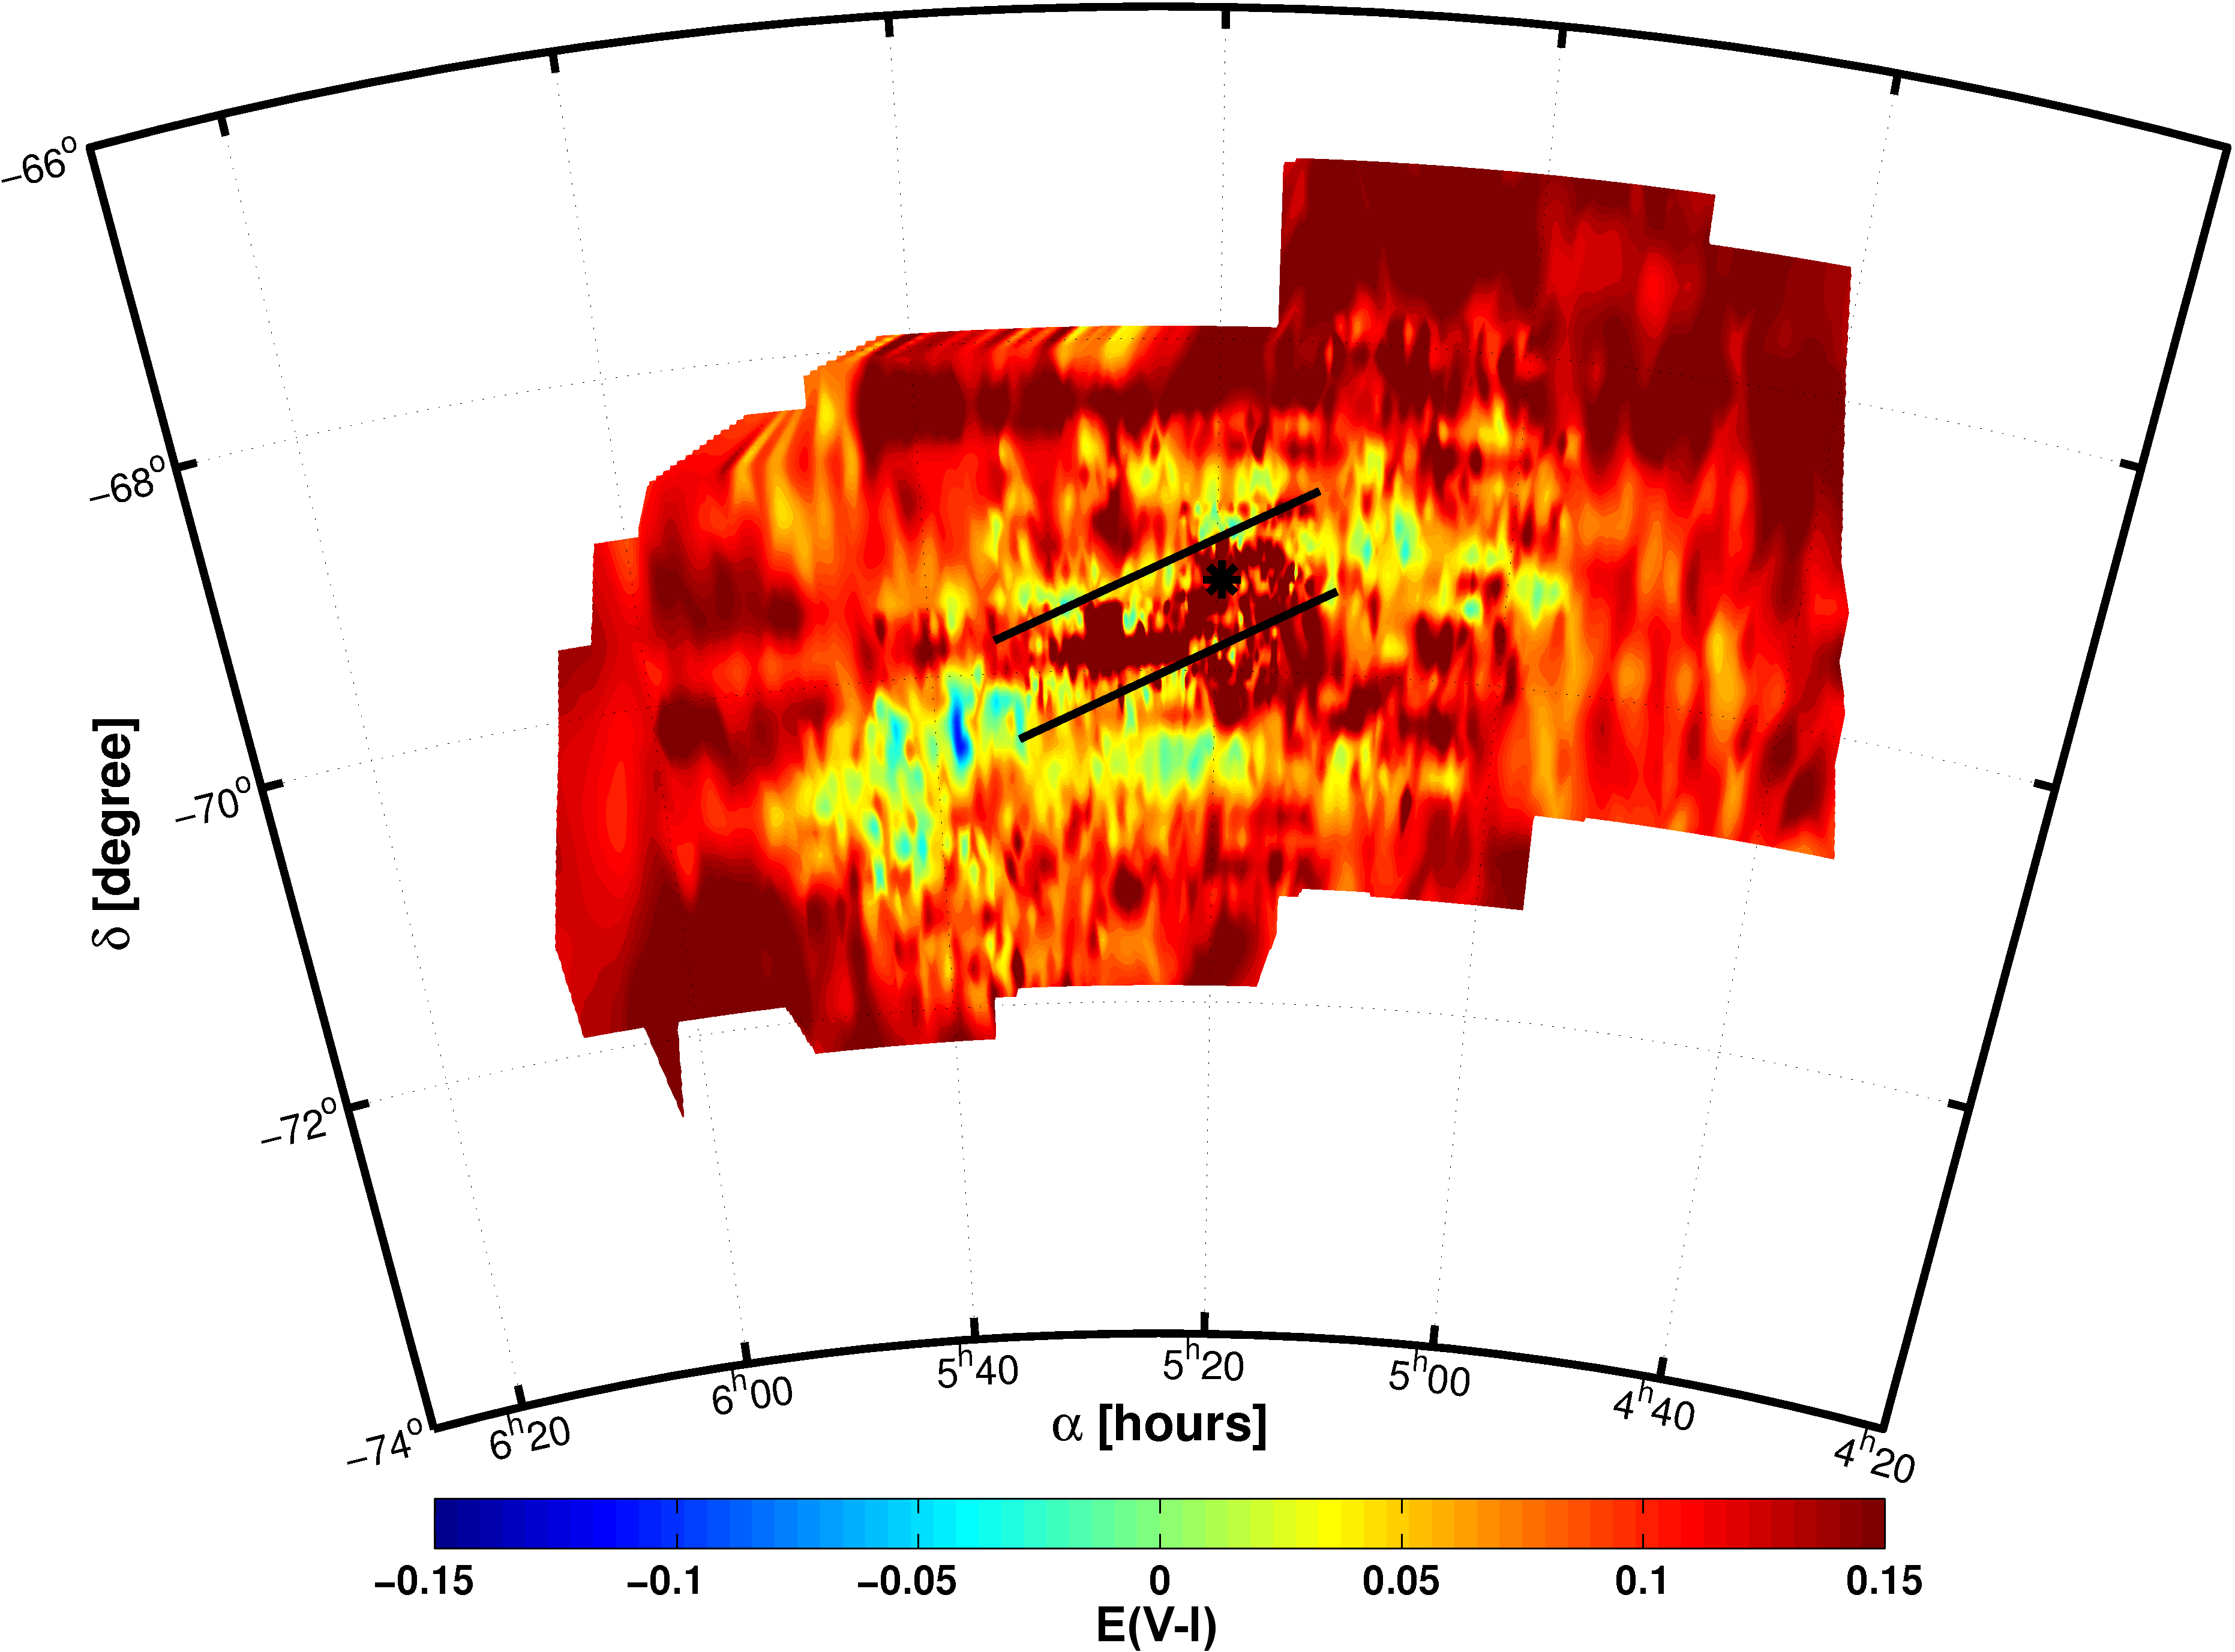
For better comparability of the differences we compute the averages of Z04’s reddening values in the 3174 LMC fields used for the RC method and subtract from the resulting . The comparison maps for the LMC are shown in Figure 17 and Figure 18. The reddening maps for the LMC reveal differences between our two approaches and the Z04 estimate that exceed the errors found for the RC and RR Lyrae reddening values. While the central parts of the LMC are in general agreement, the reddening values for the less populated parts are considerably higher in the Z04 calculations. The origin of these differences remains unclear. Two major differences have to be taken into consideration: the different kinds of stars used and the different methods. Z02 and Z04 used stellar atmosphere models (from Lejeune et al., 1997) to calculate the reddening for each star, while we use models of the location of RC stars in a CMD to assume absolute magnitudes.
The mean difference between our RC map and Z04’s values is 0.10 mag. For only 2% of all fields the mean reddening of the Z04 stars located therein is lower than the corresponding RC reddening. The reddening differences range from to 0.46 mag. About of all fields differ by more than 0.12 mag.
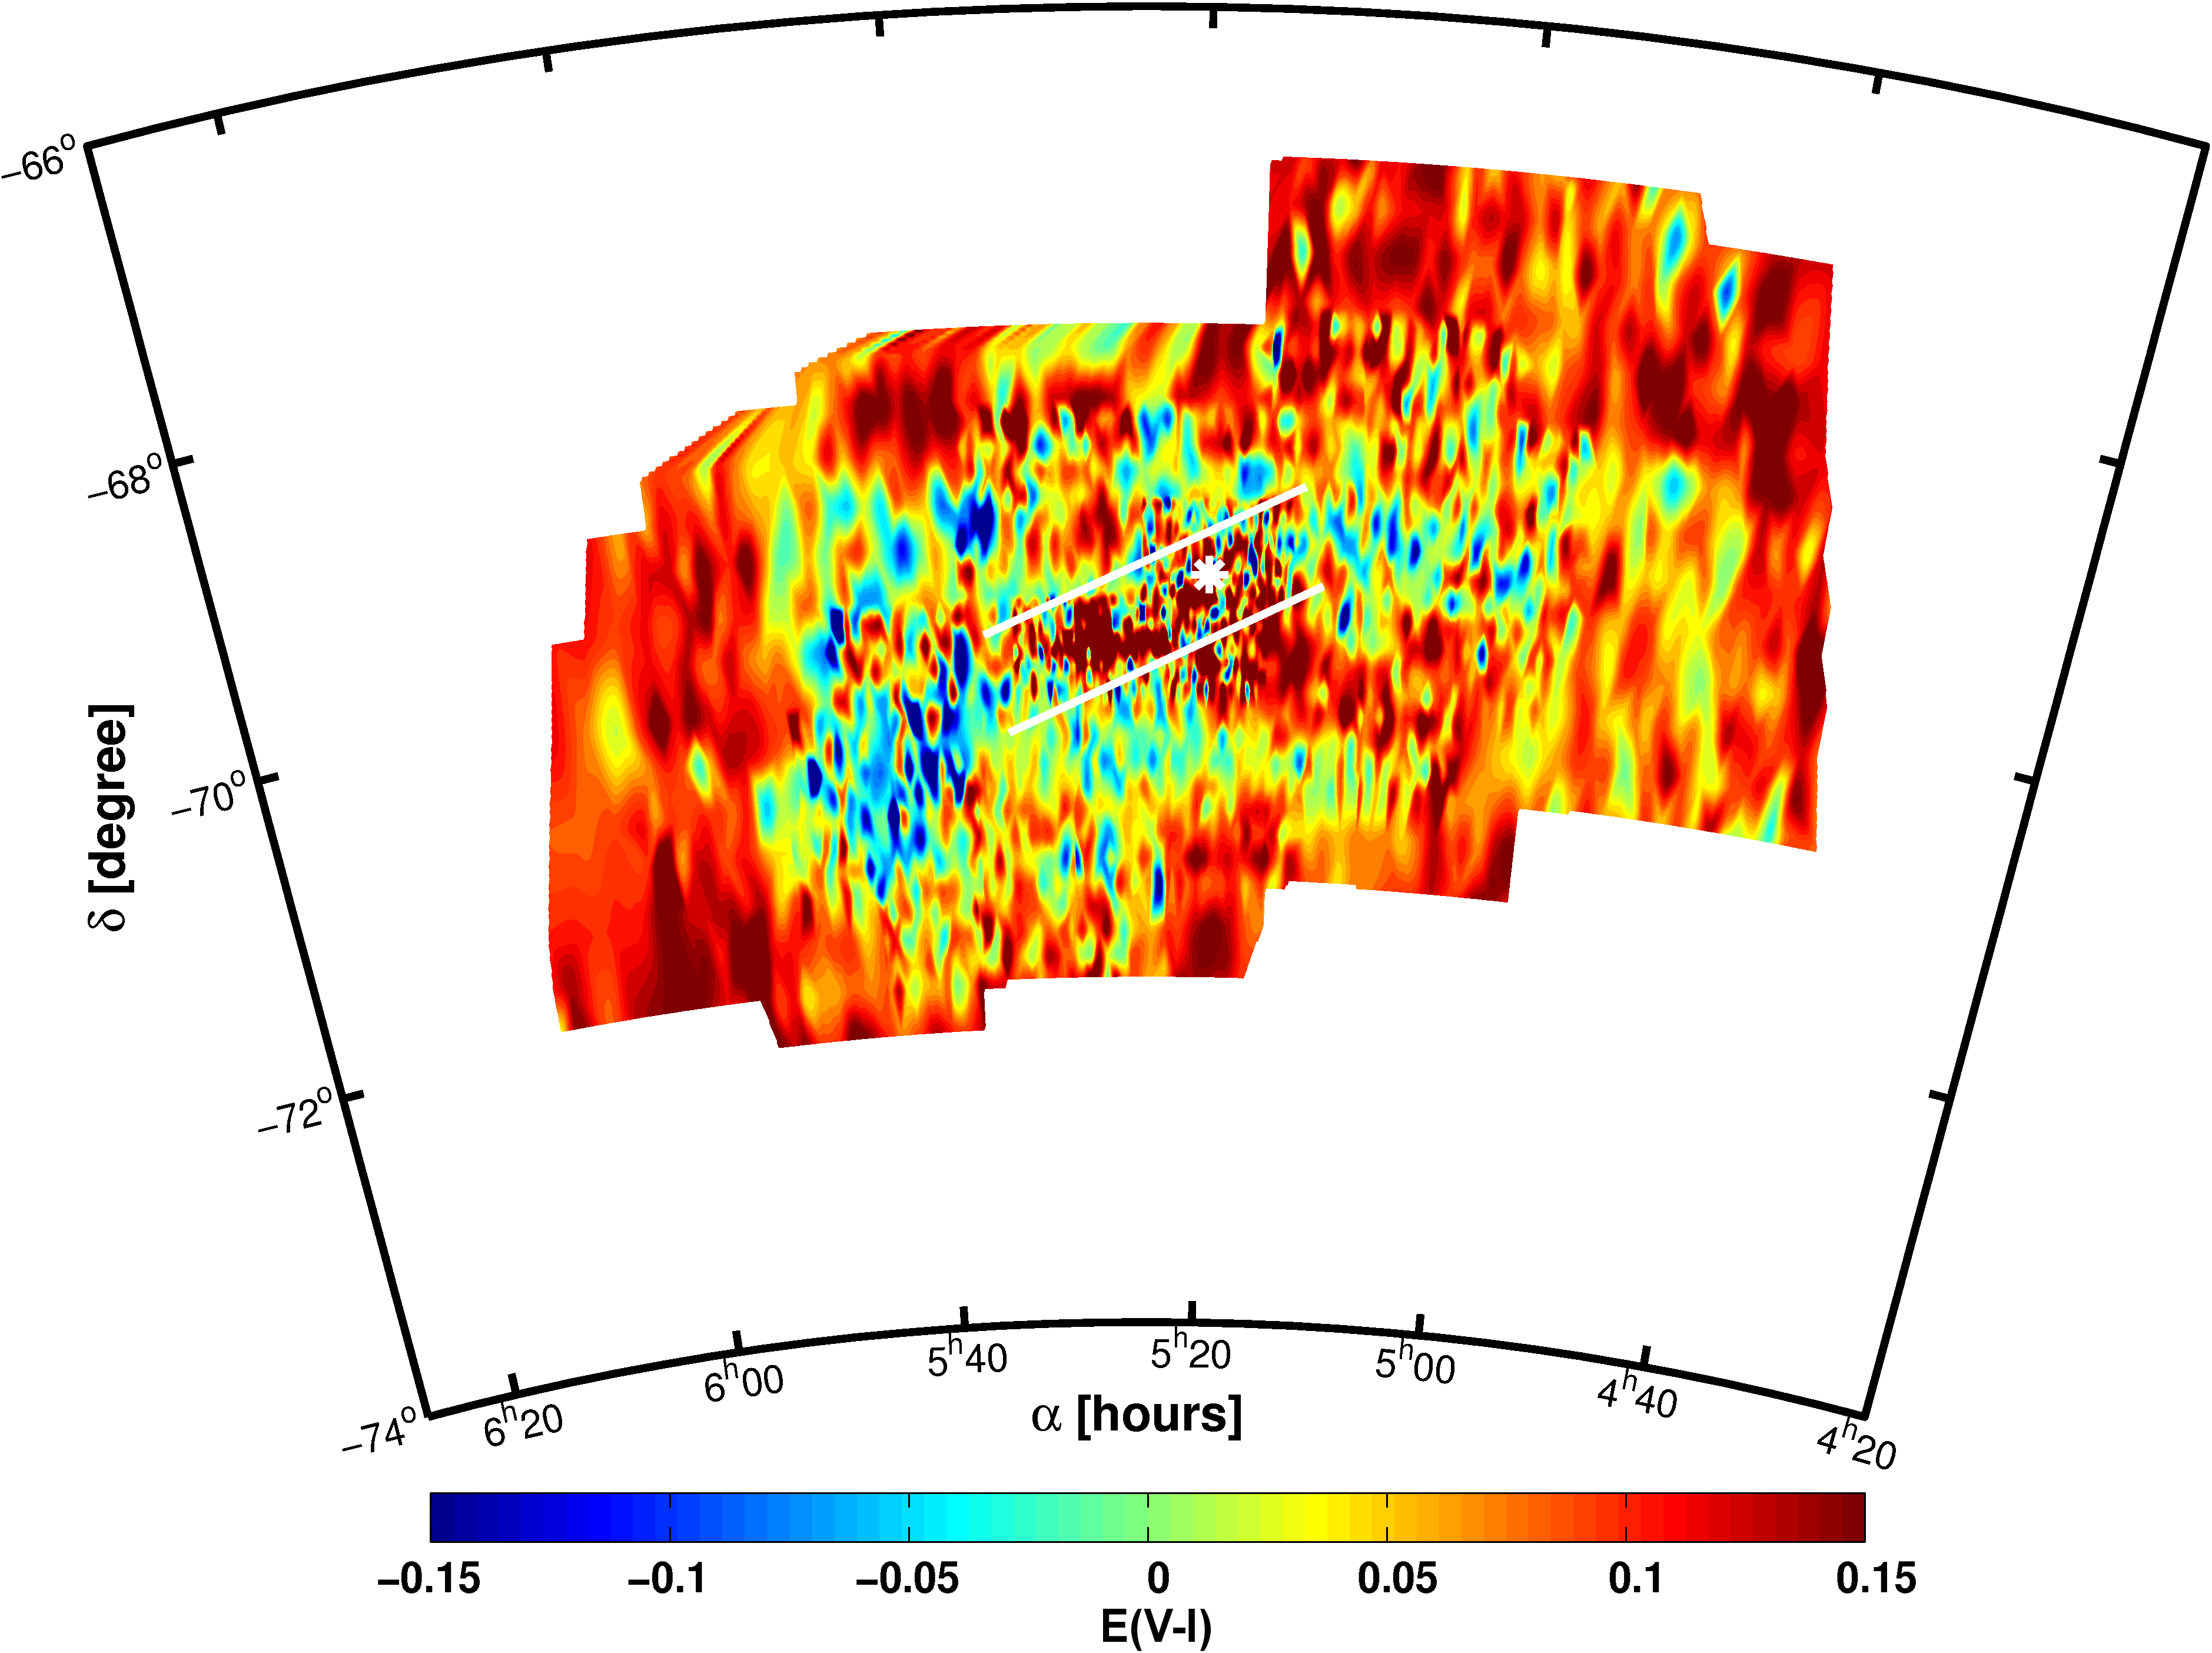
In order to compare our RR Lyrae reddening values with Z04’s reddening estimates for the LMC we use the equation . As for the RC reddening we average the RR Lyrae and the Z04 reddening in the grid set up for the RC method. This allows us to compare not single star values but mean values with each other.
The mean difference is found to be 0.07 mag (Figure 18), while the differences reach extremes of up to 0.50 mag and down to mag. of all fields have negative values, while have discrepancies larger than . As for the comparison with the RC method, these two maps are not in very good agreement. Especially the offset for the central region is striking. The origin of the rather high reddening residuals of Z04 in the centre of the LMC (Figure 17 and 18) remains unclear. It has no counterpart in other reddening maps in the literature.
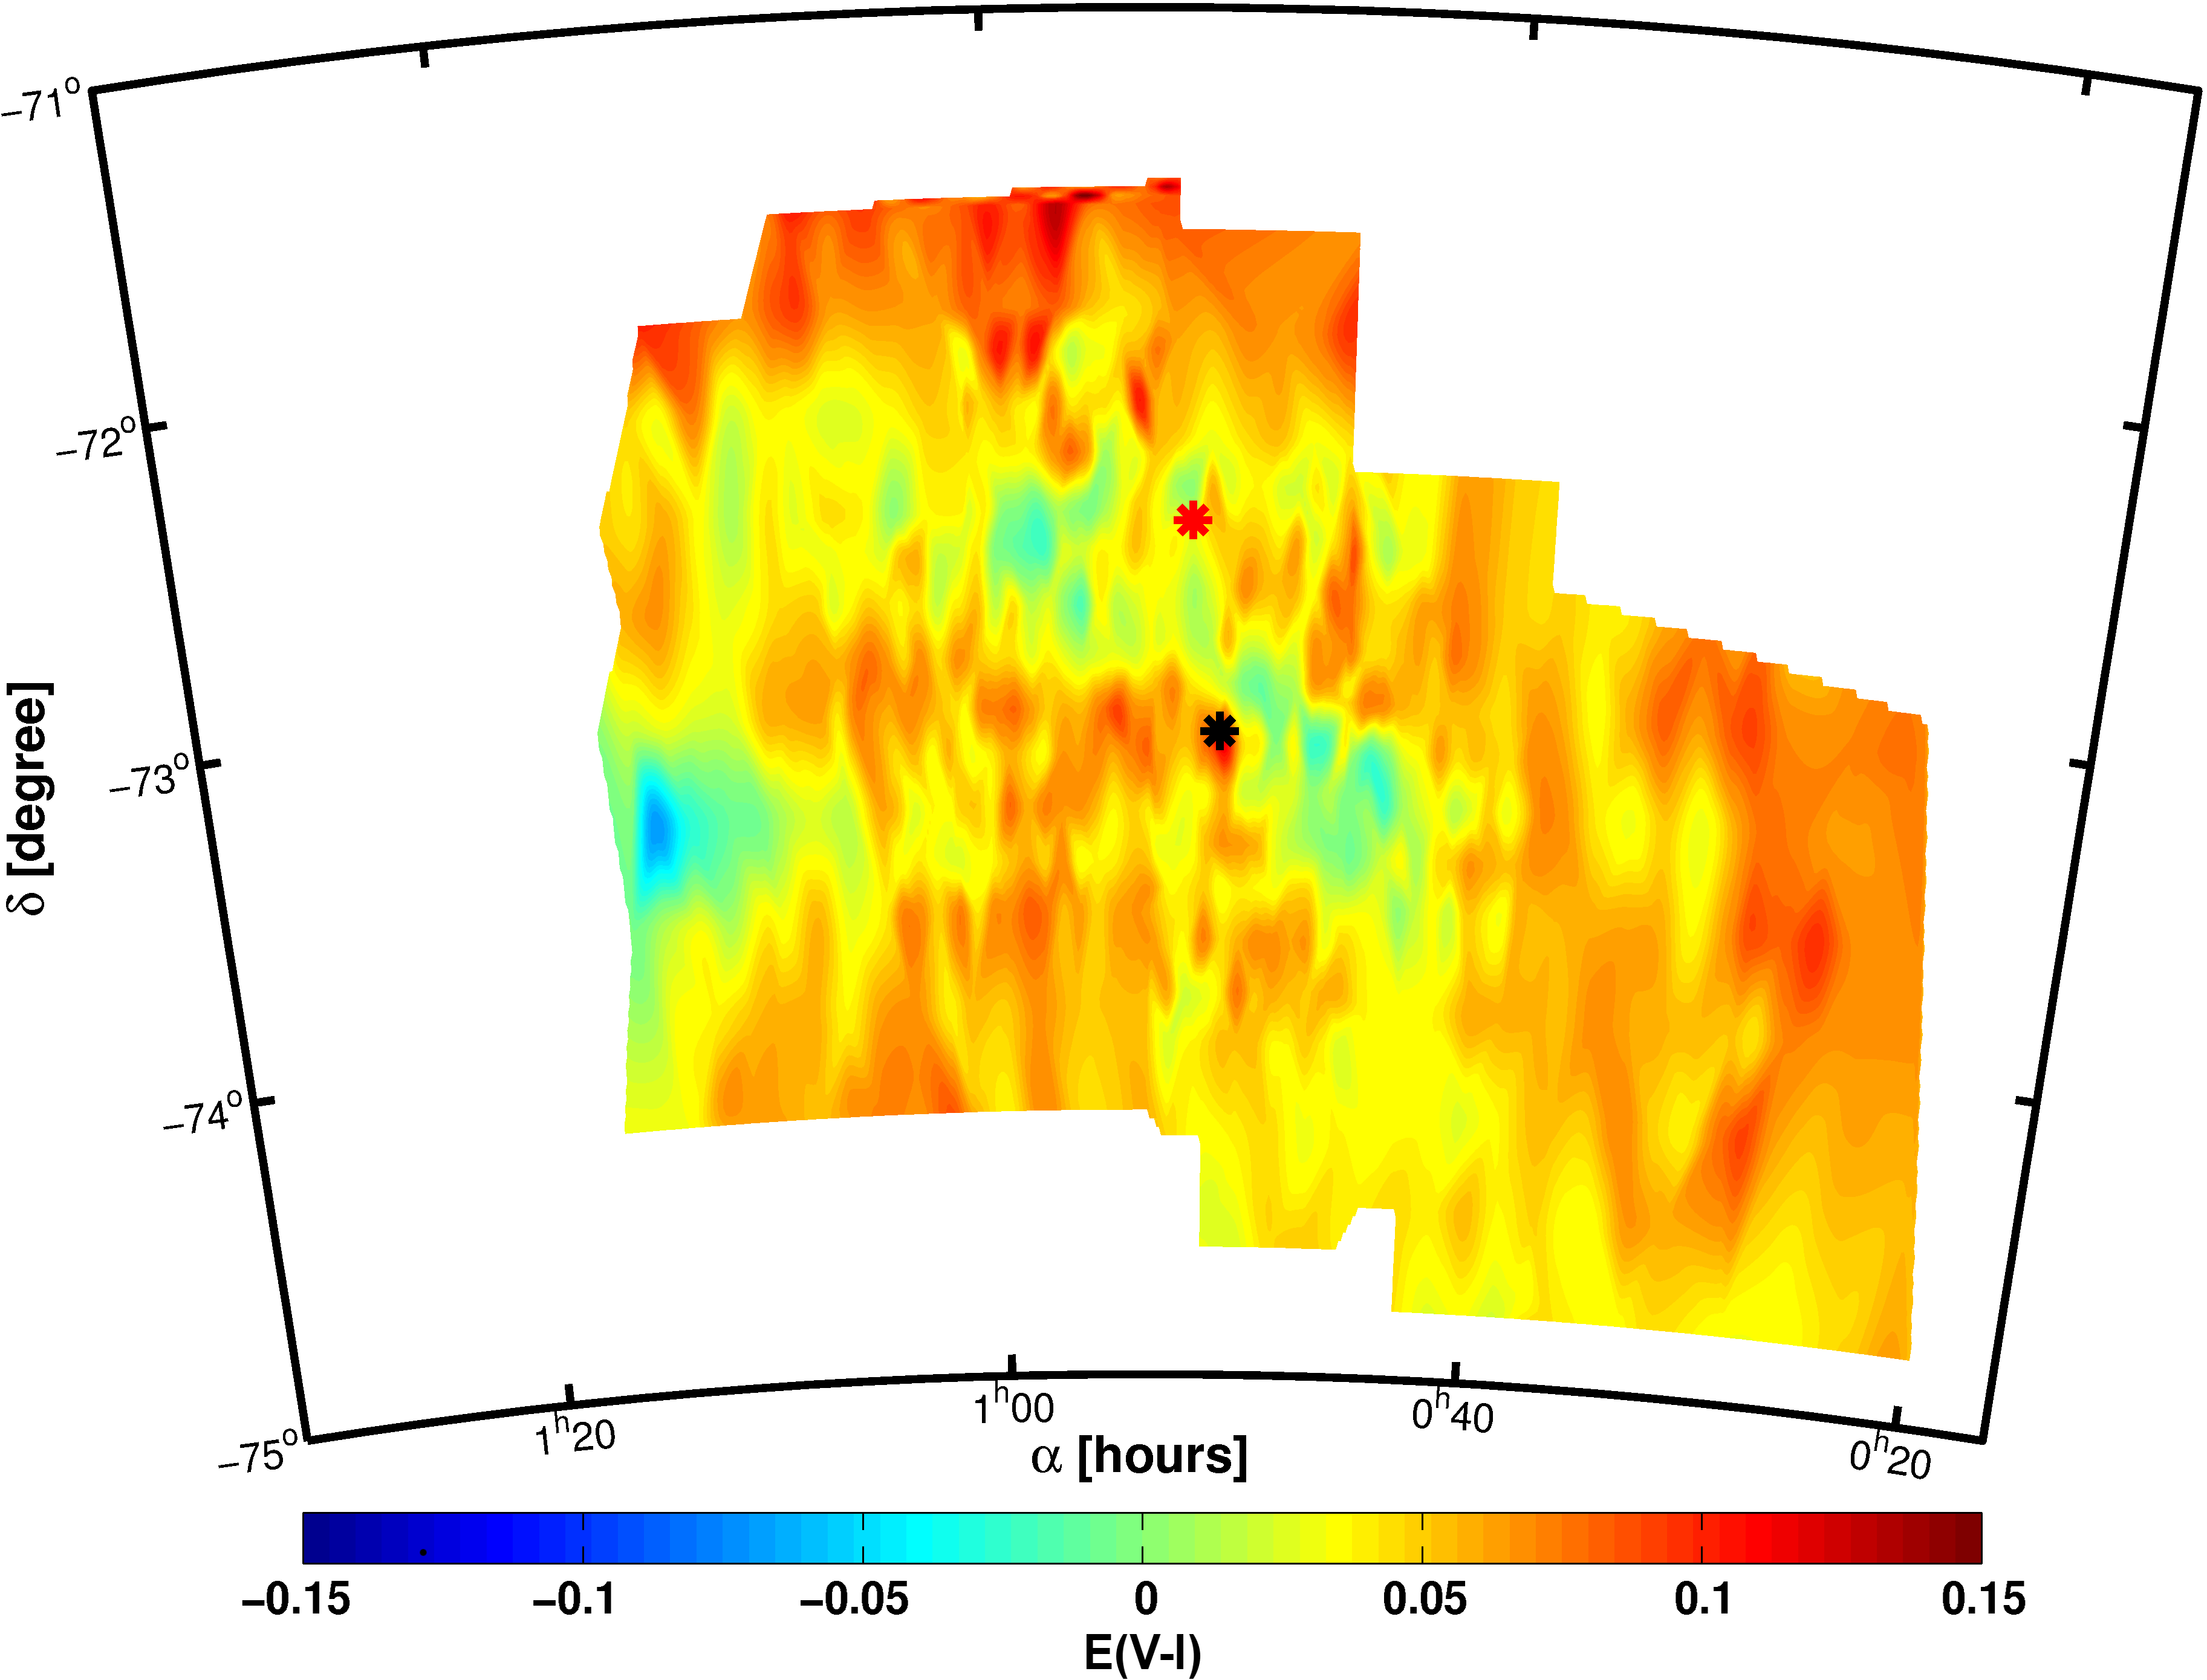
In contrast the agreement in the reddening values of the SMC derived via the RC method and the Z02 values is very good. We compute and find that the median difference is only 0.04 mag, while a general slight trend to higher values is obvious (Figure 19). But this offset is still well within the errors stated for the SMC reddening in our work. For the SMC about of the stars have lower reddening in Z02 than the corresponding value from the RC method and only 2 fields have differences larger than 0.12 mag. The extremes range from mag to 0.13 mag.
Comparing the reddening maps from Z02 and the RR Lyrae we find even better agreement (Figure 20) if we average the RR Lyrae values in the fields defined by the RC method. The difference is in agreement with zero, while the individual fields vary between and 0.18 mag. The number of RR Lyrae stars per RC field is very low and the small number statistics lead to variations. Therefore we do not interpret the small scale variations as real features. Anyhow we find that there is an overall good agreement between the new reddening maps and the maps provided by Z02. Thus the reason for the large reddening differences for the LMC remains unsolved.
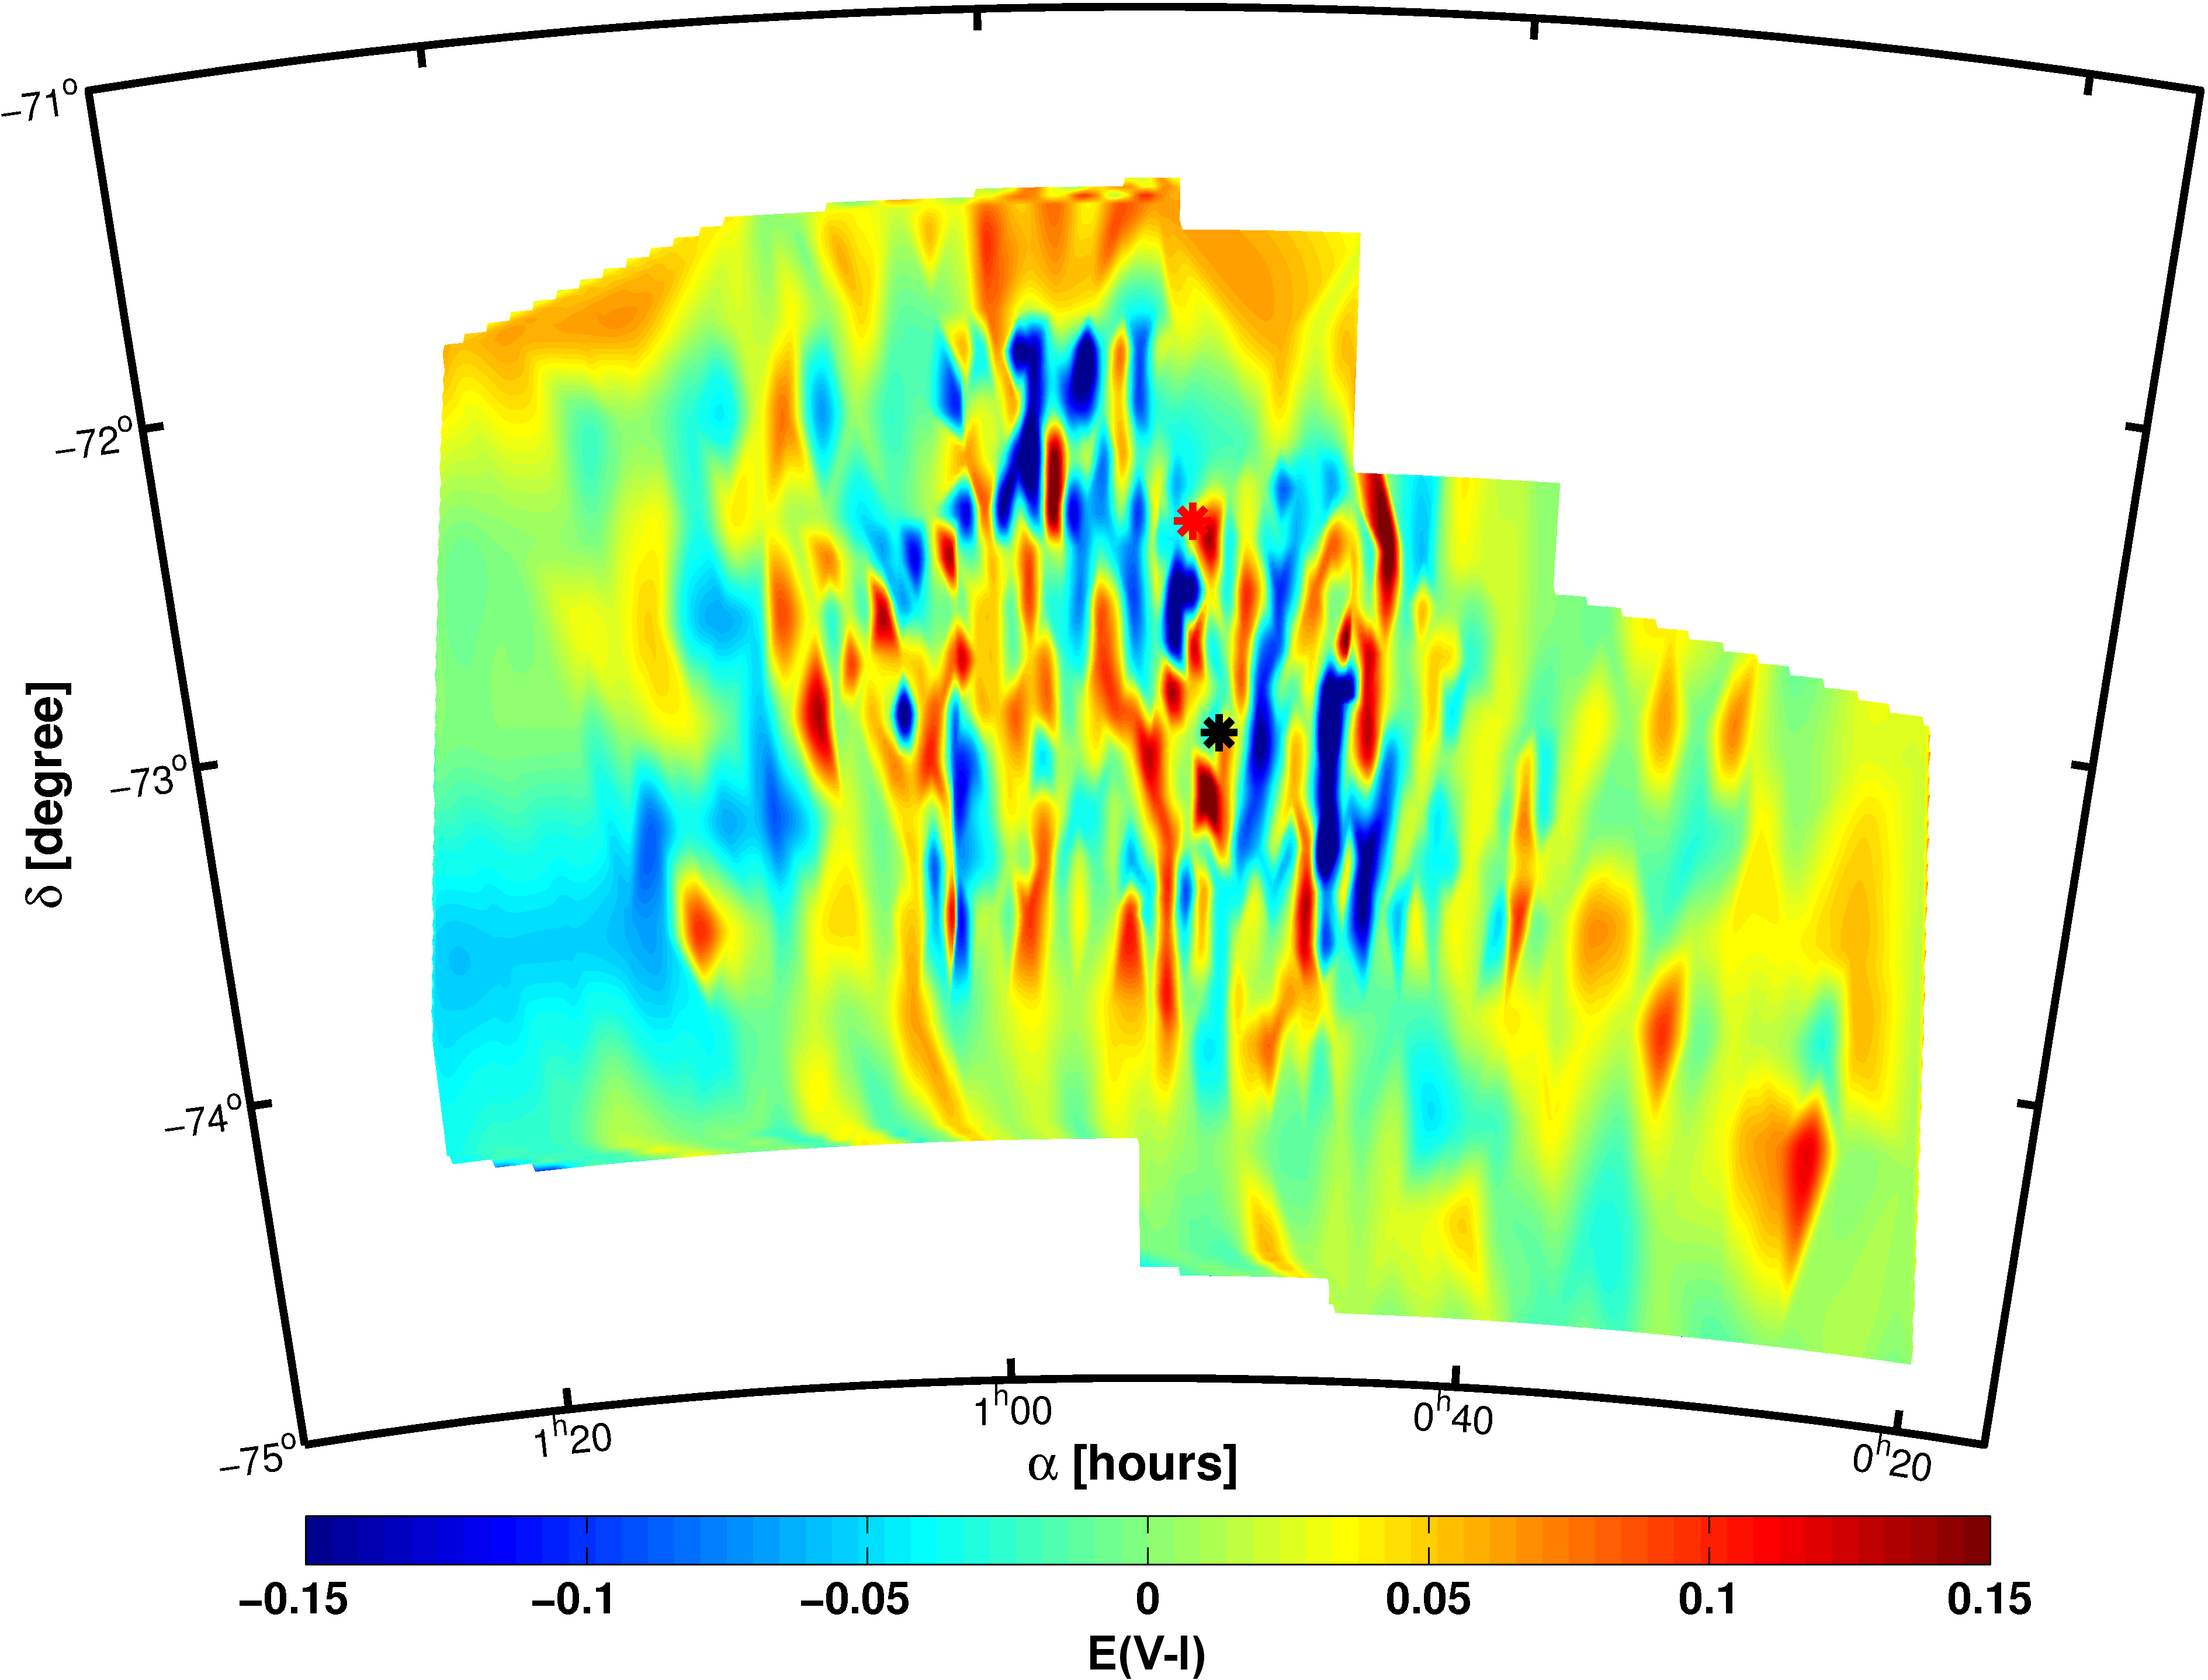
5.6. Other comparisons
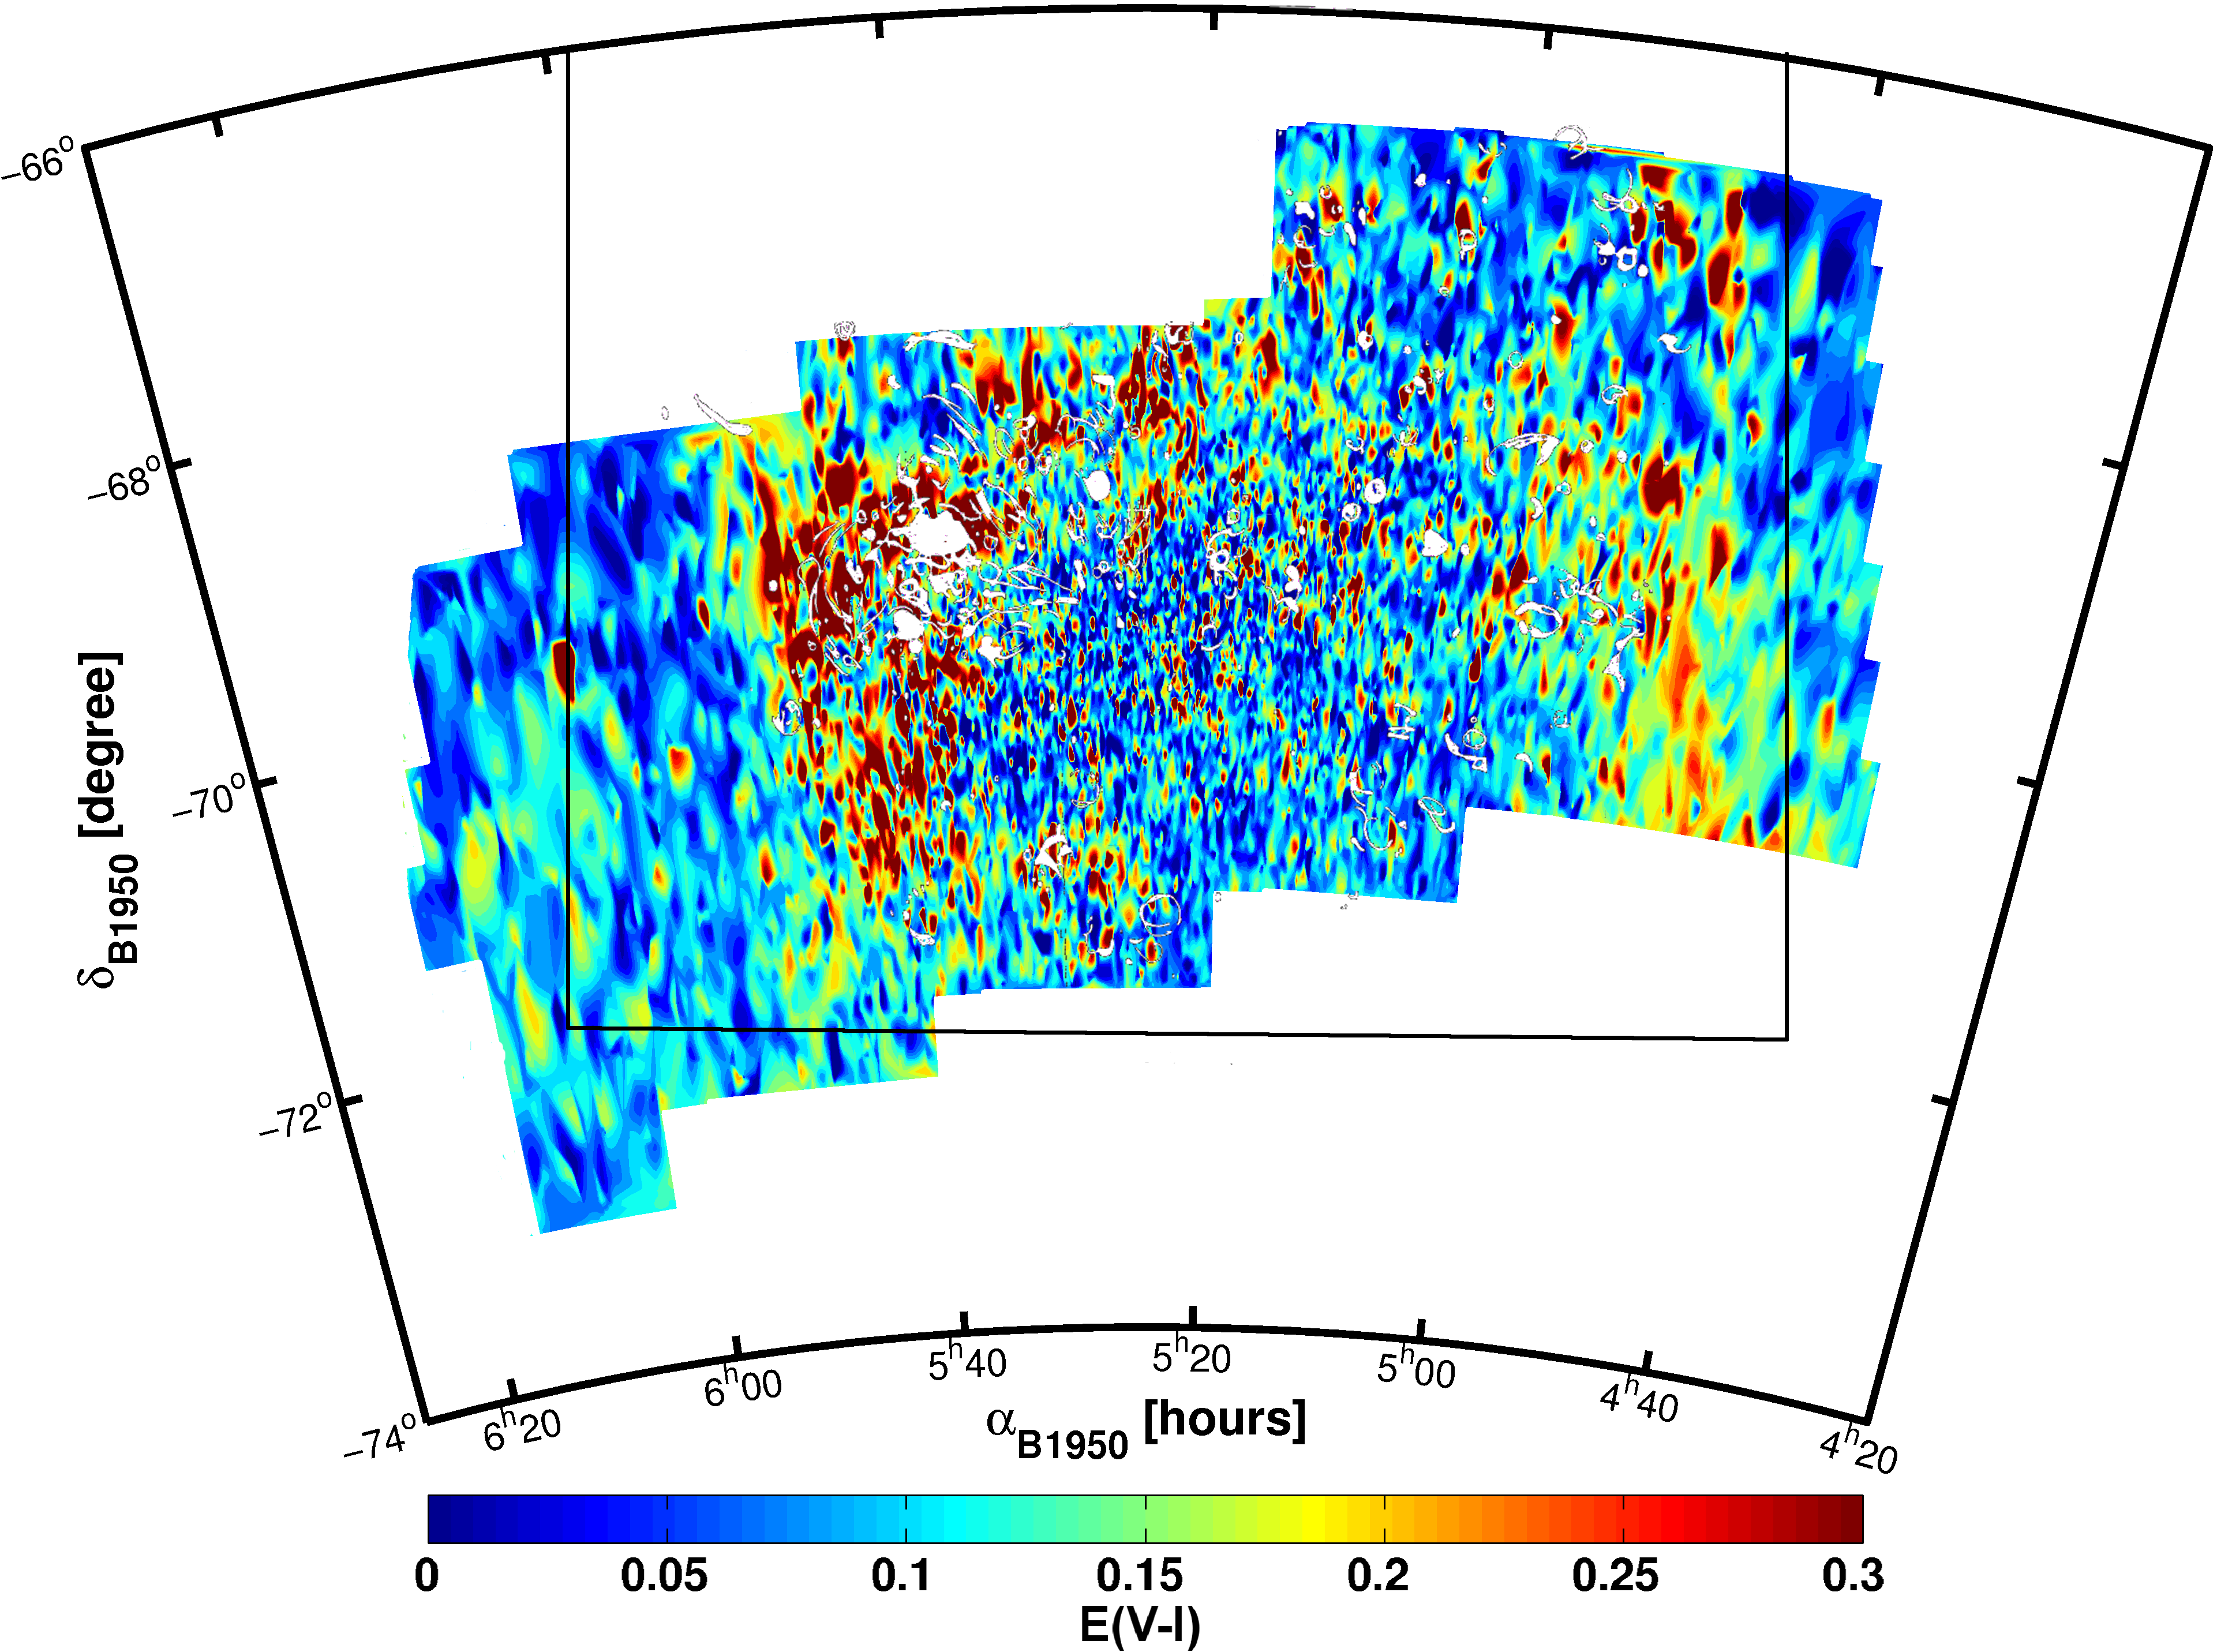
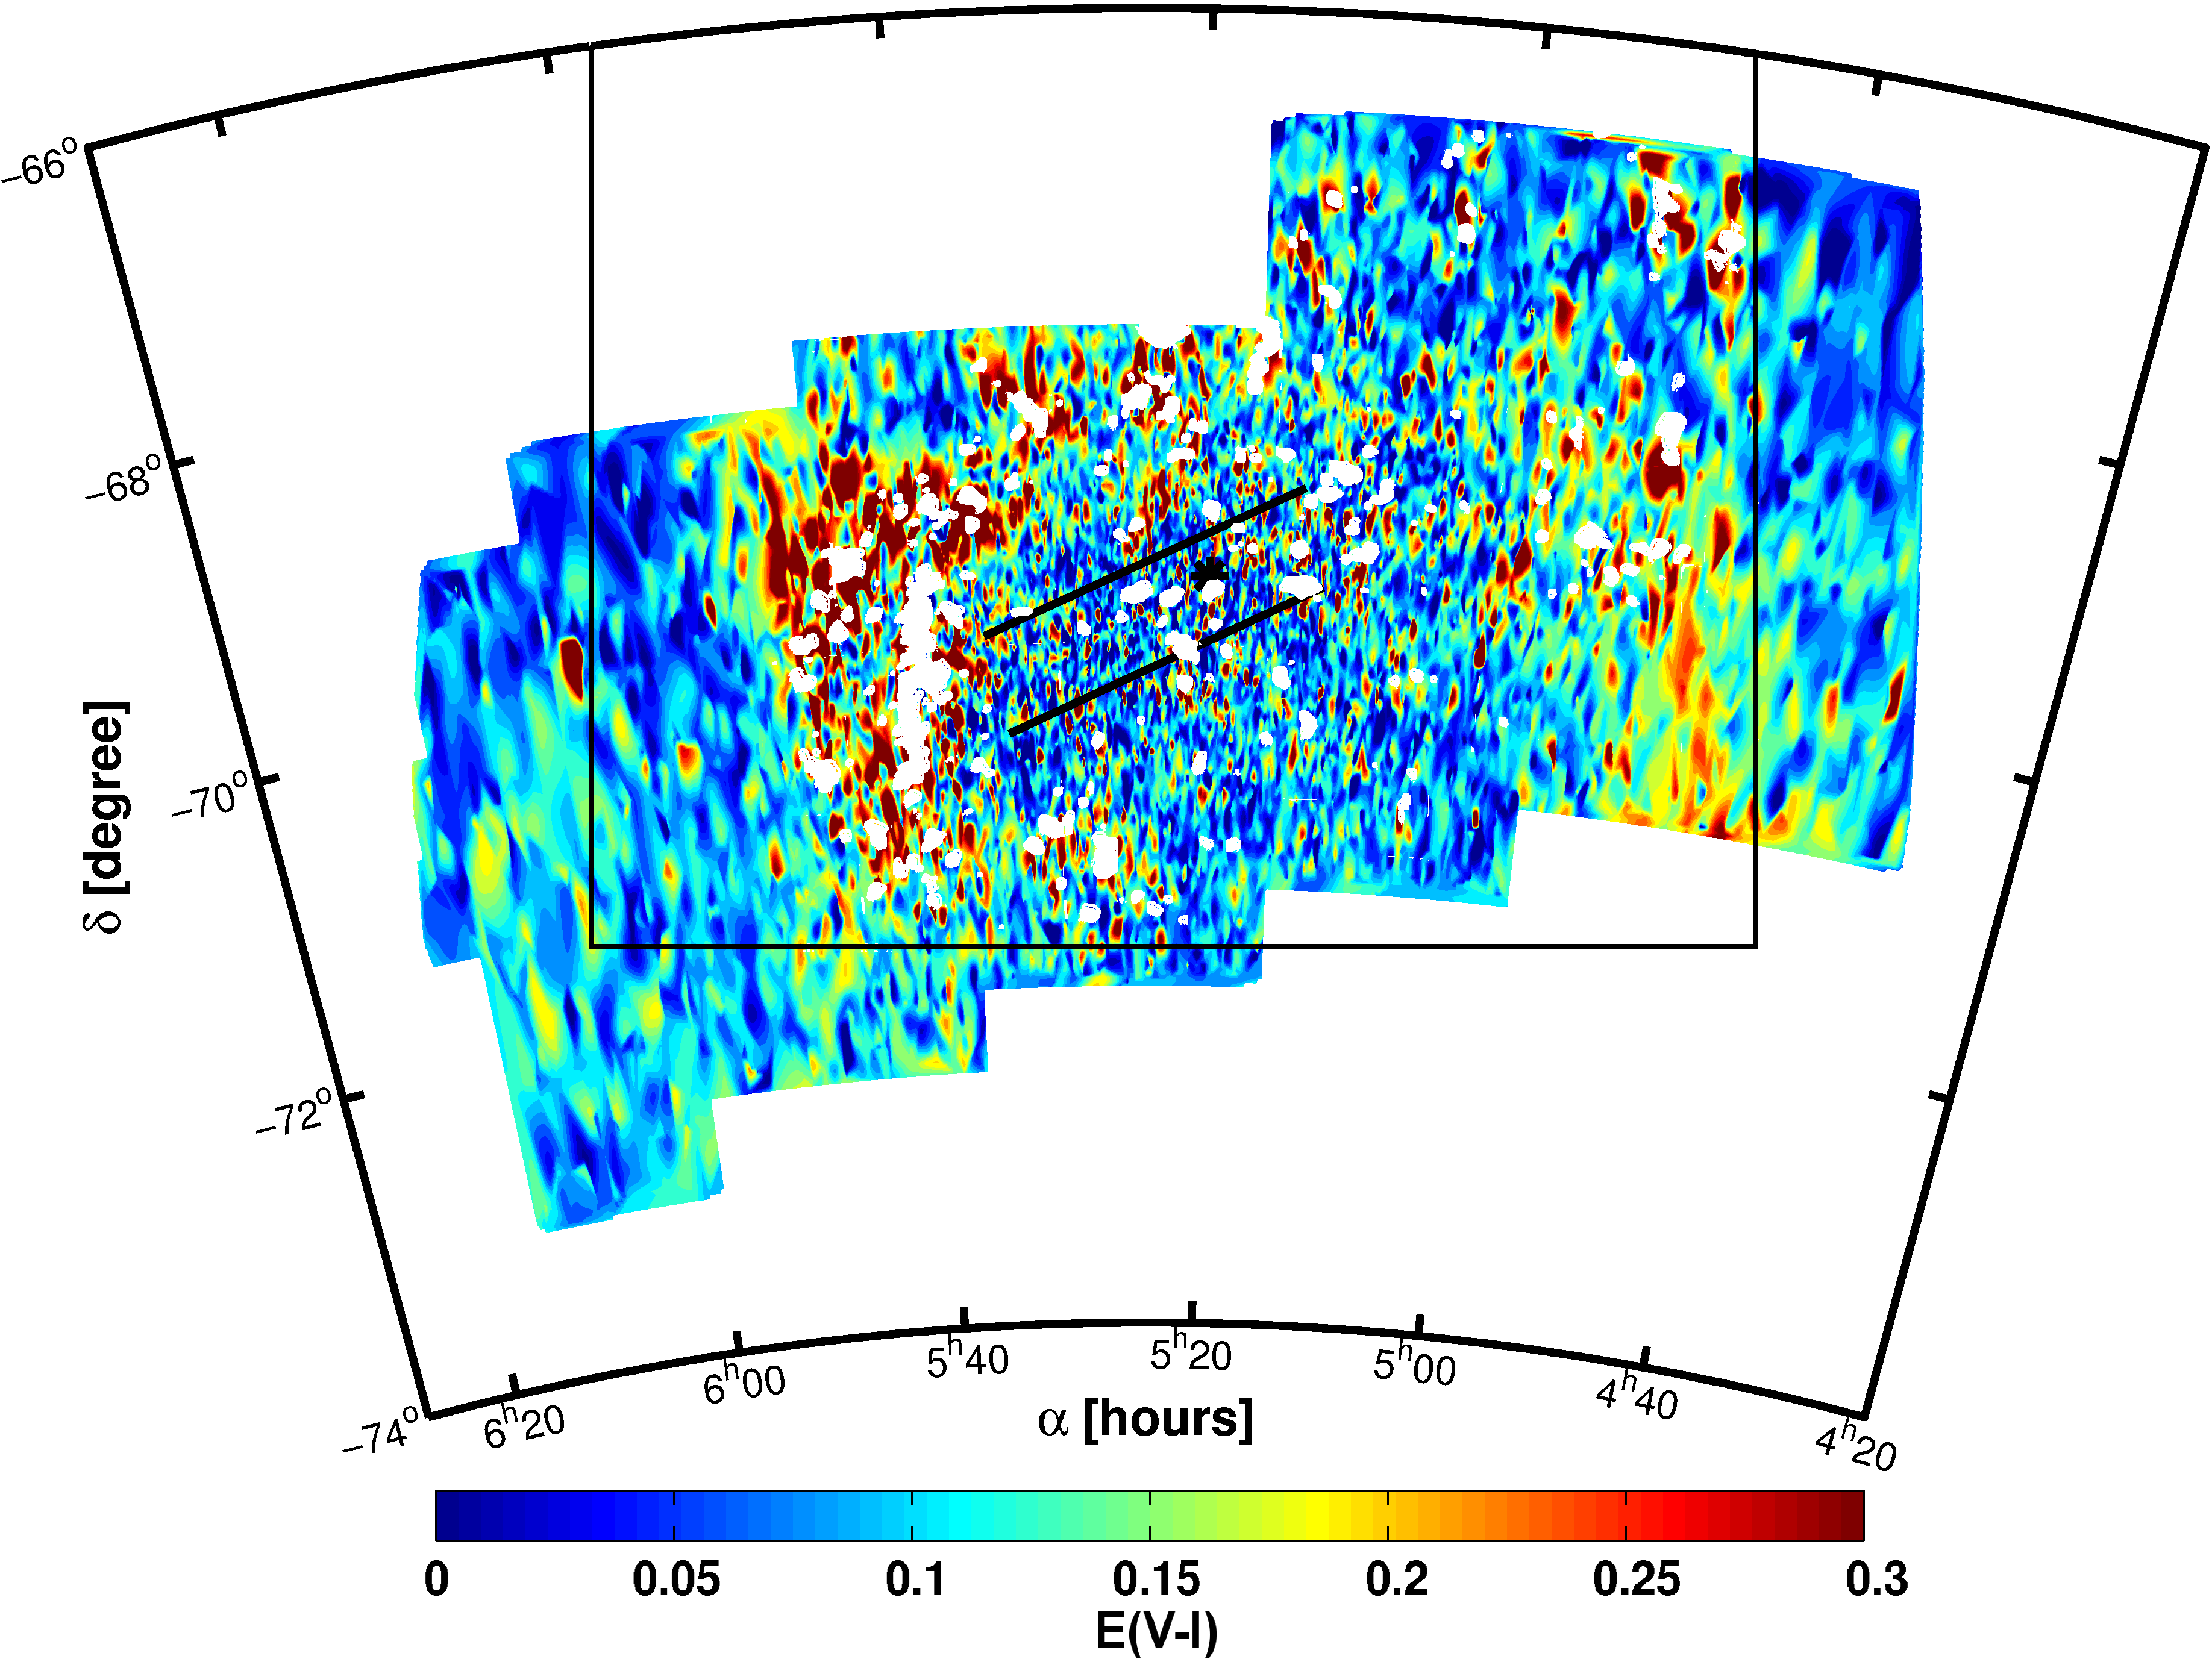
In this section we will compare our reddening maps, mainly qualitatively, with the distribution of H II regions in the LMC (Davies et al., 1976; Book et al., 2008, 2009) and SMC (Davies et al., 1976; Bica & Schmitt, 1995), with LMC CO maps, tracing molecular hydrogen clouds, by Fukui et al. (2008) and the Spitzer dust maps by Meixner et al. (2006) for the LMC and Bolatto et al. (2007) for the SMC.
We overlay the maps of Davies et al. (1976) of the LMC and SMC with our reddening maps (Figure 21). Visual inspection does not always show a noticeable increase of reddening at the positions of the H II regions. We tentatively attribute this to effects of dust destruction by hot massive stars in the HII regions as well as to stellar winds that push gaseous and dusty material out of the forming cavity within the HII regions. Furthermore we compare the central positions of the H II regions, taken from Davies et al. (1976); Bica & Schmitt (1995); Book et al. (2008, 2009), with the reddening values at that spatial location and find the reddening to be increased by 0.03 mag for the LMC and SMC, respectively.
In Figure 22 the map of molecular hydrogen clouds as observed by NANTEN (Fukui et al., 2008), and traced by CO, is superimposed with the reddening from the RR Lyrae stars. We find very good agreement of regions with enhanced reddening and the location of the clouds. This visual impression is verified by the computation of the mean reddening at the spatial positions of the molecular clouds. We find that the reddening is enhanced to a median value of mag.
Finally we inspect the images of the SAGE (Surveying the Agents of Galaxy Evolution) survey of the LMC (Meixner et al., 2006) and find very good agreement of their m map with the LMC reddening map as obtained by us. The 8m emission originates from small dust grains as traced by polycyclic aromatic hydrocarbons (PAHs) located in the outskirts of star-forming regions (Meixner et al., 2006). Only the region of enhanced reddening in the south-west is not reproduced. However, we find good agreement of this region in the 160m map of Spitzer. The absorbtion feature at larger wavelength are caused by greater particles. The 160 m maps trace emission of relatively large and cool ( K) dust grains at larger distances from star-forming regions (Meixner et al., 2006). The SAGE-SMC (Bolatto et al., 2007) maps show very good agreement with the reddening map of the SMC as obtained by us.
6. Summary
In this paper new optical reddening maps for the Magellanic Clouds are presented using two different methods based on OGLE III photometry. The first one uses the theoretical position of the RC in colour in the CMD for a given mean metallicity. The observed shift of the measured RC position is used to determine the reddening. For this purpose we subdivide the original OGLE III fields into smaller fields and determine the mean colour of the RC in each of them. The size of the fields varies depending on the number of stars in each field. For the LMC we obtain 3174 subfields with a mean density of 1257 stars, while for the SMC the reddening is calculated in 693 subfields, with an average of 1318 stars per field.
The maps show in general a low reddening. In the LMC we find a mean mag and for the SMC mag. Nevertheless some regions show a much higher reddening. The star-forming region 30 Doradus in the LMC shows values up to mag. The high differential reddening in this region broadens the distribution of the RC stars and there is an extended tail of even higher reddening values in this region. Another region with high reddening is found in the southwest of the examined OGLE III field and coincides with an H I region. In contrast to the highly extincted star-forming regions the reddening in the bar of the LMC is quite low.
For the SMC the RC method reveals three pronounced areas of higher reddening. The highest reddening is reached, with mag, in an H II region in the wing. The other two regions are located in the bar. But overall the reddening is quite low.
For the second method the observed colour of RR Lyrae stars in the MCs is compared with the colour predictions of the calculated absolute magnitudes. These depend on the period and metallicity. The metallicity is evaluated via the Fourier decomposition of the lightcurve of each star. We obtain an independent reddening for each RR Lyrae star. For the LMC a median reddening of mag is obtained. In the star-forming region 30 Doradus the reddening reaches values up to mag. The RR Lyrae reveal a mean reddening of the SMC of mag.
The comparison with reddening maps derived from other studies show mostly good agreement. Moreover, a qualitative comparison with Spitzer maps shows areas of high reddening to coincide with regions of high dust emissivity from PAHs or larger dust grains at 8 and 160 m, respectively.
These new reddening maps show a consistent picture of the reddening distribution of both Magellanic Clouds. we make our position-dependent reddening values derived with the RC method available via the German Astrophysical Virtual Observatory (GAVO) interface at http://dc.zah.uni-heidelberg.de/mcx.
References
- Alcock et al. (2000) Alcock, C., et al. 2000, AJ, 119, 2194
- Aubourg et al. (1993) Aubourg, E., et al. 1993, The Messenger, 72, 20
- Barcza (2010) Barcza, S. 2010, MNRAS, 406, 486
- Bica & Schmitt (1995) Bica, E. L. D., & Schmitt, H. R. 1995, ApJS, 101, 41
- Bolatto et al. (2007) Bolatto, A. D., et al. 2007, ApJ, 655, 212
- Book et al. (2008) Book, L. G., Chu, Y., & Gruendl, R. A. 2008, ApJS, 175, 165
- Book et al. (2009) Book, L. G., Chu, Y., Gruendl, R. A., & Fukui, Y. 2009, AJ, 137, 3599
- Borissova et al. (2009) Borissova, J., Rejkuba, M., Minniti, D., Catelan, M., & Ivanov, V. D. 2009, A&A, 502, 505
- Bragaglia et al. (2001) Bragaglia, A., et al. 2001, AJ, 121, 327
- Cardelli et al. (1989) Cardelli, J. A., Clayton, G. C., & Mathis, J. S. 1989, ApJ, 345, 245
- Catelan et al. (2004) Catelan, M., Pritzl, B. J., & Smith, H. A. 2004, ApJS, 154, 633
- Cignoni et al. (2009) Cignoni, M., et al. 2009, AJ, 137, 3668
- Cohen & Meléndez (2005) Cohen, J. G., & Meléndez, J. 2005, AJ, 129, 303
- Cole (1998) Cole, A. A. 1998, ApJ, 500, L137
- Cole et al. (2005) Cole, A. A., Tolstoy, E., Gallagher, III, J. S., & Smecker-Hane, T. A. 2005, AJ, 129, 1465
- Cook et al. (1992) Cook, K., et al. 1992, in Bulletin of the American Astronomical Society, Vol. 24, 1179
- Davies et al. (1976) Davies, R. D., Elliott, K. H., & Meaburn, J. 1976, MmRAS, 81, 89
- de Vaucouleurs & Freeman (1972) de Vaucouleurs, G., & Freeman, K. C. 1972, Vistas in Astronomy, 14, 163
- Dobashi et al. (2008) Dobashi, K., Bernard, J.-P., Hughes, A., Paradis, D., Reach, W. T., & Kawamura, A. 2008, A&A, 484, 205
- Dobashi et al. (2009) Dobashi, K., Bernard, J.-P., Kawamura, A., Egusa, F., Hughes, A., Paradis, D., Bot, C., & Reach, W. T. 2009, AJ, 137, 5099
- Freedman et al. (2001) Freedman, W. L., et al. 2001, ApJ, 553, 47
- Fukui et al. (2008) Fukui, Y., et al. 2008, ApJS, 178, 56
- Girardi & Salaris (2001) Girardi, L., & Salaris, M. 2001, MNRAS, 323, 109
- Glatt et al. (2008a) Glatt, K., et al. 2008a, AJ, 136, 1703
- Glatt et al. (2008b) —. 2008b, AJ, 135, 1106
- Gonidakis et al. (2009) Gonidakis, I., Livanou, E., Kontizas, E., Klein, U., Kontizas, M., Belcheva, M., Tsalmantza, P., & Karampelas, A. 2009, A&A, 496, 375
- Gordon et al. (2003) Gordon, K. D., Clayton, G. C., Misselt, K. A., Landolt, A. U., & Wolff, M. J. 2003, ApJ, 594, 279
- Grebel & Roberts (1995) Grebel, E. K., & Roberts, W. J. 1995, A&AS, 109, 293
- Guldenschuh et al. (2005) Guldenschuh, K. A., et al. 2005, PASP, 117, 721
- Haschke et al. (in prep.) Haschke, R., Grebel, E. K., & Duffau, S. in prep.
- Høg et al. (2000) Høg, E., et al. 2000, A&A, 355, L27
- Jurcsik & Kovács (1996) Jurcsik, J., & Kovács, G. 1996, A&A, 312, 111
- Kim et al. (1998) Kim, S., Staveley-Smith, L., Dopita, M. A., Freeman, K. C., Sault, R. J., Kesteven, M. J., & McConnell, D. 1998, ApJ, 503, 674
- Kovács & Jurcsik (1996) Kovács, G., & Jurcsik, J. 1996, ApJ, 466, L17
- Kovács & Zsoldos (1995) Kovács, G., & Zsoldos, E. 1995, A&A, 293, L57
- Lejeune et al. (1997) Lejeune, T., Cuisinier, F., & Buser, R. 1997, A&AS, 125, 229
- Livanou et al. (2007) Livanou, E., et al. 2007, AJ, 133, 2179
- Matteucci et al. (2002) Matteucci, A., Ripepi, V., Brocato, E., & Castellani, V. 2002, A&A, 387, 861
- Meixner et al. (2006) Meixner, M., et al. 2006, AJ, 132, 2268
- Olsen & Salyk (2002) Olsen, K. A. G., & Salyk, C. 2002, AJ, 124, 2045
- Pejcha & Stanek (2009) Pejcha, O., & Stanek, K. Z. 2009, ApJ, 704, 1730
- Piatek et al. (2008) Piatek, S., Pryor, C., & Olszewski, E. W. 2008, AJ, 135, 1024
- Puzeras et al. (2010) Puzeras, E., Tautvaišienė, G., Cohen, J. G., Gray, D. F., Adelman, S. J., Ilyin, I., & Chorniy, Y. 2010, MNRAS, 408, 1225
- Sabbi et al. (2009) Sabbi, E., et al. 2009, ApJ, 703, 721
- Sandage & Tammann (2006) Sandage, A., & Tammann, G. A. 2006, ARA&A, 44, 93
- Schlegel et al. (1998) Schlegel, D. J., Finkbeiner, D. P., & Davis, M. 1998, ApJ, 500, 525
- Skrutskie et al. (2006) Skrutskie, M. F., et al. 2006, AJ, 131, 1163
- Smith (2004) Smith, H. A. 2004, RR Lyrae Stars, ed. Smith, H. A.
- Smolec (2005) Smolec, R. 2005, Acta Astronomica, 55, 59
- Soszyński et al. (2010) Soszyński, I., Udalski, A., Szymański, M. K., Kubiak, J., Pietrzyński, G., Wyrzykowski, Ł., Ulaczyk, K., & Poleski, R. 2010, Acta Astronomica, 60, 165
- Soszyński et al. (2009) Soszyński, I., et al. 2009, Acta Astronomica, 59, 1
- Sturch (1966) Sturch, C. 1966, ApJ, 143, 774
- Subramaniam (2005) Subramaniam, A. 2005, A&A, 430, 421
- Subramanian & Subramaniam (2009) Subramanian, S., & Subramaniam, A. 2009, A&A, 496, 399
- Udalski (2003) Udalski, A. 2003, Acta Astronomica, 53, 291
- Udalski et al. (1997) Udalski, A., Kubiak, M., & Szymanski, M. 1997, Acta Astronomica, 47, 319
- Udalski et al. (1999a) Udalski, A., Soszyński, I., Szymanski, M., Kubiak, M., Pietrzynski, G., Wozniak, P., & Zebrun, K. 1999a, Acta Astronomica, 49, 223
- Udalski et al. (1999b) —. 1999b, Acta Astronomica, 49, 437
- Udalski et al. (1992) Udalski, A., Szymanski, M., Kaluzny, J., Kubiak, M., & Mateo, M. 1992, Acta Astronomica, 42, 253
- Udalski et al. (1998) Udalski, A., Szymanski, M., Kubiak, M., Pietrzynski, G., Wozniak, P., & Zebrun, K. 1998, Acta Astronomica, 48, 1
- Udalski et al. (2008a) Udalski, A., et al. 2008a, Acta Astronomica, 58, 89
- Udalski et al. (2008b) —. 2008b, Acta Astronomica, 58, 329
- van der Marel (2006) van der Marel, R. P. 2006, in The Local Group as an Astrophysical Laboratory, ed. M. Livio & T. M. Brown, 47
- Westerlund (1997) Westerlund, B. E. 1997, The Magellanic Clouds, ed. Westerlund, B. E.
- Wilke et al. (2003) Wilke, K., Stickel, M., Haas, M., Herbstmeier, U., Klaas, U., & Lemke, D. 2003, A&A, 401, 873
- Wozniak & Stanek (1996) Wozniak, P. R., & Stanek, K. Z. 1996, ApJ, 464, 233
- Zagury (2007) Zagury, F. 2007, Ap&SS, 312, 113
- Zaritsky (1999) Zaritsky, D. 1999, AJ, 118, 2824
- Zaritsky et al. (1997) Zaritsky, D., Harris, J., & Thompson, I. 1997, AJ, 114, 1002
- Zaritsky et al. (2004) Zaritsky, D., Harris, J., Thompson, I. B., & Grebel, E. K. 2004, AJ, 128, 1606
- Zaritsky et al. (2002) Zaritsky, D., Harris, J., Thompson, I. B., Grebel, E. K., & Massey, P. 2002, AJ, 123, 855